
 Open Access Article
 This Open Access Article is licensed under a
 Creative Commons Attribution 3.0 Unported Licence
Ensemble-based support vector machine classifiers as an efficient tool for quality assessment of beef fillets from electronic nose data†
Fady
Mohareb
*a,
Olga
Papadopoulou
b,
Efstathios
Panagou
b,
George-John
Nychas
b and
Conrad
Bessant
c
aBioinformatics Group, Department of Agrifood, School of Energy, Environmental and Agrifood, Cranfield University, College Road, Cranfield, Bedfordshire, MK43 0AL, UK. E-mail: f.mohareb@cranfield.ac.uk; Tel: +44 (0)777 588 4779
bLaboratory of Microbiology and Biotechnology of Foods, Department of Food Science and Technology, Agricultural University of Athens, Iera Odos 75, Athens, GR-11855, Greece
cSchool of Biological and Chemical Sciences, Queen Mary University of London, Mile End Road, London, E1 4NS, UK
First published on 6th April 2016
Abstract
Over the past years, the application of electronic nose devices has been investigated as a potential tool for assessing food freshness. This relies on the application of various pattern recognition methods to provide accurate classification and regression models. The models' accuracy depends on the number of samples used during the training process. This often leads to unstable and unreliable classifiers in the case of food quality assessment, where the number of samples is typically less than 200 for a given experiment. The aim of this work is to tackle this problem through the development of a series of ensemble-based classifiers and regression models using support vector machines and electronic nose datasets based on the previously published work of this group. It was found that the developed ensemble provides a higher prediction accuracy compared to the single model approach when estimating the freshness score assigned by the sensory panel; achieving an overall accuracy of 84.1% compared to 72.7% in the case of the single classifier model. Another set of calibration ensembles were developed based on SVM-regression, in order to predict bacterial species counts, achieving an increase in the average overall performance of 85.0%, compared to 76.5% when a single classifier was applied. This increase in the predictive power therefore suggests that combining an electronic nose with ensemble-based systems can be used as an innovative method to assess the freshness of beef fillets.
1. Introduction
The current practice of assessment/evaluation of food quality and safety relies heavily on regulatory inspection and sampling regimes. For example, according to EU authorities1 the quality of fresh meat is evaluated only by viable counts of bacteria able to grow on a very generic medium or on counts of the Enterobacteriaceae family. It is well established that counting colonies is certainly time-consuming and it does not allow an online response, which would be needed to trigger appropriate corrective measures. Moreover, both the analysis of limited samples and/or their low counts, can significantly underestimate the microbial contribution to meat quality because the contribution of certain microbial taxa through growth and release of key spoilage molecules can be overlooked with a consequent negative effect on spoilage prevention and handling by the major operators in the meat chain. The conventional approach, described above, seems inadequate because it cannot sufficiently guarantee consumer protection since 100% inspection and sampling is technically, financially and logistically impossible. Instead the meat industry needs rapid analytical methods or tools to determine and select suitable processing procedures for their raw material and to predict the remaining shelf life of their products. Furthermore, the meat business operators for the wholesale and retail sectors need these methods to ensure the freshness and safety of their products and to resolve potential disputes between buyers and sellers. Tools and approaches are also desirable for the reliable indication of the safety and quality status of meat at retail and through consumption by the consumers. It is, therefore, crucial to have valid methods and tools to monitor freshness and safety in order to allow the consumers to be ensured of quality.Electronic noses are among those instruments that may be potentially useful to the meat industry. Technically, E-noses comprise an array of electronic chemical sensors with partial specificity in tandem with an appropriate pattern recognition system allowing the recognition of simple or complex odours.2 So far these instruments have been applied in a diverse range of applications, even on line, in the food industry such as process monitoring, shelf-life determination, spoilage evaluation, authenticity assessment, and quality control studies (for a comprehensive review see3). For instance, Hasan et al.4 have successfully deployed an E-nose to identify decayed products within meat products by identifying the smell signature of fresh beef mixed with decayed fish, and fresh fish with decayed beef. An E-nose has also been previously used to detect volatile compounds produced by foodborne bacteria in contaminated beef.5 Further applications of E-noses include profiling of seasoning and grading in beef and chicken products,6 spoilage profiling in beef products,7 and discrimination between storage periods in cod-fish8 and eggs.9
The data generated by E-nose instruments are too abstract to be of use without some kind of processing to map the data to commonly used freshness metrics such as microbiological counts or sensory scores. This mapping can be performed by the application of advanced statistical methods (partial least squares discriminant analysis,8 clustering algorithms,10 and other methods under the chemometrics banner) and machine learning methodologies (artificial neural networks9 and support vector machines11).
One common problem often associated with machine learning classifiers is the poor performance when tested against unseen data, despite promising performance on the training set, which is usually an indication of model over-fitting. A good training performance of a given classifier does not necessarily mean a good generalization performance (i.e. performance of the classifier on data not seen during the training process). Furthermore, a set of classifiers with similar training performance may have a different generalization performance, this variability in performance will become even more evident when the classifier’s performance is evaluated against a new dataset generated by a different experiment.12 For this reason, an ensemble of several classifiers has been shown in other applications to overcome this limitation, by combining different results (or votes) obtained by all the classifiers within the ensemble.13 The overall performance of a given ensemble depends to a large extent on the quality of the training set and how representative it is to the field data.
Another problem that is often associated with electronic nose outputs and food spoilage datasets in general, is the limited number of available samples, usually not more than 150 samples per experiment. In the absence of a good-sized adequate training subset, resampling techniques can be applied in order to generate a series of random overlapping subsets, each of which can be used to train a classifier to form the ensemble.12
In this work, we present the first ensemble-based predictive tool for assessing the freshness of beef fillets using an electronic nose dataset. Generally speaking, the freshness of meat products is assessed using two methods; the first method is based on a sensory score, assigned for a given sample by highly trained taste panels based on the perception of colour and smell before and after cooking,14 the second freshness assessment method is based on enumeration of bacterial counts in a given sample as a quantitative indicator of spoilage. This includes total viable counts (TVC), Pseudomonas spp., Brochothrix thermosphacta, Enterobacteriaceae and lactic acid bacteria. For this purpose, two sets of ensembles were developed, based on our previously published data.11 These are: a classification set to predict the sensory quality of fillets stored aerobically under different isothermal conditions (0, 4, 8, 12, and 16 °C), and a regression set of ensemble-based systems to estimate the microbial counts directly from sensor array data (electronic nose). In this approach, we compare the predictive powers of a set of single SVM classifiers to predict sensory score values as well as bacterial counts, versus a series of ensemble-based systems, consisting of 200 individual models each.
2. Materials and methods
2.1. Experimental analyses
A detailed description of the microbiological analyses carried out in this work is presented elsewhere.15 In brief, fresh beef fillets (M. longissimus dorsi, pH = 5.6) obtained from different carcasses were purchased from the Central Meat Market in Athens and transported under refrigeration to the laboratory within 30 min, then divided in portions of 50 g in a laminar flow cabinet and packed aerobically.Samples were stored under controlled isothermal conditions at 0, 4, 8, 12, and 16 °C in high precision (±0.5 °C) incubators for up to 430 h, depending on storage temperature, until spoilage was pronounced. Total viable counts (TVC), Pseudomonas spp., Brochothrix thermosphacta, Enterobacteriaceae and lactic acid bacteria, were enumerated in parallel with the sensory evaluation of beef fillets as reported elsewhere.16,17 A three-class evaluation scheme was employed in this experiment. The first class (fresh) corresponded to acceptable meat quality and absence of off-flavours; the second class (semi-fresh) corresponded to the presence of slight off-flavours but not spoiled (still acceptable quality); and the third class (spoiled) corresponded to clear development of off-flavours (unacceptable quality). Semi-fresh was the first indication of meat spoilage (incipient spoilage) in which the sample was marginally accepted. Overall, 177 beef fillet samples were scored by the taste panel and discriminated into the defined groups as fresh (42), semi-fresh (63), and spoiled (72).
For electronic nose measurements, a gas sensor array system (LibraNose, Technobiochip, Napoli, Italy) implemented with an array of 8 quartz crystal microbalance (QMB) non-selective sensors coated with different poly-pyrrole derivatives, synthesized at Technobiochip was used to generate a chemical fingerprint of the volatile compounds of beef fillet samples during storage. The active matrix (poly-pyrrole polymers) used to coat the quartz microbalance sensors of Libra nose and the sensitivity of each one of the 8 sensors to particular volatile compounds are reported elsewhere.18
Further details on the LibraNose instrumentation and mode of action can be found elsewhere.19 A schematic representation of the LibraNose system is provided in ref. 20.
For each measurement, a beef fillet sample of 5 g was introduced inside a 100 ml volume glass jar and left at room temperature (20 °C ± 2 °C) for 15 min to enhance desorption of volatile compounds from the meat into the headspace. The headspace was then pumped over the sensors of the electronic nose and the generated signal was continuously and in real time recorded and stored to a laptop computer.
2.2. Ensemble-based support vector machines
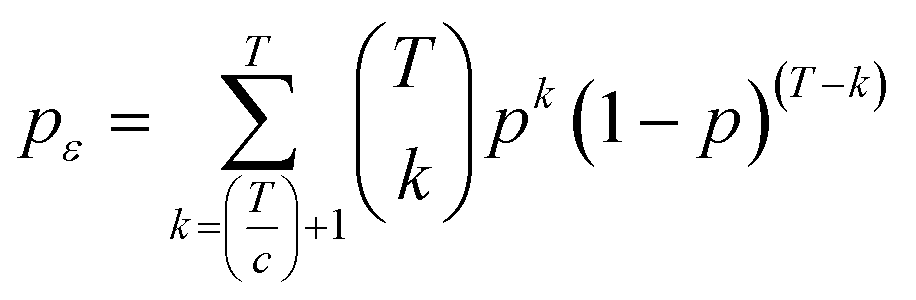
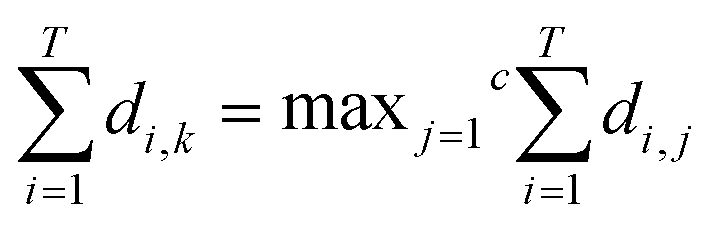
Support vector machines SVMs are a relatively new tool introduced by Vapnik,21 that has gained popularity over the past decade as a promising machine learning technique for pattern classification and regression problems. It is a supervised learning method for object classification in n-dimensional hyperspace while advances in optimisation and generalisation methods are used to increase efficiency and prevent “over-fitting”.22 SVMs can simultaneously minimise estimation errors and model dimensions.23 More background details about SVMs can be found in.22 Statistical analysis was performed using the open-source software environment R. SVM classification and regression models were developed using the R library “e1071”. The library allows a modification of the original SVM classification approach to be applied to a multi-class problem (fresh, semi-fresh, and spoiled). In order to enhance the computational speed needed to generate the classifiers ensemble, the libraries “doMC” and “foreach” were deployed to allow parallel development of the models ensemble. Firstly, the function “registerDoMC()” is used to register the number of CPU cores that can be allocated for the analysis, followed by deploying the function “foreach” to allow each ensemble model to be developed and optimised in parallel.The rationale behind the ensemble-based method is to develop a group of classifiers where the final prediction output is a result of combining individual prediction of all classifiers within the ensemble.24 The key for an ensemble to have more accurate prediction than any of its individual members is to ensure that the classifiers are diverse and have accurate individual performance.25 For instance, let us consider an ensemble ε of T classifiers where ε = {D1, …, DT} and an unseen test sample x. If no diversion exists between D1, …, DT and if D1(x) is wrong, then D2(x) to DT(x) are also wrong. However, if there is no correlation of the errors made by the different classifiers, then if D1(x) is wrong and the majority of D2(x) to DT(x) are right, then, by applying a majority voting system will correctly classify x. This of course requires that the individual classifiers within ε have a good accuracy. If there are a total of T classifiers for a c-class problem, the ensemble decision will be correct if at least [T/c + 1] classifiers choose the correct class.12 Assume that each classifier of ε has a probability p of choosing the right class, then the ensemble's probability of choosing the right class has a binomial distribution and the probability of choosing k > T/c + 1 correct classifiers out of T is:
The general outline for developing a classifier ensemble is shown in Fig. 1.
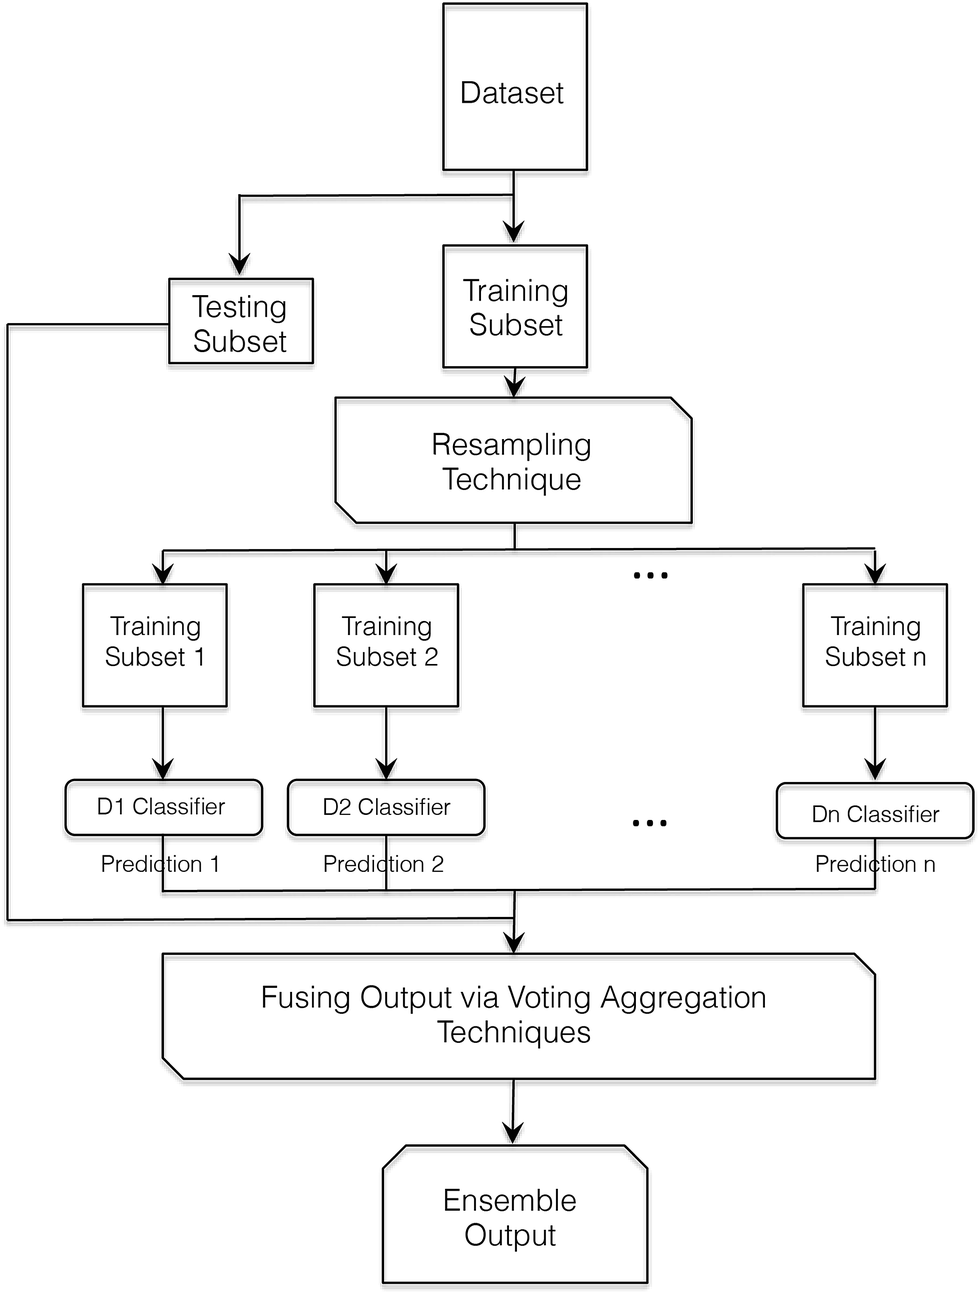 | ||
| Fig. 1 Flowchart showing processes involved with developing a pattern recognition ensemble-based system. The experimental data is divided into training and testing subset. Depending on the size of the training subset and the classification algorithm being applied, a suitable resampling technique (e.g. bootstrapping) is applied to reproduce overlapping random subsets of training subset for each classifier. The ensemble is then used to classify the unseen testing subset samples, where the total output of all classifiers forming the ensemble is fused by applying a suitable voting technique (e.g. majority voting, weighted majority voting and naïve Bayes). | ||
Voting ties are then resolved arbitrarily. Despite the simplicity of implementation of the majority voting concept, the method has a main drawback: it does not take into account the accuracy of individual classifiers within the ensemble. This is a minor issue if the ensemble does not suffer from a large variation between individual performances and when classifier accuracy is generally good. However, if this is not the case, this will have an impact on the final accuracy of prediction. In this case, it will be more appropriate to apply the weighted output fusion method.
2.3. Models implementation
![[thin space (1/6-em)]](https://www.rsc.org/images/entities/char_2009.gif) :1 ratio respectively. The training subset is divided further into training Ts and testing Ss subsets using the same ratio (3:1). For each C and γ parameter combination, the Ts subset is used to train the SVM model while the accuracy is measured by classifying the Ss subset.
:1 ratio respectively. The training subset is divided further into training Ts and testing Ss subsets using the same ratio (3:1). For each C and γ parameter combination, the Ts subset is used to train the SVM model while the accuracy is measured by classifying the Ss subset.
The same approach was followed for developing a series of regression SVM calibration models. SVM regression (SVM-R) models were built in an attempt to correlate the population of selected microbial groups, namely total viable counts (TVC), Pseudomonas spp., B. thermosphacta, Enterobacteriaceae, and lactic acid bacteria, to the responses of the electronic nose sensors. In this case, the signals of the sensors were used as input variables in the SVM regression models and the output was the counts of each individual microbial group. For a given regression problem, the goal of SVM is to find the optimal hyper-plane from which the distance to all the data points is minimum. The kernel function type selected in the development of SVM regression models was also the radial basis function (RBF).
Bagging. The overall implementation for the bagging approach is shown in Fig. 2. Firstly, the original dataset Z is split into a training subset T and a testing subset S. The training subset T is divided further into training Ts and testing Ss. Ts is then bootstrapped into a 330 subset using resampling, where a grid search using the parameter ranges C = [1, 2, 3, …, 30] and γ = [0.1, 0.2, 0.3, …, 5] is performed in order to identify the optimum C and γ values. The final SVM classifier is then developed using these parameters before being added to the ensemble. This procedure is repeated 200 times until the entire ensemble is generated. The ensemble is used in order to label the unseen testing subset S samples. The final ensemble classification is calculated using a voting aggregation method. In this work, the voting output fusion methods applied were: majority voting, weighted majority voting, and naïve Bayes.
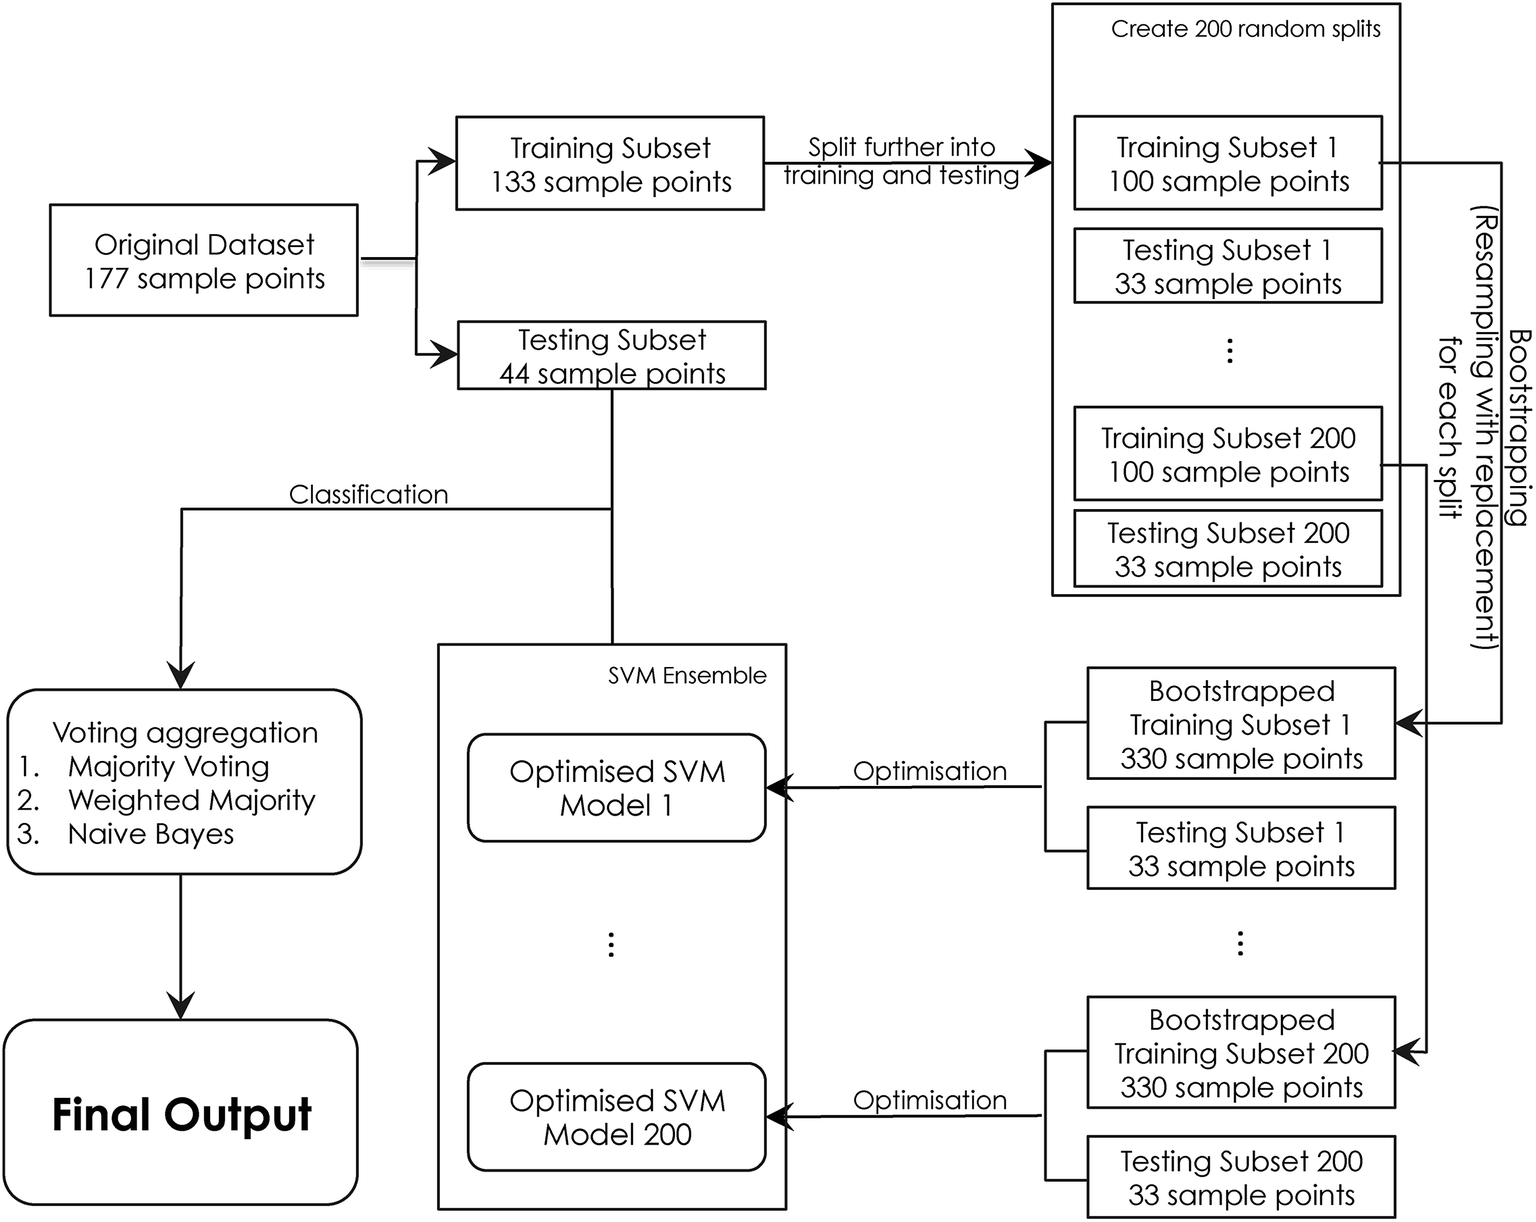 | ||
| Fig. 2 Flowchart illustrating the development process for SVM ensembles. The original dataset is split randomly into training and testing subset. The split algorithm ensures enough representable samples within each class. The training subset is randomly split further into training and testing, in order to perform the optimisation process. The optimum parameters are used to build the final SVM model, which is then added to the ensemble, this process is repeated 200 times for all 200 classifiers forming the ensemble. The testing subset (44 samples) is used to assess the prediction accuracy of the ensemble by applying a various voting aggregation methods (majority voting, weighted majority voting, and naïve Bayes). | ||
Boosting – Adaboost.M1. The initial data splitting into training and testing subsets for Adaboost.M1 as well as the classifiers optimisation procedure applied is similar to the approach followed for bagging as described in Fig. 2. The algorithm developed to generate the ensembles is provided in the accompanying ESI S2.†
Performance metrics. The performance of the classification and regression models developed was assessed in terms of accuracy of prediction. In the case of the sensory score classification models, the performance was obtained by calculating the percentage of the number of the correctly classified samples in the three sensory scores out of the total number of the samples within the dataset. For the bacterial count regression models, a similar process was followed; for a given sample, the prediction was considered a mismatch if the difference between the predicted and the actual value is larger than 1
log value as follows:| ht(xi) ≠ yi if ht(xi) − yi > 1 |
The overall model performance is the percentage of correctly classified samples out of the total number of samples analysed.
3. Results and discussion
The microbiological analyses carried out in this work is presented elsewhere.15 In brief, the total viable counts (TVC), Pseudomonas spp., Brochothrix thermosphacta, Enterobacteriaceae and lactic acid bacteria, were enumerated in parallel with the sensory evaluation of beef fillets as reported elsewhere.16,17 The sensory panel judged a meat sample as semi-fresh after 73, 73, 58, 30 and 24 h at 0, 4, 8, 12 and 16 °C respectively. Furthermore, when the sensory panel identified a sample as spoiled, the total viable count was found at 6.9–9.57log cfu g−1 (mean = 8.6 cfu g−1), which is in line with previous findings, that bacterial counts of 7–8log cfu g−1 can cause off-odours and slime.36
A series of six single RBF-SVM classifiers were developed based on electronic nose measurements, in order to predict the sensory score as well as bacterial species counts. The optimum parameters for each model were identified using grid search, these parameters were used in order to build the final set of models using the training set T. Model accuracy was measured using the testing subset S. The overall classification accuracy and individual classification parameters are summarised in Table 1, while the graphical presentation of observed vs. predicted values for various groups of microorganisms are shown in Fig. 3. The sensory scores model achieved 72.7% overall classification accuracy when tested against the randomly selected testing subset S, showing a performance of 60%, 64.2% and 93.3% for fresh, semi-fresh and spoiled sample classes respectively. The prediction confusion matrix for sensory scores prediction is shown in Table 2. The bacterial species count models showed a performance ranging from 70.4% for total viable counts, to 87.2% for B. thermosphacta.
| Classifier type | Overall accuracy |
|---|---|
| a TVC: total viable counts; CFC: Pseudomonas spp.; STAA: B. thermosphacta; MRS: lactic acid bacteria; VRBGA: Enterobacteriaceae. | |
| RBF-SVM sensory | 72.7% |
| RBF-SVM TVC | 70.4% |
| RBF-SVM CFC | 75.0% |
| RBF-SVM STAA | 77.27% |
| RBF-SVM MRS | 87.2% |
| RBF-SVM VRBGA | 72.72% |
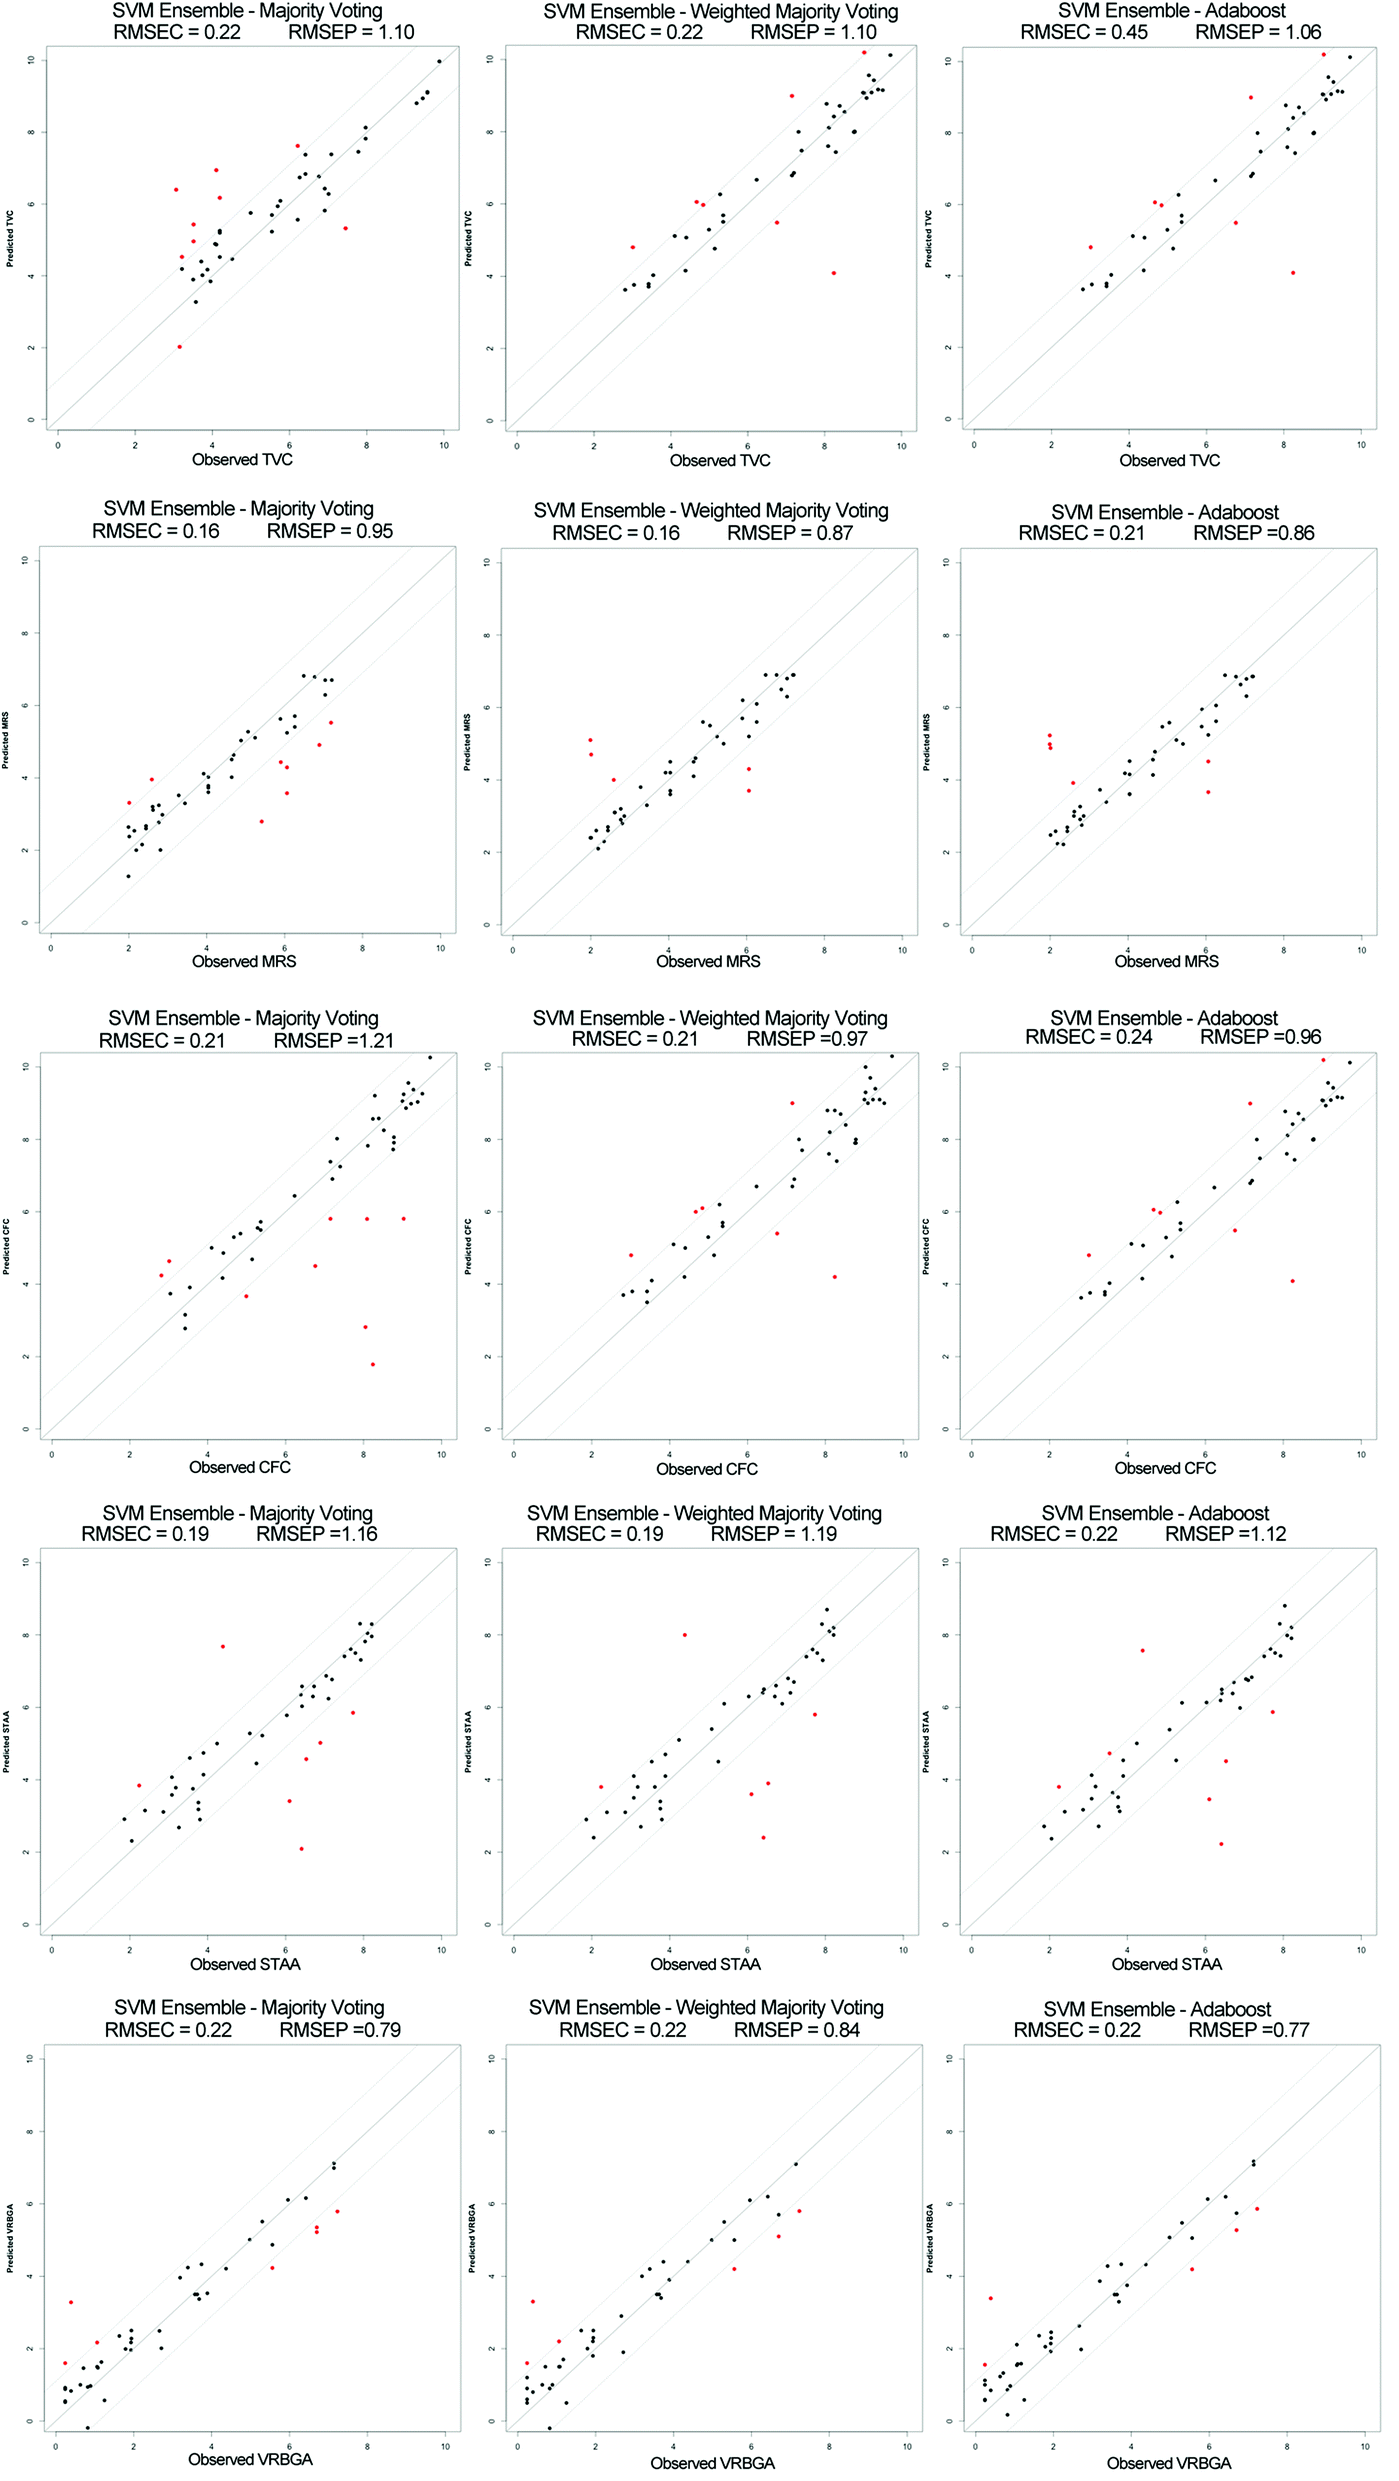 | ||
| Fig. 3 Plot comparing the observed against the predicted values of Total Viable Counts (TVC), lactic acid bacteria (MRS), Pseudomonads (CFC), B. thermosphacta (STAA) and Enterobacteriaceae (VRBG) obtained by different Support Vector Machine (SVM) Ensemble models (majority voting, weighted majority voting and Adaboost). | ||
| True vs. predicted sensory classes | ||||
|---|---|---|---|---|
| Fresh | Semi-fresh | Spoiled | Total | |
| Fresh | 9 | 0 | 0 | 60.0% |
| Semi-fresh | 5 | 9 | 1 | 64.2% |
| Spoiled | 1 | 5 | 14 | 93.3% |
| Total | 15 | 14 | 15 | 72.7% |
The bagging approach26 was followed to develop an ensemble-based system24 for predicting quality based on the sensory evolution scores given by the panel as described earlier. The dataset was split into training and a testing subset. For each of the classifiers forming the ensemble, the training subset was bootstrapped to form a subset of 330 samples, which is then divided further into training and testing subsets in order to perform the grid search optimization process as described in Fig. 2. The ensemble prediction accuracy was calculated using the testing subset and the final output was computed using various aggregation methods. As shown in Table 3, the bagging approach has improved the overall prediction accuracy by more than 10% when compared to the single classifier performance when assessed using the same unseen testing subset, showing a performance of ∼83%. All aggregation methods applied for output fusing performed equally well. Naïve Bayes aggregation showed the best classification performance, with an overall accuracy of 84.10%.
| Ensemble approach | Aggregation method | Overall accuracy | Fresh | Semi-fresh | Spoiled |
|---|---|---|---|---|---|
| Bagging | Majority voting | 83.5% | 70.2% | 80.0% | 100% |
| Weighted majority voting | 83.3% | 69.7% | 79.9% | 100% | |
| Naïve Bayes | 84.1% | 75.2% | 76.5% | 100% | |
| Boosting | Weighted majority voting | 83.6% | 69.8% | 97.9% | 100% |
Another set of ensemble-based classifiers were also developed using the boosting approach, and the final ensemble output was fused using weighted majority voting aggregation (Adaboost.M1),28 which showed an overall and individual classes similar to the bagging ensemble as shown in Table 4. The root mean square of error for both calibration (RMSEC) and prediction (RMSEP) were calculated for each developed ensemble as shown in Table 5.
| Bagging | Boosting | ||
|---|---|---|---|
| Majority voting | Weighted majority voting | Adaboost.M1 | |
| a TVC: total viable counts; CFC: Pseudomonas spp.; STAA: B. thermosphacta; MRS: lactic acid bacteria; VRBGA: Enterobacteriaceae. | |||
| TVC | 68.9% | 78.8% | 79.5% |
| CFC | 77.5% | 85.9% | 83.6% |
| STAA | 78.4% | 84.5% | 83.9% |
| MRS | 81.3% | 88.0% | 87.4% |
| VRBGA | 77.9% | 84.9% | 87.3% |
| Majority voting | Weighted majority voting | Adaboost.M1 | |
|---|---|---|---|
| a TVC: total viable counts; MRS: lactic acid bacteria; CFC: Pseudomonas spp.; STAA: B. thermosphacta; VRBGA: Enterobacteriaceae. | |||
| TVC | |||
| RMSEC | 0.22 | 0.22 | 0.45 |
| RMSEP | 1.1 | 1.1 | 1.06 |
|
|||
| MRS | |||
| RMSEC | 0.16 | 0.16 | 0.16 |
| RMSEP | 0.95 | 0.87 | 0.87 |
|
|||
| CFC | |||
| RMSEC | 0.19 | 0.19 | 0.22 |
| RMSEP | 1.16 | 1.15 | 1.12 |
|
|||
| STAA | |||
| RMSEC | 0.19 | 0.19 | 0.19 |
| RMSEP | 0.79 | 1.19 | 1.12 |
|
|||
| VRBGA | |||
| RMSEC | 0.22 | 0.22 | 0.22 |
| RMSEP | 0.79 | 0.84 | 0.77 |
Furthermore, a set of ensemble-based classifiers were developed based on RBF-SVM for regression, to predict bacterial species count values. Similarly to sensory score prediction, two ensemble systems were developed using bagging and boosting approaches for each species count type. The same procedures were followed for bootstrapping and grid search parameters optimization. The ensembles prediction accuracies were computed using majority and weighted majority voting aggregation for bagging, and weighted majority voting in the case of boosting as shown in Fig. 3. It was noted that the prediction accuracy for bagging combined with weighted majority voting was similar to Adaboost.M1, which was also significantly higher than bagging combined with majority voting. The best prediction accuracy for total viable counts and Enterobacteriaceae was achieved using Adaboost, showing a performance of 79.5% (RMSEP = 1.06) and 87.3% (RMSEP = 0.77) respectively. On the other hand, bagging combined with weighted majority voting was found to give the best prediction while for Pseudomonas spp., B. thermosphacta, and lactic acid bacteria, with prediction accuracy of 85.9 (RMSEP = 1.15), 84.5 (RMSEP = 1.19) and 88.0% (RMSEP = 0.84) respectively.
For each ensemble system developed, a total of 200 classifiers were included. This was found to be a sufficient number to stabilise the ensemble prediction accuracy. In order to assess stability, each ensemble was built in an accumulative manner, where one SVM model was added to the ensemble at a time, and the overall prediction accuracy was assessed using the unseen testing subset S, the stabilisation process was assessed by individually according to the voting aggregation method applied as shown in Fig. 3.
The sensory score ensemble shows similar stabilisation patterns for all algorithms applied (Fig. 4a), however naïve Bayes was found to stabilise at fewer SVM models, and provided the best overall prediction accuracy at 84.1% as shown in Table 4. For the bacterial count prediction ensembles, bagging combined with weighted majority voting aggregation and Adaboost were found to stabilise at fewer number of SVM models, and showed the best overall accuracy when compared with bagging combined with majority voting (Fig. 4b–f). This stabilisation pattern suggests therefore that the individual classifiers within the bacterial counts ensembles are less stable compared to those of the sensory score ensemble, which is somehow expected for regression models. The classifiers stability was however increased by applying the weighted majority voting aggregation. The ensemble approach followed in this work is comparable to other similar machine learning approaches based on the inclusion of individually trained and optimised multi-models systems to improve the prediction performance. This includes Genetic Programming (GP)37,38 and Successive Progression Algorithm (SPA).39 GP has been previously applied by Ellis et al., 2004 (ref. 40) has been previously applied to successfully estimate meat spoilage based on Fourier transform infrared (FTIR) in tandem with genetic programming to determine the wavenumbers associated with the bacterial spoilage of fresh beef over 24 h.
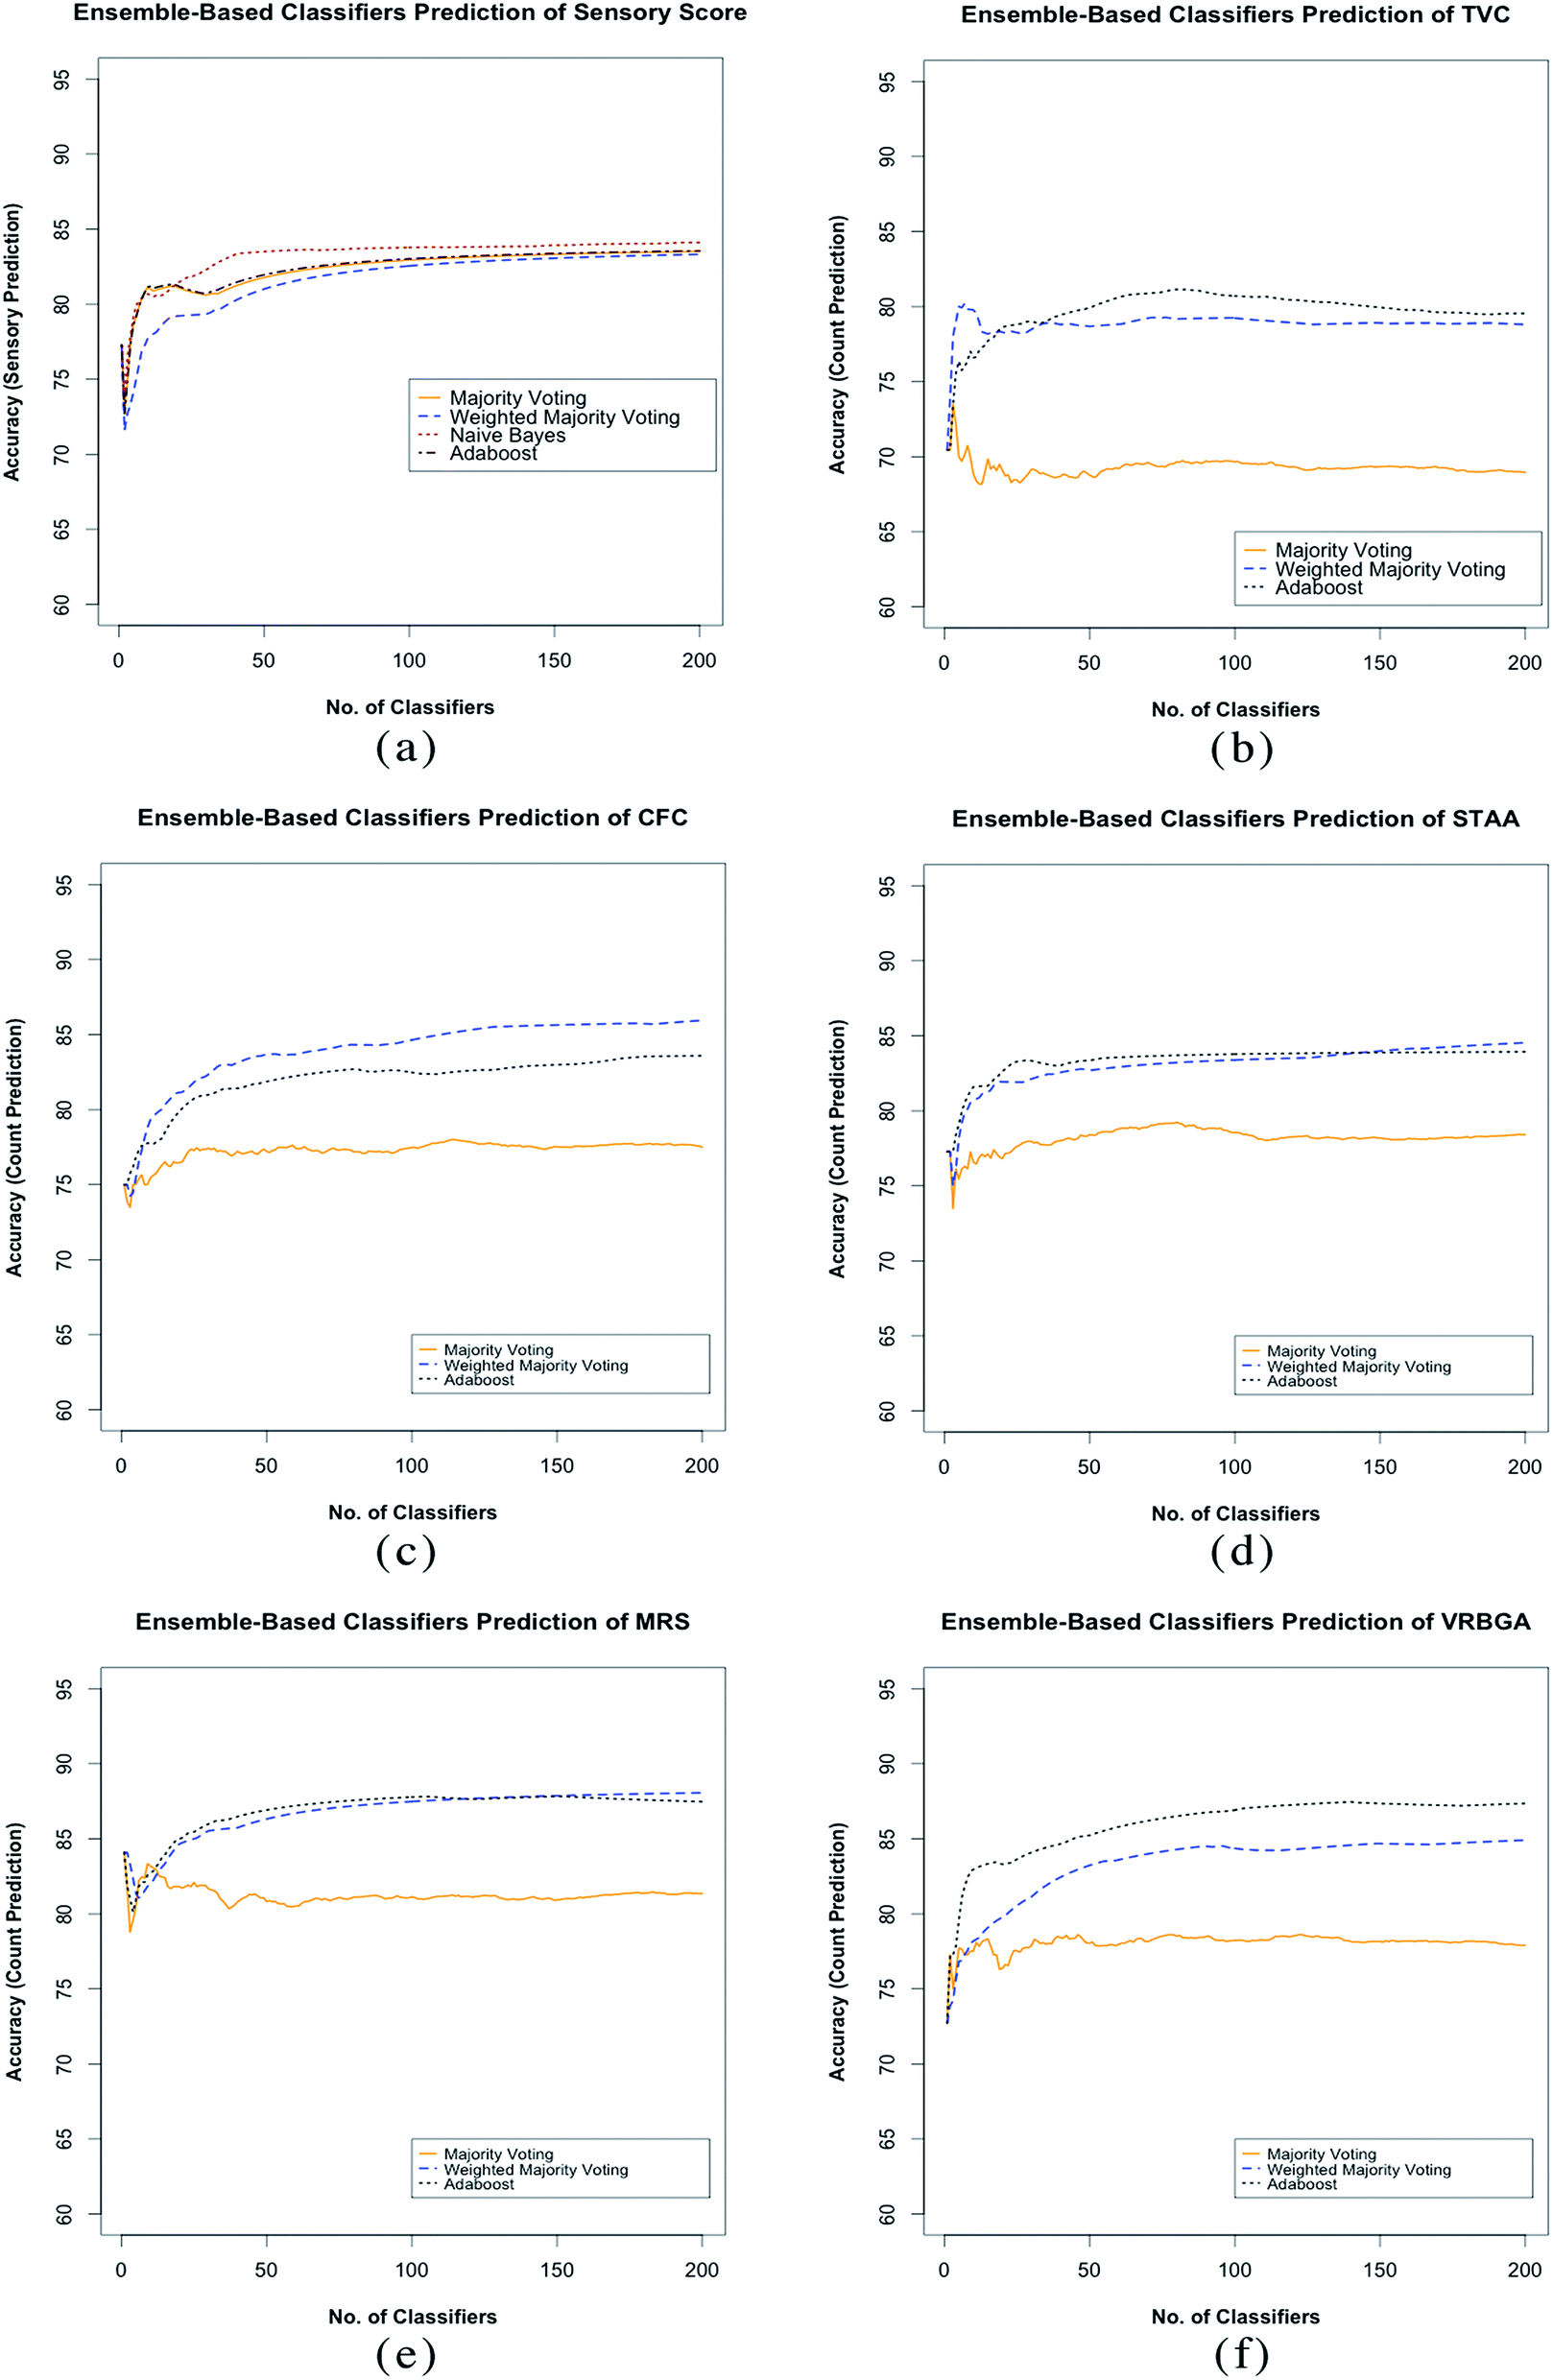 | ||
| Fig. 4 SVM-ensembles stabilisation. (a): sensory scores ensembles: all ensembles follow a similar stabilisation pattern, bagging combined with naïve Bayes voting is found to be stabilised at fewer SVM models compared to the rest of aggregation methods, and has the best prediction performance. (b–f) Stabilisation of the bacterial count prediction ensembles: generally, weighted majority voting and Adaboost shows a better stabilisation and prediction accuracy compared to bagging combined with majority voting. | ||
The grid search performed for hyper-plane optimisation represents a very computationally intensive process, especially when repeated over 200 models for each ensemble developed and various voting aggregation methods. For this purpose, the analysis was performed on a special computing facility of two Intel Xeon processors (six cores each) and 64 GB of RAM, yet each ensemble optimization process takes 8 to 12 hours, which limits the application of this approach in web-based applications. The deployment of the R libraries “doMC” and “foreach” was extremely useful as it reduces the processing time needed to develop the ensemble by almost 10 folds in the case of 12 processor cores. The parallelization of the optimization process becomes a necessity particularly when the input database is of larger dimension as it is the case for spectral data such as nuclear magnetic resonance or near-infrared.
4. Conclusions
While SVMs have already been applied in the food sector and have proven to be successful in a number of practical applications (e.g.ref. 13, 23 and 41), this work presents the first application of ensemble-based SVM systems to assess freshness in beef fillets based on electronic nose datasets. The results obtained in this study demonstrated the potential of using an electronic nose system as a rapid and non-destructive method for spoilage identification of aerobically packaged beef fillets regardless of storage temperature. The collected signal responses could be considered as a volatile fingerprint of an active biological system, containing information for discrimination of meat samples in sensory classes corresponding to different spoilage levels. The application of ensemble classifiers was proven to increase prediction accuracy compared to the application of single classifier models. The classification performance for sensory classes was increased from 72.7% to 84.1% when the same unseen testing subset was used. The overall prediction was also increased in the case of regression models for bacterial species count prediction from 76.5% to 85.0%. This approach highlights therefore the potential of applying electronic nose, as a method of assessing freshness in beef fillets. However, the ensemble development is a computationally expensive task. Future improvement of the presented methodology can be achieved by reducing the processing time needed for model optimization through the parallelization of this process using for example General Purpose Graphical Processing Units (GPGPU).Acknowledgements
The authors acknowledge the Symbiosis-EU (http:/elvis.misc.cranfield.ac.uk/sorf) project (no. 211638) financed by the European Commission under the 7th Framework Programme for RTD. The information in this document reflects only the authors' views and the Community is not liable for any use that may be made of the information contained therein. The authors would also like to thank the company Technobiochip Scarl (Napoli, Italy) for providing the electronic nose for the experimental work.References
- EFSA, E.C., Commission Regulation (EC) No 2073/2005 of November 2005 on microbiological criteria for foodstuffs, 2005. p. 1–26.
- J. W. Gardner and P. N. Bartlett, A Brief-History of Electronic Noses, Sens. Actuators, B, 1994, 18(1–3), 211–220 CAS.
- M. Peris and L. Escuder-Gilabert, A 21st century technique for food control: electronic noses, Anal. Chim. Acta, 2009, 638(1), 1–15 CrossRef CAS PubMed.
- H. Najamul, et al., Meat and fish freshness inspection system based on odor sensing, Sensors, 2012, 12(11), 15542–15557 Search PubMed.
- S. A. Abdallah, et al., The detection of foodborne bacteria on beef: the application of the electronic nose, SpringerPlus, 2013, 2, 687 CrossRef PubMed.
- H. Tian, et al., Discrimination of Chicken Seasonings and Beef Seasonings Using Electronic Nose and Sensory Evaluation, J. Food Sci., 2014, 79(11), S2346–S2353 CrossRef CAS PubMed.
- N. El Barbri, et al., Electronic Nose Based on Metal Oxide Semiconductor Sensors as an Alternative Technique for the Spoilage Classification of Red Meat, Sensors, 2008, 8(1), 142–156 CrossRef CAS.
- C. D. Natale, et al., Comparison and integration of different electronic noses for freshness evaluation of cod-fish fillets, Sens. Actuators, B, 2001, 77(1–2), 572–578 CrossRef CAS.
- D. Ritaban, et al., Non-destructive egg freshness determination: an electronic nose based approach, Meas. Sci. Technol., 2003, 14(2), 190 CrossRef.
- G. Olafsdottir, et al., Prediction of Microbial and Sensory Quality of Cold Smoked Atlantic Salmon (Salmo salar) by Electronic Nose, J. Food Sci., 2005, 70(9), S563–S574 CrossRef CAS.
- O. S. Papadopoulou, et al., Sensory and microbiological quality assessment of beef fillets using a portable electronic nose in tandem with support vector machine analysis, Food Res. Int., 2013, 50(1), 241–249 CrossRef.
- R. Polikar, Ensemble Based Systems in Decision Making, IEEE Circ. Syst. Mag., 2006, 6(3), 21–45 CrossRef.
- M. Sattlecker, et al., Support vector machine ensembles for breast cancer type prediction from mid-FTIR micro-calcification spectra, Chemom. Intell. Lab. Syst., 2011, 107(2), 363–370 CrossRef CAS.
- C. O. Gill and L. E. Jeremiah, The storage life of non-muscle offals packaged under vacuum or carbon dioxide, Food Microbiol., 1991, 8(4), 339–353 CrossRef CAS.
- O. S. Papadopoulou, et al., Rapid assessment of meat quality by means of an electronic nose and support vector machines, in 11th International Congress on Engineering and Food, Procedia Food Sci., 2011, 1, 2003–2006 CrossRef.
- M. S. Ammor, A. Argyri and G. J. Nychas, Rapid monitoring of the spoilage of minced beef stored under conventionally and active packaging conditions using Fourier transform infrared spectroscopy in tandem with chemometrics, Meat Sci., 2009, 81, 507–514 CrossRef CAS PubMed.
- A. Argyri, et al., Rapid qualitative and quantitative detection of beef fillets spoilage based on Fourier transform infrared spectroscopy data and artificial neural networks, Sens. Actuators, B, 2009, 145(1), 146–154 CrossRef.
- M. Baietto, et al., Evaluation of three electronic noses for detecting incipient wood decay, Sensors, 2010, 10(2), 1062–1092 CrossRef CAS PubMed.
- A. Z. Berna, et al., Electronic nose systems to study shelf life and cultivar effect on tomato aroma profile, Sens. Actuators, B, 2004, 97, 324–333 CrossRef CAS.
- A. D'Amico, et al., Technologies and tools for mimicking olfaction: status of the Rome “Tor Vergata” electronic nose, Biosens. Bioelectron., 1998, 13(6), 711–721 CrossRef.
- V. N. Vapnik, The Nature of Statistical Learning Theory, Springer, New York, 1995, xv, p. 188 Search PubMed.
- N. Cristianini and J. Shawe-Taylor, An introduction to support vector machines and other kernel-based learning methods, Cambridge University Press, Cambridge, 2000, xi, p. 189 Search PubMed.
- K. P. Singh, N. Basant and S. Gupta, Support vector machines in water quality management, Anal. Chim. Acta, 2011, 703(2), 152–162 CrossRef CAS PubMed.
- T. G. Dietterich, Ensemble Methods in Machine Learning, in Proceedings of the First International Workshop on Multiple Classifier Systems, Springer-Verlag, 2000. pp. 1–15 Search PubMed.
- L. K. Hansen and P. Salamon, Neural Network Ensembles, IEEE Trans. Pattern Anal. Mach. Intell., 1990, 12(10), 993–1001 CrossRef.
- X. Wang, et al., Pattern recognition approaches and computational systems tools for ultra performance liquid chromatography-mass spectrometry-based comprehensive metabolomic profiling and pathways analysis of biological data sets, Anal. Chem., 2012, 84(1), 428–439 CrossRef CAS PubMed.
- C. Dong-Sheng, et al., The boosting: a new idea of building models, Elsevier, Amsterdam, PAYS-BAS, 2010, vol. 100, pp.1–11 Search PubMed.
- L. I. Kuncheva, Combining pattern classifiers: methods and algorithms, John Wiley, Hoboken, N.J.; Chichester, 2004, xx, p. 350 Search PubMed.
- P. Domingos and M. Pazzani, On the Optimality of the Simple Bayesian Classifier under Zero-One Loss, Mach. Learn., 1997, 29(2–3), 103–130 CrossRef.
- R. O. Duda, P. E. Hart and D. G. Stork, Pattern Classification, John Wiley & Sons, New York, 2001 Search PubMed.
- Y. Freund and R. E. Schapire, A decision-theoretic generalization of on-line learning and an application to boosting, in Proceedings of the Second European Conference on Computational Learning Theory, Springer-Verlag, 1995, pp. 23–37 Search PubMed.
- R. A. Ochs, et al., Automated classification of lung bronchovascular anatomy in CT using AdaBoost, Med. Image Anal., 2007, 11(3), 315–324 CrossRef PubMed.
- H. Masnadi-Shirazi and N. Vasconcelos, Cost-sensitive boosting, IEEE Trans. Pattern Anal. Mach. Intell., 2011, 33(2), 294–309 CrossRef PubMed.
- S. G. Armato 3rd, et al., Automated lung nodule classification following automated nodule detection on CT: a serial approach, Med. Phys., 2003, 30(6), 1188–1197 CrossRef PubMed.
- B. James and B. Yoshua, Random search for hyper-parameter optimization, J. Mach. Learn. Res., 2012, 13, 281–305 Search PubMed.
- K. Koutsoumanis, et al., Development of a microbial model for the combined effect of temperature and pH on spoilage of ground meat, and validation of the model under dynamic temperature conditions, Appl. Environ. Microbiol., 2006, 72(1), 124–134 CrossRef CAS PubMed.
- H. H. John, Adaptation in natural and artificial systems, MIT Press, 1992, p. 211 Search PubMed.
- R. K. John, Genetic programming: on the programming of computers by means of natural selection, MIT Press, 1992, p. 680 Search PubMed.
- H. Martens and T. Naes, Multivariate calibration, Wiley, New York, 1989 Search PubMed.
- D. I. Ellis, et al., Rapid and quantitative detection of the microbial spoilage of meat by Fourier transform infrared spectroscopy and machine learning, Appl. Environ. Microbiol., 2002, 68(6), 2822–2828 CrossRef CAS PubMed.
- K. Brudzewski, S. Osowski and T. Markiewicz, Classification of milk by means of an electronic nose and SVM neural network, Sens. Actuators, B, 2004, 98(2–3), 291–298 CrossRef CAS.
Footnote |
| † Electronic supplementary information (ESI) available. See DOI: 10.1039/c6ay00147e |
| This journal is © The Royal Society of Chemistry 2016 |