 Open Access Article
Creative Commons Attribution 3.0 Unported Licence
Detecting carbohydrate–lectin interactions using a fluorescent probe based on DBD dyes†
D.
Bader
a,
D. T.
Klier
a,
C.
Hettrich
b,
F. F.
Bier
b and
P.
Wessig
*a
aInstitut für Chemie, Universität Potsdam, Karl-Liebknecht-Str. 25-26, D-14476 Potsdam, Germany. E-mail: wessig@uni-potsdam.de
bFraunhofer IZI-BB, Am Mühlenberg 13, D-14476 Potsdam, Germany
First published on 14th January 2016
Abstract
Herein we present an efficient synthesis of a biomimetic probe with modular construction that can be specifically bound by the mannose binding FimH protein – a surface adhesion protein of E. coli bacteria. The synthesis combines the new and interesting DBD dye with the carbohydrate ligand mannose via a Click reaction. We demonstrate the binding to E. coli bacteria over a large concentration range and also present some special characteristics of those molecules that are of particular interest for the application as a biosensor. In particular, the mix-and-measure ability and the very good photo-stability should be highlighted here.
Nowadays, fluorescent dyes play an extremely important role in biochemistry, medical diagnostics, and ingredient research.1 Despite the vast number of fluorophores hitherto used for these purposes, there is ongoing interest in new fluorophores. This is due to the diverse requirements of the applications which are not combined in any fluorescent dye. Excitation and absorbance wavelengths (λabs, λexc), as well as the difference between them (Stokes shift, Δλ), extinction coefficient (ε) and fluorescence quantum yield (ΦF), as well as their product (brightness, ε·ΦF), fluorescence lifetime (τF), bleaching stability and environmental sensitivity are important parameters influencing the usability of a certain dye. Furthermore, the synthetic accessibility and the possibility to link the dye with various biomolecules are decisive criteria for successful application.
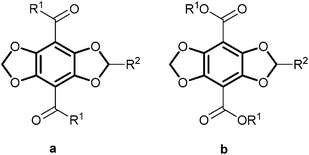
Recently, we have developed a new class of fluorescent dyes, whose structure is based on [1,3]dioxolo[4,5-f][1,3]benzo-dioxole (DBD, bold in Fig. 1) and we called them DBD dyes.2–7 These dyes are characterised by a large Stokes shift (Δλ > 100 nm), combined with long fluorescence lifetimes (τF > 20 ns) and exceptional bleaching stability. τF and ΦF of esters 1b are nearly independent of the polarity of the microenvironment, whereas the respective parameters of ketones 1a exhibit a distinct sensitivity towards their environment. In aqueous surroundings the fluorescence of 1a is nearly completely quenched but it is “switched on” in a hydrophobic environment.2 These properties were already successfully exploited in probes for sensing lipophilic environments, such as micelles and biological membranes3 and for detecting conformational changes of proteins.4,5 The environmental sensitivity was also used in the development of lifetime-based binding assays.6 Very recently, we have introduced a new FRET system with DBD dyes as an acceptor.7
Inspired by these promising results we hypothesised that it should be possible to develop fluorescent probes by linking DBD fluorophores with small molecules, especially carbohydrates, and detect the specific binding event with proteins. Because the recognition of glycoproteins at the surface of human cells by membrane associated proteins of (pathogenic) bacteria is the key event of infection by these germs, this approach should offer the possibility to develop fluorescent probes for the detection of harmful pathogens.
Until now only few groups have been using carbohydrate fluorescent probes as biosensors. One approach is the usage of quantum dots (QDs) as a fluorescent marker. Because of their physical characteristics they have some important advantages like high bleaching stability. Robinson et al. and Coulon et al. introduced CdTe-QDs as water soluble biosensors by having carbohydrates adsorb at their surface.8,9 However, the removal from the surface needs complicated washing procedures. A completely different method is the application of fluorescent glycolised BSA-proteins.10 Kuchler et al. were able to stain endothelial cells. But the protein production is relatively complex and expensive and therefore not suitable for routine diagnostics. Another approach was introduced by Lee et al. in 2007.11 They described the formation of self-assembled glycol-nanoribbons that were called triblock peptides. They consist of a mannose or glucose pyranoside, a PEG spacer and a β-sheet forming peptide. Nile red is encapsulated in their hydrophobic region and thus E. coli bacteria can be detected specifically and with high sensitivity. Nevertheless, this procedure bears the risk of hydrophobic interactions between the dye and target rather than nanoribbon mediated binding. This can cause false positive results.12
Herein we present a simple and modular synthesis of a monovalent carbohydrate fluorescent probe that was used as the biomimetic probe for the specific binding on lectins. To demonstrate the proof-of-principle of this approach we chose mannose as carbohydrate and the non-infectious E. coli bacteria strain DH5α. The DBD dye 2 of the first generation (1a, cf.Scheme 1), which was already successfully applied in protein binding assays,6 was used as the fluorescent marker. Based on the wide ranging dynamic fluorescence properties that depend on the polarity of the surrounding, the DBD dyes are particularly suitable for the application in the biosensor field. It was shown before that the DBD dye has an emission shift of 80 nm from nonpolar to polar solvents. Additionally, it has a Stokes shift up to 157 nm and a high dynamic in the quantum yields. In very polar surroundings, e.g. in water, it is approximately zero, but it increases up to 86% in nonpolar solvents. The DBD dye was synthesized in only 8 steps in good to very good yields.2,4
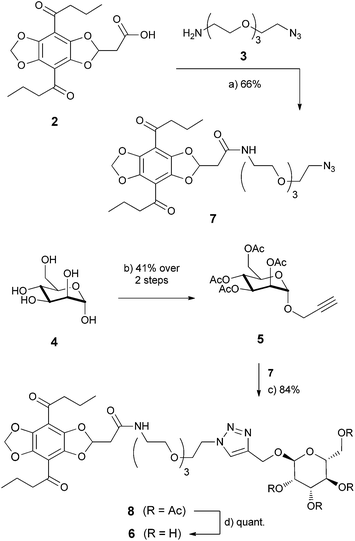
The manno pyranoside 5 was used as the carbohydrate ligand and was synthesized in 2 steps from α-D-manno-pyranoside 4. To connect the DBD dye to the mannose, we used the commercially available linker 3 with an azide group. Due to its structure the linker increases the water solubility of the whole molecule. In this synthesis we followed the method for propargylation of Kusumoto et al. that forms only the α-pyranoside product.13 TMS-Cl is a mediator to form the propargylic ether in the 1-position. This synthesis works in moderate yields of 41%. In a second step the free hydroxyl groups were protected by acetyl groups in quantitative yields to give 5.
The modular combination of the individual building blocks was realised in an orthogonal way by first formation of carboxylic amide 7 followed by a copper catalysed Click-reaction14 to give 8. Both reactions result in good to very good yields with 66% and 84%. It should be noted that we used the CuI/DIPEA catalyst for the latter reaction.14c The final deprotection gives the desired biomimetic probe 6 in quantitative yield (Scheme 1).
The binding studies of 6 were performed on a fluorescence microscope. E. coli bacteria DH5α were cultivated in growth-medium, washed and resuspended in PBS buffer and then incubated for one hour with compound 6 in different concentrations. After incubation the bacteria were washed again and then fixed on glass slides.
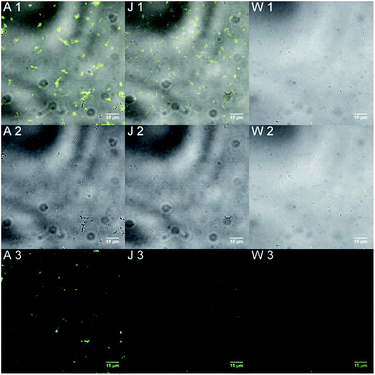
The images were made in different modes: bright field and fluorescence modes. The DBD derivative was excited at λex = 405 nm and detected in an emission range from λem = 530 to 600 nm. A concentration range of compound 6 from 10−3 to 10−12 mol L−1 was investigated.
In Fig. 2 we present only the highest (A) and the lowest (J) concentrations, as well as reference bacteria without treatment with 6 (W). A 2-channel image (1) where the bright field and fluorescence images were merged and then the according bright field (2) and fluorescence (3) images are displayed side by side. The bright field and 2-channel images were used as a first co-localisation of the bacteria.
With these first experiments we could show the binding of compound 6 by E. coli proteins even in very low concentrations.
In a control experiment we examined a possible unspecific binding of the biomimetic probe to the bacteria. For this experiment the acetyl protected compound 8 was used. The highest concentration of c[8] = 10−3 mol L−1 was used to create a clear fluorescence signal for the case that there is unspecific binding. After incubation with this derivative the bacteria were washed with buffer solution and fixed on glass slides. To our delight we could not detect any fluorescence. This means there is no unspecific binding.
To investigate the co-localisation with a better precision we used an E. coli strain DH5α that was transfected with a plasmid code for pDsRed expression. Such bacteria express a red fluorescent protein (RFP) and by means of the fluorescent properties of the proteins they can be located precisely. RFP has an absorption maximum at 558 nm and an emission maximum at 583 nm.15 The investigation was performed using the same protocol as described for the other experiments. The result of the co-localisation with compound 6 (green) and the bacteria (red) is shown in Fig. 3. Again the images were taken in bright field and fluorescence modes. The DBD derivative 6 was excited at λex = 405 nm and the protein was excited at λex = 543 nm. The filter settings were chosen to get as much emission light as possible. A concentration of compound 6 of 10−7 mol L−1 was used to get an optimal image contrast result.
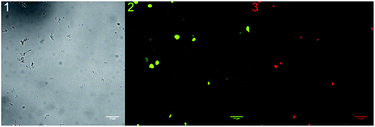 | ||
| Fig. 3 Microscopy images for co-localization investigation. (1) = bright field, (2) = fluorescence 6 (λex = 405 nm, λem = 530–600 nm), and (3) = fluorescence RFP (λex = 543 nm, λem = 560 nm LP). | ||
Fig. 3 shows clearly that the localization of the bacteria by either method gives the same result. Therefore it can reasonably concluded that the obtained fluorescence signals are generated from manno pyranosides 6 bound by bacteria.
Another hot topic for biosensor applications is the bleaching of a fluorescent dye under real conditions. Normally, bleaching times are determined in pure solvents and those times give a good clue how a dye would behave under real conditions. However, a real biological system is much more complex so that it is suitable to investigate this system and get more exact data for the intended application. The bleaching experiments were performed with compound 6 bound on E. coli bacteria and fixed on glass slides.
For a better classification it was compared with 2 commercially available fluorescent dyes often used for microscopy. Those were Epicocconone 9, a dye that is isolated from mushrooms, and SYBR Green 10, a cyanine dye (for UV/VIS, fluorescence spectra and the formulae of 9 and 10 see the ESI†).8,9,16–21
The E. coli strain DH5α was cultivated, incubated and fixed with the comparative dyes featuring the same protocol as for compound 6. In the following the dyes were bleached at λex = 488 nm for compounds 9/10 and λex = 405 nm for compound 6. The filters were chosen in a way that as much emission light as possible could be detected. For every investigated dye a series of 15 times was made in which images were taken in 4 s intervals (the decay curves of 6, 9 and 10 are depicted in the ESI†).
The commercially available dyes 9 and 10 show under real application conditions the same bleaching time dimension with 35 s and 50 s. SYBR Green bleached a little faster than Epicocconone. But it is obvious that compound 6 needs much longer to bleach with a half life time of 183 s and thus shows a higher stability against photo-bleaching (Table 1). For the practical application higher photo-stability is an enormous advantage, because it enables a comfortable working. There is no need to do the preparation work in darkness as it was done in this experiment, nor a hurry working style is necessary when focusing the microscope.
| Compound | Bleaching half life time [s] |
|---|---|
| 6 | 183.2 ± 3.3 |
| 9 | 50.7 ± 1.5 |
| 10 | 35.0 ± 0.5 |
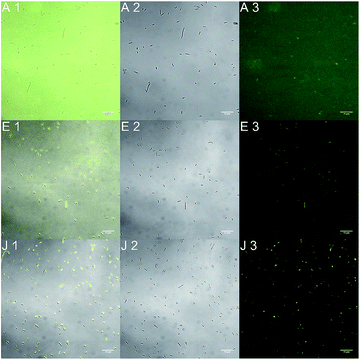
The spectroscopic properties of compound 6 indicated that a direct staining of the bacteria should be possible without further washing procedures. Again the bacteria were incubated with different concentrations of the biomimetic probe and investigated under the microscope (Fig. 4).
At the highest concentration (10−3 mol L−1), the signal to noise ratio of bound to unbound biomimetic probe is poor as no single bacteria can be discriminated from the surrounding in the fluorescence mode. At a concentration of c[6] = 10−7 mol L−1 the signal to noise ratio is much better. The bacteria are clearly distinguishable from the buffer solution. But the best results were obtained with the lowest concentration of c[6] = 10−12 mol L−1. There is no detectable fluorescence signal from the buffer surrounding. It suggests that in low concentration a higher amount of compound 6 is bound to the bacteria. A very good signal to noise ratio of stained bacteria to buffer solution is the result that enables a direct application of the biomimetic probe to the bacteria without any further washing procedures.
Additionally, it could be observed in this experiment that an incubation time of the bacteria with compound 6 of 1 hour is not necessary. The binding could be detected just after a few minutes, after 10 minutes the results were reproducible and even comparable with an incubation time of 1 hour. All in all it represents a very good opportunity for the so-called mix-and-measure-process which stands for a fast on-the-spot-analytics without complex and expensive preparation and washing procedures.
In summary we could present a fast and efficient synthesis for a modular constructed biomimetic probe. This biomimetic probe has the structure of a carbohydrate fluorescent probe and we could show that it binds to E. coli bacteria. Due to the pronounced susceptibility of fluorescence of DBD dyes to the polarity of the microenvironment, the binding event is “switching on” the fluorescence, whereas unbound dye molecules do not fluoresce. Furthermore, the probe has a very good photo-stability and it is suitable for the direct application – without further washing steps. Therefore it is very well qualified for the on-the-spot-analytics in the so-called mix-and-measure-process. By replacing the mannose building block by more complex carbohydrates the probe could be adapted to virtually any other kind of bacteria.
Notes and references
- (a) Topics in Fluorescence Spectroscopy. Vol. 3 Biochemical Applications, ed. J. R. Lakowicz, Kluwer, 2002 Search PubMed; (b) J. R. Lakowicz, Principles of Fluorescence Spectroscopy, Springer, 3rd edn, 2006 Search PubMed; (c) J. Liu, C. Liu and W. He, Curr. Org. Chem., 2013, 17, 564 CrossRef CAS.
- P. Wessig, R. Wawrzinek, K. Möllnitz, E. Feldbusch and U. Schilde, Tetrahedron Lett., 2011, 52, 6192 CrossRef CAS.
- R. Wawrzinek, P. Wessig, K. Möllnitz, J. Nikolaus, R. Schwarzer, P. Müller and A. Herrmann, Bioorg. Med. Chem. Lett., 2012, 5367 CrossRef CAS PubMed.
- R. Wawrzinek, J. Ziomkowska, J. Heuveling, M. Mertens, A. Herrmann, E. Schneider and P. Wessig, Chem.–Eur. J., 2013, 19, 17349 CrossRef CAS PubMed.
- J. Heuveling, V. Frochaux, J. Ziomkowska, R. Wawrzinek, P. Wessig, A. Herrmann and E. Schneider, Biochim. Biophys. Acta, Biomembr., 2014, 1838, 106 CrossRef CAS PubMed.
- C. Meyners, R. Wawrzinek, A. Krämer, S. Hinz, P. Wessig and F.-J. Meyer-Almes, Anal. Bioanal. Chem., 2014, 4889 CrossRef CAS PubMed.
- R. Wawrzinek and P. Wessig, Dyes Pigm., 2015, 123, 39 CrossRef CAS.
- A. Robinson, J.-M. Fang, P.-T. Chou, K.-W. Liao, R.-M. Chu and S.-J. Lee, ChemBioChem, 2005, 6, 1899 CrossRef CAS PubMed.
- J. Coulon, I. Thouvenin, F. Aldeek, L. Balan and R. Schneider, J. Fluoresc., 2010, 20, 591 CrossRef CAS PubMed.
- S. Kuchler, M.-N. Graff, S. Gobaille, G. Vincendon, A.-C. Roche, J.-P. Delaunoy, M. Monsigny and J.-P. Zanetta, Neurochem. Int., 1994, 24, 43 CrossRef CAS PubMed.
- Y.-b. Lim, S. Park, E. Lee, J.-H. Ryu, Y.-R. Yoon, T.-H. Kim and M. Lee, Chem.–Asian J., 2007, 2, 1363 CrossRef CAS PubMed.
- D. L. Sackett and J. Wolff, Anal. Biochem., 1987, 167, 228 CrossRef CAS PubMed.
- M. Izumi, K. Fukase and S. Kusumoto, Biosci., Biotechnol., Biochem., 2001, 66, 211 CrossRef PubMed.
- (a) R. Huisgen, Angew. Chem., 1963, 75, 604 CrossRef CAS; (b) H. C. Kolb, M. G. Finn and K. B. Sharpless, Angew. Chem., Int. Ed., 2001, 40, 2004 CrossRef CAS; (c) F. Fazio, M. C. Bryan, O. Blixt, J. C. Paulson and C.-H. Wong, J. Am. Chem. Soc., 2002, 124, 14397 CrossRef CAS PubMed; (d) S. Bräse, C. Gil, K. Knepper and V. Zimmermann, Angew. Chem., 2005, 117, 5320 CrossRef; (e) V. D. Bock, H. Hiemstra and J. H. van Maarseveen, Eur. J. Org. Chem., 2006, 51 CrossRef CAS; (f) J. Lahann, Click Chemistry for Biotechnology and Materials Science, Wiley-VCH, Weinheim, 2009 Search PubMed.
- G. Patterson, R. N. Day and D. Piston, J. Cell Sci., 2001, 114, 837 CAS.
- D. R. Coghlan, J. A. Mackintosh and P. Karuso, Org. Lett., 2005, 7, 2401 CrossRef CAS PubMed.
- J. A. Mackintosh, D. A. Veal and P. Karuso, Proteomics, 2005, 5, 4673 CrossRef CAS PubMed.
- D. S. Schabacker, I. Stefanovska, I. Gavin, C. Pedrak and D. P. Chandler, Anal. Biochem., 2006, 359, 84 CrossRef CAS PubMed.
- V. L. Singer, T. E. Lawlor and S. Yue, Mutat. Res., Genet. Toxicol. Environ. Mutagen., 1999, 439, 37 CrossRef CAS.
- I. M. Mackay, Nucleic Acids Res., 2002, 30, 1292 CrossRef CAS PubMed.
- H. Zipper, Nucleic Acids Res., 2004, 32, e103 CrossRef PubMed.
Footnote |
| † Electronic supplementary information (ESI) available: Synthetic procedures and compound characterisation. See DOI: 10.1039/c5ay02991k |
| This journal is © The Royal Society of Chemistry 2016 |

