 Open Access Article
Creative Commons Attribution 3.0 Unported Licence
Infrared spectroscopy via substrate-integrated hollow waveguides: a powerful tool in catalysis research
V.
Kokoric
a,
D.
Widmann
b,
M.
Wittmann
b,
R. J.
Behm
b and
B.
Mizaikoff
*a
aInstitute of Analytical and Bioanalytical Chemistry, Ulm University, 89081 Ulm, Germany. E-mail: boris.mizaikoff@uni-ulm.de
bInstitute of Surface Chemistry and Catalysis, Ulm University, 89069 Ulm, Germany
First published on 7th September 2016
Abstract
Substrate-integrated hollow waveguides (iHWG) represent an innovative generation of photon conduits, which can simultaneously serve as highly miniaturized gas cells with low sample volume. In this communication, we introduce a novel concept for analyzing the performance of catalysts via infrared gas phase analysis based on iHWGs. Due to rapid gas exchange and sample transient times within the iHWG, compositional changes of a continuous gas stream after interaction with a catalyst assembly can be monitored with high time resolution.
Introduction
A rapid and reliable quantification of the gas phase composition allowing also for monitoring dynamic changes therein is of substantial interest in modern catalysis research, in particular for kinetic and mechanistic studies on heterogeneously catalyzed gas phase reactions. For example, in gas purification and exhaust gas after-treatment it is mandatory to precisely quantify low concentrations of reaction products and educts that, e.g., have not been converted at concentration levels of several tenths or hundreds of ppm (v/v). Likewise, rapid analysis is demanded for dynamically detecting changes in gas phase composition induced, e.g., by changes of the catalytic activity due to activation or deactivation or during transient experiments in general.Analyzing the transient composition of gas streams requires methods that simultaneously provide temporally and molecularly resolved information.1 Mass Spectrometry (MS) is a sufficiently fast analytical technique, however, usually requires vacuum operation and is of limited utility for dynamically differentiating small volatile molecules of similar mass-to-charge ratio (e.g., CO/N2 or CO2/N2O, etc.). Besides, fragmentation of molecular ions into smaller fragments via the ion source of the MS may occasionally complicate a quantitative analysis. Gas chromatography (GC), is a non-destructive and highly sensitive approach towards separating and detecting even small volatiles, however, inherently provides rather poor time resolution therefore limiting its utility for rapidly monitoring transient processes within catalytic conversion reactions.
In contrast, optical techniques including conventional infrared spectroscopy (IR), tunable diode laser spectroscopy (TDLS), laser induced breakdown spectroscopy (LIBS), quartz-enhanced photoacoustic spectroscopy (QEPAS), etc.) are non-destructive, fast, and enable the detection of several gaseous species.2,3 In particular, IR spectroscopic methods facilitate the simultaneous detection and quantification of several gaseous species. Moreover, the sensitivity of IR spectroscopic and sensing techniques may be tailored via the absorption path length, e.g., using a multi-pass gas cell.
However, conventional multi-pass gas cell assemblies (e.g., the White cell or Herriott cell) are comparatively bulky and require sizeable sample volumes, up to few tenths or hundreds of millilitres, which consequently limits the achievable temporal resolution during transient studies.4–6
As an innovative strategy, an analytical technology has recently emerged, enabling a time resolution of few seconds while efficiently probing only minute sample volumes, i.e., few hundreds of microliters, with molecular selectivity: infrared spectroscopy/sensing based on so-called substrate-integrated hollow waveguides (iHWGs). iHWGs are an attractive alternative to conventional multi-pass gas cells, not only offering an efficient photon conduit and minute sample volumes, but also a small device footprint (i.e., few square centimeters), and correspondingly, a low thermal mass.7 iHWGs are therefore considered next-generation light pipe structures, simultaneously serving as a waveguide and as a highly miniaturized and robust gas cell.7,8 While iHWGs maintain a small device footprint (e.g., the device used herein measures 75 × 25 mm), significantly longer absorption path lengths (i.e., several tens of centimeters) may be achieved by meandering the channel structure.7,9,10 While iHWGS certainly cannot outcompete multi-pass gas cells in terms of their sensitivity, owing to folded beam path lengths up to several tenths or hundreds of meters, the major advantages are the exceptionally fast detection of multiple volatiles at low ppm concentration levels, rapid sample transient times, and robustness at extreme application conditions (e.g., elevated temperature, high pressure, corrosive constituents, etc.).
Pioneered by Mizaikoff and collaborators, the utility of iHWG has to date been demonstrated for environmentally and industrially relevant gases (e.g., H2S, O3, SO2, CH4, etc.),9,11,12 and (bio)medical relevant analytes (e.g., isoprene, 12CO2/13CO2 ratio, etc.).13,14 In comparison to conventional leaky-mode fiberoptic HWGs, iHWGs are a competitive technology in terms of sensitivity (e.g., for CO and CO2).14,15 Conventional HWG devices usually rely on tubes drawn from glass, silica or sapphire, and must be mechanically supported along their physical length. The main advantages of the iHWGs therefore include significantly increased mechanical robustness, compact dimensions, and cost-effectiveness during production.
In this present study, the feasibility of using iHWG-based IR sensing techniques for characterizing the performance of catalysts, and for monitoring catalytic conversion processes is demonstrated for the first time. Specifically, the efficiency of CO oxidation, catalyzed via supported gold catalysts (i.e., Au/TiO2) has been continuously monitored with time in order to determine the catalyst activity and has been validated against conventional gas chromatography. Such Au catalysts are claimed to be promising candidates for the selective removal of CO from H2-rich reformates to values below 10 ppm via preferential CO oxidation, which is required for usage as feed gas in low temperature fuel cells.16 In order to further optimize these systems – and to determine optimum application conditions – detailed information on the reaction kinetics and the reaction mechanisms are needed. Therefore, it is essential to elucidate their conversion efficiency in molecular detail and with sufficient temporal resolution.
Experimental
Experimental setup
Fig. 1 schematically illustrates the experimental setup comprising a gas mixing unit, a tubular quartz glass micro-reactor located inside a temperature-controlled oven (Micro Reactor), gas chromatograph (DANI GC 86.01, DANI Instruments S.p.A., Cologno Monzese, Italy), and the IR-iHWG analyzer combining a shoe-box sized Bruker Alpha FTIR spectrometer (Bruker Optics Inc., Ettlingen, Germany) with a customized iHWG developed at IABC (details see Fig. 2). The sample compartment of the spectrometer containing the iHWG was continuously purged with pure N2 in order to ensure an interference-free and constant background signal within the IR beam path outside the iHWG. Carrier gas flows (N2, He) and reaction gas mixtures (CO, O2 in N2) were prepared at varying concentrations and flow rates using a gas mixing unit based on mass flow controllers (Hasting Instruments, Hampton, USA). Gas mixtures prepared this way were passed through a fixed catalyst bed located in a tubular quartz-glass micro reactor, and then analysed via the GC system and the IR-iHWG analyzer.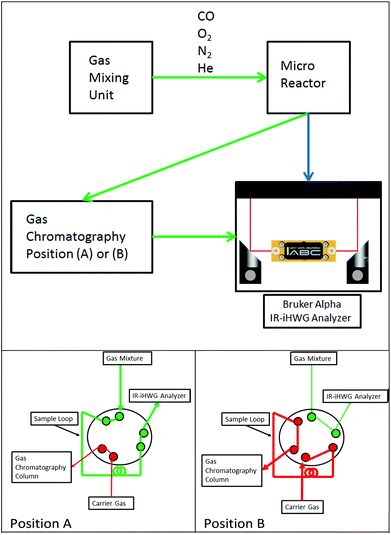 | ||
| Fig. 1 Top: Schematic of the experimental setup for monitoring catalytic conversion processes. Bottom: (A) Gas path during IR measurements, (B) gas path during GC column loading. | ||
Validation studies were executed via guiding gaseous samples into the sample loop of a GC equipped with a Thermal Conductivity Detector detector (TCD) (compare Fig. 1, position A). The chromatographic separation column was loaded by switching the valve position from A to B every 17 min, due to the retention time of the chromatographic column.
iHWGs: substrate integrated hollow waveguides
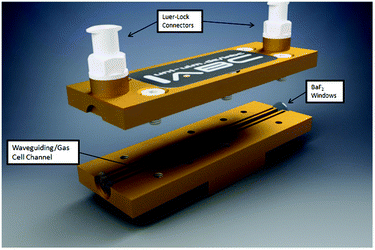
The enabling key component of the developed monitoring system is the iHWG, here, a device providing a 75 mm long straight channel. Fig. 2 provides a 3D CAD model of the iHWG used during the studies reported herein. The polished waveguiding/gas cell channel was integrated into a 75 × 25 mm brass alloy substrate, therefore providing an absorption path length of 75 mm. iHWGs are fabricated from two components, (i) a bottom substrate comprising all channel structures, and (ii) a cover substrate with a mirror-like polished surface finish.7 Both substrates are combined via six M4 screws and sealed with epoxy resin in order to ensure gas tightness. For maximizing IR reflectivity, both substrates were gold coated via galvanic methods. The presently used iHWG was designed for operation at room temperature (approx. 20 °C) and slight overpressure (i.e., flow rates up to 200 mL min−1). However, the device may readily be modified in terms of material, windows, sealing, and design for accommodating higher temperatures and pressures/flow rates.The waveguiding/gas cell channel has a cross-section of 4 mm2 and encloses a volume of 300 μL. Each end of the channel is sealed gas tight via two IR transparent windows (BaF2; thickness: 0.5 mm). To prevent contamination of the optical path with epoxy resin when sealing the iHWG substrate and lid, two overflow channels are integrated next to the waveguiding/gas cell channel accommodating redundant resin.
Gas samples are propagated through the iHWG via the top plate equipped with two M5 Luer-Lock adapters serving as gas in- and outlet ports.
The iHWG was optically coupled to the FTIR spectrometer using two off axis parabolic mirrors (OAPM) with a focal length of 1′′ (Fig. 3). The IR beam provided by the spectrometer was focused via the first OAPM into the iHWG. After propagating through the iHWG, IR radiation emanating at the distal end was collimated by the second OAPM and guided to the internal deuterated triglycine sulfate (DTGS) detector of the FTIR.
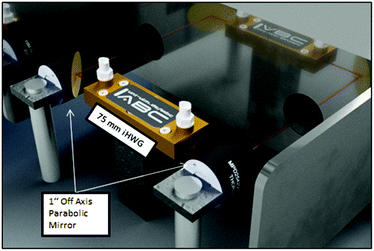 | ||
| Fig. 3 FTIR spectrometer optically coupled to the iHWG via two OAPMs. The red line schematically indicates the IR beam path. | ||
In the measurements reported below, the catalytic activity for CO oxidation on Au/TiO2 catalysts was investigated at a constant reaction temperature of 80 °C. For this purpose, the catalyst bed was provided within a tubular quartz glass micro-reactor (inner diameter: 4 mm) located inside a temperature-controlled oven.
The IR signatures of the analytes were evaluated by integration of the corresponding peak areas (i.e., CO, CO2) using the integration boundaries summarized in Table 1. All IR spectra were recorded in the spectral window of 4000 to 800 cm−1 at a spectral resolution of 2 cm−1, averaging 30 spectra per measurement resulting in a time resolution of approx. 60 s.
| Analyte | Left integration border [cm−1] | Right integration border [cm−1] |
|---|---|---|
| CO | 2144 | 2043 |
| CO2 | 2391 | 2282 |
Results
Characterization of the IR-iHWG analyzer
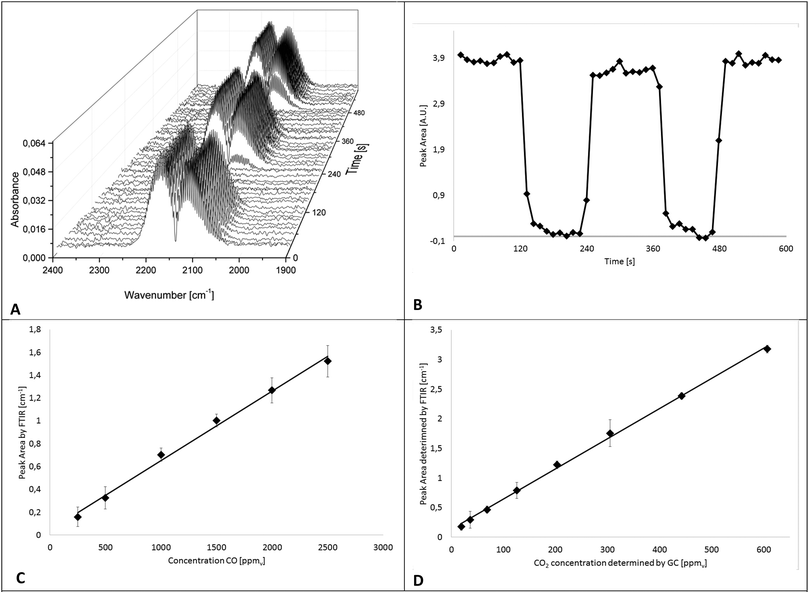
In a first series of experiments, the IR-iHWG analyzer was characterized and calibrated, and the period of time required for ensuring a complete gas exchange (i.e., gas linings, reactor, and iHWG) was determined in order to estimate the achievable time resolution at the present reaction conditions, i.e., at a flow rate of gases/gas mixtures of 60 N mL min−1. Hence, IR spectra were continuously measured while switching from a gas mixture containing 1% CO in He to pure He at 2 min intervals. For a more precise evaluation of the time for a complete gas exchange of the entire setup (i.e., gas linings, reactor, GC, and iHWG), the number of averaged spectra was reduced from 30 to 5, thereby resulting in a spectrum every 12 s. The dead volume of the setup was then determined from the time required to completely fill the iHWG with He, which occurs within 48 s. The IR spectra of the CO peak evolving during the gas exchange are illustrated in Fig. 4A as 3D waterfall diagram, whereas the temporal evolvement of the peak intensity is illustrated in Fig. 4B showing the integrated peak values vs. time.For the determination of the achievable limit of detection (LOD) towards CO, a calibration function was established comprising six different CO concentrations (250, 500, 1000, 1500, 2000, and 2500 ppmv) diluted in N2. The calibration gas mixtures were directly forwarded to the iHWG, i.e., bypassing the GC sample loop (see blue path in Fig. 1). For each concentration value, the mean integrated peak value of three replicate measurements was calculated. Fig. 4C shows distinct linearity for the investigated range. In addition, 30 blanks were measured to estimate the limit of detection (LOD), which is considered 3-times the standard deviation of the blank signal, and was determined at 94 ppmv. The limit of quantification (LOQ) is considered 10-times the standard deviation of the blank signal, and was determined at 311 ppmv.
Furthermore, to establish a CO2 calibration curve, a reaction gas mixture containing 1% CO and 1% O2 in nitrogen was passed through the catalyzed bed at various temperatures in order to realize different CO conversion rates and, thus, different CO2 concentrations. Effluent gases, i.e., generated CO2 as well as CO and O2 that have not reacted, were fed to GC and FTIR analyzers (compare Fig. 1) after reaching a constant reaction/CO2 formation rate at each temperature. In particular, the gas sample was introduced to the GC sample loop (described above). Simultaneously, IR spectra were recorded continuously. Hence, the absorption of CO2 measured with the iHWG can be directly correlated to the absolute amount of CO2 determined by GC. This procedure was applied at eight different reaction temperatures between 60 °C and 200 °C, and accordingly, with eight different CO2 concentrations between 20 and 600 ppmv. The calibration function for the obtained CO2 data is illustrated in Fig. 4D. Thus, the LOD was calculated at 13 ppmv, and the LOQ at 44 ppmv. It should be noted, that the y-intercept of the linear regression functions for CO and CO2 in the investigated concentration range (250–2500 ppm (v/v) and 20–600 ppm (v/v), respectively) is not zero, which is attributed to the noise of the baseline during peak integration.
The error bars represent the standard deviation (σ) of the mean of the replicated measurements calculated for each concentration during the calibration procedure for CO and CO2. It should be noted that the error bars in Fig. 4C and D are displayed with ±5 and ±10σ, respectively. Statistical variations in the experiments may be attributed to several factors including the tolerances of the mass flow controllers.
Table 2 summarizes the collected results (LOD, LOQ, correlation coefficient and the regression equation) for CO and CO2.
| Parameter | CO | CO2 |
|---|---|---|
| LOD [ppmv] | 94 | 13 |
| LOQ [ppmv] | 311 | 44 |
| Correlation coefficient (R2) | 0.994 | 0.998 |
| Regression equation | 6.09 × 10⁻⁴x + 4.31 × 10⁻² | 5.1 × 10⁻³x + 1.3 × 10⁻¹ |
Monitoring of CO oxidation at an Au/TiO2 catalyst
As a real-world catalyst characterization study, dynamic measurements of the CO oxidation at an Au/TiO2 powder catalyst (STREM Chemicals, Inc., Kehl, Germany; Au loading 1 wt%, mean Au particle diameter: 2.7 ± 0.7 nm) were performed. After in situ calcination of the catalyst at 400 °C in 10% O2/N2 for 30 min, the catalyst bed was cooled down to the reaction temperature of 80 °C in a flow of pure He prior to introducing the reaction gas into the reactor containing the fixed catalyst bed (1% CO, 1% O2, balance: He; total flow rate: 60 N mL min−1). For validation of the IR-iHWG analysis, simultaneous GC measurements were executed determining the concentration of gaseous species exiting the quartz glass micro-reactor, with particular focus on emerging CO2 and non-converted CO. In order to ensure that both analytical methods are applied to the same sample, the gas stream after the reactor was directed through the sample loop of the GC, and then continuously passed on through the iHWG. For GC analysis, the first sample was collected 10 min after switching to the reaction gas mixture. Further measurements were executed every 17 min due to restrictions by the retention time of the gaseous species within the chromatographic separation column. In contrast, the time resolution of the IR-iHWG analyzer facilitated measurements every 60 s.Based on the CO conversion and the formation of the reaction product (i.e., CO2) (eqn (1)), the Au mass normalized reaction rate for the CO oxidation was determined as given in eqn (2) (RAu).
 | (1) |
 | (2) |
The time dependent evolution of the activity is illustrated in Fig. 5. Calculating the reaction rates from the GC data, a maximum rate of 6.1 × 10⁻³ mol gAu−1 s−1 was observed in the first measurement recorded 10 min after switching to the reaction gas. During the initial 200 min, the reaction rate decreased strongly as a result of catalyst deactivation at the given reaction conditions. From 200 to 800 min, the reaction rate gradually decreases, until reaching steady-state conditions at a reaction rate of 3.8 × 10⁻³ mol gAu−1 s−1 after approx. 800 min.
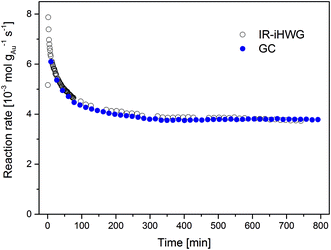 | ||
| Fig. 5 Au mass normalized reaction rates of the CO oxidation on Au/TiO2 at 80 °C observed via synchronous discontinuous GC and on-line continuous IR-iHWG analysis. | ||
This deactivation behaviour of Au/TiO2 catalysts during continuous CO oxidation is well known, and is ascribed to the formation of reaction-inhibiting side adsorbed products, i.e., most likely surface carbonates, which cover the catalyst surface.17 Relative to the highest observed reaction rate (determined after 10 min), the catalyst lost approx. 38% of its initial activity when reaching steady-state conditions at 80 °C, which resembles previously published values.17,18 Clearly, deriving such data from GC measurements provides limited temporal resolution and in particular does not resolve the behaviour of the catalyst in the beginning of the CO oxidation reaction (t < 10 min). Hence, analyzing the gas phase composition at a higher time resolution (here, 1 min using the IR-iHWG analyzer) provides significantly more detailed insight into the catalyst behaviour. Deriving the reaction rates from the IR spectroscopic data obtained via the IR-iHWG analyzer, a maximum rate of 7.9 × 10⁻³ mol gAu−1 s−1 was observed 2 min after switching on the reaction gas, followed by a deactivation behaviour qualitatively similar to the GC measurements. Note that the rate calculated from the first spectrum (after 1 min) is somewhat lower (5.2 × 10⁻³ mol gAu−1 s−1), since it takes approx. 1 min to replace all N2 in the iHWG by the reaction gas mixture (see above). Hence, in that case some spectra were recorded even before the reaction gas mixture entered the iHWG, which results in the detection of a lower CO2 concentration and, hence, a lower calculated reaction rate. Moreover, Fig. 5 illustrates that the rate after 10 min of reaction time (6.3 × 10⁻³ mol gAu−1 s−1) and the rate after reaching the steady-state (3.7 × 10⁻³ mol gAu−1 s−1) are almost identical, when comparing the GC results and the IR-iHWG analyser data. This clearly demonstrates the feasibility and validates the analytical utility of the developed IR monitoring system for dynamic catalyst performance studies.
A distinct advantage of the IR method is the ability to study reaction rates early on during catalytic conversion processes with a high time resolution. Of course, one may have started the first GC measurement earlier, but it would have needed ten individual measurements to derive a comparable time resolution, and accordingly, exact knowledge after which time the reaction rate reached its maximum. From the IR data it is obvious that the highest reaction rate during CO oxidation is in fact significantly higher than that observed in the first GC measurement (i.e., 7.9 × 10⁻³ mol gAu−1 s−1 after 2 min compared to 6.1 × 10⁻³ mol gAu−1 s−1 after 10 min). Considering that catalyst deactivation is given by the (relative) loss of activity from the initial period of the reaction to the activity at steady-state conditions, the initial rate – which in this case is also the highest rate measured – serves as reference point. Thus, this has a profound influence on the extent of the deactivation, both on a relative and on an absolute scale. Based on the comparison between the initial and final reaction rate determined via the IR-iHWG analyzer (i.e., 7.9 × 10⁻³ mol gAu−1 s−1 after 2 min and 3.7 × 10⁻³ mol gAu−1 s−1 after 800 min, respectively) the deactivation amounts 53%, while based on the GC measurements it apparently reaches only 37%. Hence, a strong deactivation of the Au/TiO2 catalyst for CO oxidation during the first ten minutes of reaction was missed during the conventionally applied GC studies.
This example clearly demonstrates the importance of a sufficiently high time resolution during such measurements, and in particular during the initial period of the reaction when the rate of deactivation is the highest.19
Conclusions
An innovative sensing approach based on an IR-spectroscopic analyzer system utilizing substrate-integrated hollow waveguides was developed. The IR-iHWG analyzer is ideally suited for monitoring the activity and associated changes of the reaction rate during catalytic gas phase conversion processes via the analysis of compositional change of gas phase samples in molecular detail at a time resolution of less than 60 s. Note that this value is limited by the time needed for a complete gas exchange at the present reaction conditions, and not by the IR-iHWG analyzer, which accordingly would allow for even higher time resolution. Validation via gas chromatographic techniques confirmed the analytical utility of this diagnostic system, which uniquely enables studying the catalyst activity during the first few minutes of operation. It is anticipated that further improvements in time resolution will be facilitated by using advanced infrared light sources coupled to iHWGs including quantum cascade lasers (QCLs)20 and interband cascade lasers (ICLs).12,21 In summary, it is apparent that IR-iHWG analyzers provide unique capabilities for studying transient gas phase reactions during catalytic conversion processes at reasonably short time scales, and should thus find broad application in heterogeneous catalysis research.Acknowledgements
Partial support of this study by the project APOSEMA funded by the German BMBF within the M-Era.net program is greatly acknowledged. The Machine Shop at Ulm University is thanked for support during prototype development of the iHWG. This work was performed in part under the auspices of the U.S. Department of Energy by Lawrence Livermore National Laboratory (LLNL) under Contract DE-AC52-07NA27344. This project was funded in part under LLNL sub-contract no. B603018 and B607114. This work was also supported by the Austrian Science Fund (FWF) via project Next-Lite (F49-P09).Notes and references
- H. Kobayashi and M. Kobayashi, Catal. Rev., 1974, 10, 139–176 CAS.
- J. Hodgkinson and R. P. Tatam, Meas. Sci. Technol., 2013, 24, 012004 CrossRef.
- V. Sturm and R. Noll, Appl. Opt., 2003, 42, 6221 CrossRef CAS PubMed.
- P. C. Castillo, I. Sydoryk, B. Gross and F. Moshary, in SPIE Defense, Security, and Sensing, ed. T. Vo-Dinh, R. A. Lieberman and G. G. Gauglitz, International Society for Optics and Photonics, 2013, p. 87180J Search PubMed.
- D. W. T. Griffith, R. Leuning, O. T. Denmead and I. M. Jamie, Atmos. Environ., 2002, 36, 1833–1842 CrossRef CAS.
- M. B. Esler, D. W. Griffith, S. R. Wilson and L. P. Steele, Anal. Chem., 2000, 72, 206–215 CrossRef CAS PubMed.
- A. Wilk, J. C. Carter, M. Chrisp, A. M. Manuel, P. Mirkarimi, J. B. Alameda and B. Mizaikoff, Anal. Chem., 2013, 85, 11205–11210 CrossRef CAS PubMed.
- J. C. Carter, M. P. Chrisp, A. M. Manuel, B. Mizaikoff, A. Wilk and S.-S. Kim, U.S. Patent Application No. 13/631936, 2012 Search PubMed.
- J. da S. Petruci, P. Fortes and V. Kokoric, Sci. Rep., 2013, 3, 3174 Search PubMed.
- J. F. D. S. Petruci, P. R. Fortes, V. Kokoric, A. Wilk, I. M. Raimundo, A. A. Cardoso and B. Mizaikoff, Analyst, 2014, 139, 198–203 RSC.
- J. F. D. S. Petruci, A. Wilk, A. A. Cardoso and B. Mizaikoff, Anal. Chem., 2015, 87, 9605–9611 CrossRef CAS PubMed.
- I. José Gomes da Silva, E. Tütüncü, M. Nägele, P. Fuchs, M. Fischer, I. M. Raimundo and B. Mizaikoff, Analyst, 2016, 141, 4432–4437 RSC.
- V. Kokoric, A. Wilk and B. Mizaikoff, Anal. Methods, 2015, 7, 3664–3667 RSC.
- F. Seichter, A. Wilk, K. Wörle, S.-S. Kim, J. a Vogt, U. Wachter, P. Radermacher and B. Mizaikoff, Anal. Bioanal. Chem., 2013, 405, 4945–4951 CrossRef CAS PubMed.
- B. T. Thompson, A. Inberg, N. Croitoru and B. Mizaikoff, Appl. Spectrosc., 2006, 60, 266–271 CrossRef CAS PubMed.
- C. W. Corti, R. J. Holliday and D. T. Thompson, Top. Catal., 2007, 44, 331–343 CrossRef CAS.
- B. Schumacher, V. Plzak, M. Kinne and R. J. Behm, Catal. Lett., 2003, 89, 109–114 CrossRef CAS.
- Y. Denkwitz, B. Schumacher, G. Kučerová and R. J. Behm, J. Catal., 2009, 267, 78–88 CrossRef CAS.
- J. Moulijn, A. van Diepen and F. Kapteijn, Appl. Catal., A, 2001, 212, 3–16 CrossRef CAS.
- K. Wörle, F. Seichter, A. Wilk, C. Armacost, T. Day, M. Godejohann, U. Wachter, J. Vogt, P. Radermacher and B. Mizaikoff, Anal. Chem., 2013, 85, 2697–2702 CrossRef PubMed.
- E. Tütüncü, M. Nägele, P. Fuchs, M. Fischer and B. Mizaikoff, ACS Sens., 2016, 1, 847–851 CrossRef.
| This journal is © The Royal Society of Chemistry 2016 |

