 Open Access Article
Creative Commons Attribution 3.0 Unported Licence
A competitive immunoassay system for microfluidic paper-based analytical detection of small size molecules†
Lori Shayne Alamo
Busa
ab,
Saeed
Mohammadi
a,
Masatoshi
Maeki
c,
Akihiko
Ishida
c,
Hirofumi
Tani
c and
Manabu
Tokeshi
*cdef
aGraduate School of Chemical Sciences and Engineering, Hokkaido University, Kita 13 Nishi 8, Kita-ku, Sapporo 060-8628, Japan
bNatural Sciences Department, Nueva Vizcaya State University, Bayombong, Nueva Vizcaya 3700, Philippines
cDivision of Applied Chemistry, Faculty of Engineering, Hokkaido University, Kita 13 Nishi 8, Kita-ku, Sapporo 060-8628, Japan. E-mail: tokeshi@eng.hokudai.ac.jp; Tel: +81-11-706-6744
dImPACT Research Centre for Advanced Nanobiodevices, Nagoya University, Furo-cho Chikusa-ku, Nagoya 464-8603, Japan
eInnovative Research Center for Preventive Medical Engineering, Nagoya University, Furo-cho Chikusa-ku, Nagoya 464-8603, Japan
fInstitute of Innovation for Future Society, Nagoya University, Furo-cho, Chikusa-ku, Nagoya 464-8603, Japan
First published on 4th November 2016
Abstract
The development of a competitive immunoassay system for colorimetric detection on microfluidic paper-based analytical devices (μPADs) is reported. The μPADs were fabricated via photolithography to define hydrophilic flow channels and consisted of three main elements: the control and test zones, where target detection was performed, the sample introduction zone, and the competitive capture zone located between the sample introduction zone and the test zone. The chromogenic substrate 3,3′,5,5′-tetramethylbenzidine (TMB) was deposited at the control and test zones. μPAD surface modification was performed at the capture zone first via chitosan activation, then the BSA-conjugated target compound was immobilized. The sample solution consisting of the target compound, the peroxidase-conjugated antibody, and the hydrogen peroxide oxidizing agent was introduced into the device and competition occurred at the capture zone, allowing only the target-bound peroxidase-conjugated antibody to travel past the capture zone and into the test zone via capillary action. The developed competitive immunoassay system was successfully demonstrated on the μPAD detection of biotin as a model compound with a detection limit of 0.10 μg mL−1. The applicability of the proposed immunoassay system for point-of-need testing was further demonstrated using aflatoxin B1, a highly toxic foodborne substance, with a detection limit of 1.31 ng mL−1. The μPAD with the competitive immunoassay format showed promising results for practical applications in point-of-need testing involving small molecular weight targets in food and water safety and quality monitoring, environmental analysis, and clinical diagnostics.
Introduction
Studies involving the development of microfluidic paper-based analytical devices (μPADs) have become an area of growing interest specifically in the fields of clinical diagnostics, environmental monitoring, and food and nutrition safety. Since the pioneering work of Whitesides’ group in 2007 involving multiplexed diagnostic detection using a photoresist-patterned paper device,1 μPADs have emerged as a tool for rapid and easy-to-perform detection that requires small amounts of reagents with little to no external supporting equipment or power, making the μPADs suitable for point-of-need detection that may not even require trained personnel to perform the measurement.2–5 Using such μPADs for specific target detection, several methods have been incorporated including colorimetric,6–10 electrochemical,11–15 fluorescence,16–18 chemiluminescence,19–22 and electrochemiluminescence23 methods. Among these, colorimetric methods offer the simplest means to display detection results without the use of additional read-out devices since a simple production of color, or a change in color intensity as a result of the presence or absence of a target compound is easily obtained. Such colorimetric methods include immunoassays,24–26 which involve the recognition and binding of antibodies to specific molecules in what might be a complex mixture of molecules, providing high specificity for target detection. In most applications, proteins and other large biomolecules including bacteria are the targets for detection.27–30 In such cases, a sandwich immunoassay is highly applicable for detection, as in the works of Wang et al.31 and Ge et al.,32 wherein, sandwich ELISA detection systems on μPAD have been demonstrated for the clinical diagnosis of several tumor markers including α-fetoprotein, cancer antigen, and carcinoembryonic antigen (CEA). In food and water safety and quality monitoring, however, with the exception of foodborne and waterborne microorganisms, the targets usually involve small molecular weight compounds.33–37 With small sized targets, a competitive immunoassay format is more applicable.In our previous report,38 we demonstrated a simple colorimetric assay system of horseradish peroxidase (HRP) on μPADs. The color production reaction was based on the oxidation of the chromogen, 3,3′,5,5′-tetramethylbenzidine (TMB), by hydrogen peroxide, H2O2, in the presence of the HRP enzyme. In the present work, a similar assay system has been applied. Here, however, an antigen–antibody interaction is involved, the antigen being of a small molecular weight molecule; hence, a competitive immunoassay system using μPADs fabricated via photolithography is designed as the platform. Liu et al.39 demonstrated a laminated paper-based analytical device for the chemiluminescence immunoassay of cotinine (FW 176.2), a second-hand smoke biomarker. Their competitive immunoassay platform consisted of a detection zone, wherein antibodies were immobilized and the sample solution containing HRP-labelled cotinine and the target cotinine was introduced, and a reagent pad with luminol reagent was introduced for the μPAD chemiluminescence detection via the HRP-catalyzed oxidation of luminol. The reported format, however, has the disadvantage of requiring an additional washing step after introducing the sample solution to the μPAD, which might possibly cause some loss of the target compound before detection and quantification. Hence, a further reconfiguration of the competitive immunoassay system on the μPAD is necessary.
Here, we report the development of a competitive immunoassay system for the μPAD detection of small sized target molecules. The μPADs consist of control and test zones, where the TMB chromogen is deposited, a competitive capture zone, where the capture reagent is immobilized, and a sample zone, where the sample solution is introduced into the device. We successfully demonstrated good performance of the competitive immunoassay system using biotin as a model compound and aflatoxin B1 as a target compound for practical application of the system on μPADs. To the best of our knowledge, this is the first demonstration of such a type of competitive immunoassay system on microfluidic paper-based devices.
Experimental
Reagents
All reagents were of analytical grade. 35.7 mM of 3,3′,5,5′-tetramethylbenzidine chromogen reagent (Dojindo Laboratories) was prepared with acetonitrile. 1× blocker bovine serum albumin in phosphate-buffered saline (BSA–PBS) (Thermo Fisher Scientific Inc.) was diluted with 1× phosphate-buffered saline Tween® 20 (PBST), pH 7.5 (Thermo Fisher Scientific Inc.), which was used as the washing solution during immunoassay. For the biotin immunoassay, 200 μg mL−1 biotin stock solution (Sigma-Aldrich, Inc.) and 10 mg mL−1 biotin–BSA conjugate (Sigma-Aldrich, Inc.) were prepared by dissolving the solids separately in PBST. For the aflatoxin B1 (AFB1) immunoassay, 1 mg AFB1 powder (Sigma-Aldrich, Inc.) was dissolved in 1 mL acetonitrile, and 1 mg mL−1 AFB1–BSA conjugate (Sigma-Aldrich, Inc.) was dissolved in PBST.Fabrication of μPADs
The μPADs were fabricated by photolithography as described in our previous work,38 with a slight modification of the first reported method.1 The fabrication procedure includes the following steps: (1) soaking of Whatman™ filter paper grade 41 (GE Healthcare Life Sciences) or Ahlstrom grade 319 paper (Ahlstrom Corporation) in an SU-8 2010 photoresist (Microchem) for about 30 s; (2) spinning for 5 s at 500 rpm, then for 30 s at 2000 rpm to remove excess photoresist using a spin coater (Mikasa MS-A100); (3) prebaking for 5 min at 95 °C; (4) aligning under a photomask (designed using AutoCAD 2015 (Autodesk, Inc.), and then ordered from Unno Giken Co., Ltd for printing with a resolution of 12![[thin space (1/6-em)]](https://www.rsc.org/images/entities/char_2009.gif) 700 dpi) using a mask aligner (Mikasa M-1S) after cooling to room temperature for 30 s and before being exposed to UV radiation for 18 s; (5) post-baking for another 5 min at 95 °C; and (6) developing (SU-8 developer, Microchem) for 6 min, then washing 3 times with 2-propanol. The fabricated μPADs were dried with high-pressured air and then stored in a sealed plastic bag until use. The μPADs fabricated using the Whatman™ filter paper grade 41 were labelled as FP41 and those fabricated with Ahlstrom grade 319 paper were labelled as A319.
700 dpi) using a mask aligner (Mikasa M-1S) after cooling to room temperature for 30 s and before being exposed to UV radiation for 18 s; (5) post-baking for another 5 min at 95 °C; and (6) developing (SU-8 developer, Microchem) for 6 min, then washing 3 times with 2-propanol. The fabricated μPADs were dried with high-pressured air and then stored in a sealed plastic bag until use. The μPADs fabricated using the Whatman™ filter paper grade 41 were labelled as FP41 and those fabricated with Ahlstrom grade 319 paper were labelled as A319.
Preparation of μPADs for competitive immunoassay
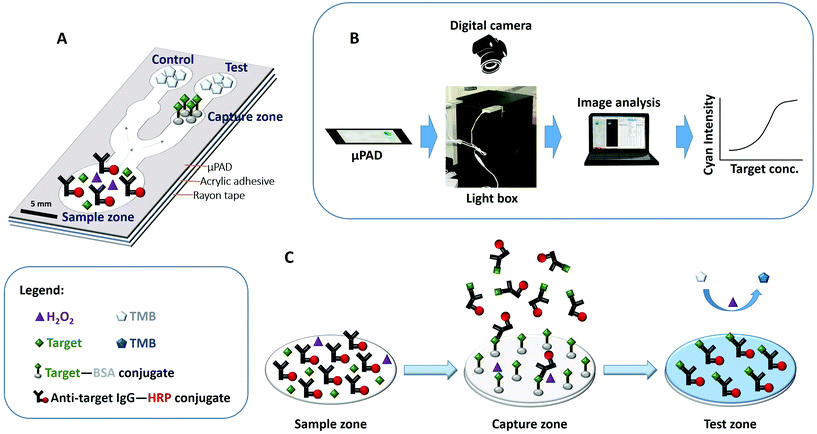
Before the immunoassay, one side of the fabricated μPADs was bonded to acrylic double adhesive tape without removing the rayon of the other side of the tape to limit the reagents to the hydrophilic regions and to avoid leakage (Fig. 1A). The capture zone was then chitosan-activated as described previously28 before immobilizing the capture reagents. In brief, 0.25 mg mL−1 of chitosan (Wako Pure Chemical Industries Ltd) solution was prepared by dissolving the flakes in hot (80–90 °C) aqueous solution of 0.05 M HCl, and then adjusting the pH to 3.5–5.0 with sodium hydroxide solution after cooling to room temperature. 0.6 μL of the chitosan solution was added to the capture zone and allowed to dry for at least 5 min. Then, chitosan was activated by adding 0.6 μL of 2.5% glutaraldehyde in PBST and incubated for 1 h at room temperature. After incubation, the capture zone with glutaraldehyde-activated chitosan was washed three times with PBST, and then sequentially wiped by simply pressing a cellulose absorbent sheet on top of the μPADs with the washing solution before allowing it to dry for at least 5 min. For the biotin immunoassay, a total of 6.0 μL of 10 mg mL−1 of the biotin–BSA conjugate was added 10 times (0.6 μL volume each time) onto the capture zone for immobilization. For the AFB1 immunoassay, a total of 10 μL of 1.0 mg mL−1 capture AFB1–BSA was added 10 times (1 μL volume each time) onto the capture zone for immobilization. After incubation for 20 min, the capture zone was similarly washed three times with PBST and then sequentially wiped. Then, 1.4 μL of 35.7 mM TMB solution (50 nmol TMB) was added onto the test and control zones of the μPADs and they were allowed to air-dry for at least 2 min before being blocked with 100 μL of BSA–PBS solution for 20 min. After blocking, the μPADs were washed three times with PBST washing solution (75 μL each time), sequentially wiped with the cellulose absorbent sheet, and then allowed to air-dry at room temperature. In real-world point-of-need applications, reagent immobilization on the respective μPAD zones should be completed during device manufacture. An acceptable shelf life of antibodies and reagents on a paper device has been proven possible in commercially available pregnancy and drug test strips. Then, the only step necessary in the field should be the application of the sample in the liquid form to the sample introduction zone, allowing the reconstitution of other immunoassay reagents.40![[thin space (1/6-em)]](https://www.rsc.org/images/entities/char_2009.gif) :
:![[thin space (1/6-em)]](https://www.rsc.org/images/entities/char_2009.gif) 500 dilution (1.6 μg mL−1) of anti-biotin IgG-peroxidase (Sigma-Aldrich, Inc.), and 0.001% (v/v) hydrogen peroxide solution. 50 μL each of the biotin standard solutions were introduced separately on the μPADs for colorimetric detection. The images of the μPADs were captured using a digital camera (EOS Kiss X6i Canon), and then analyzed using ImageJ software.
500 dilution (1.6 μg mL−1) of anti-biotin IgG-peroxidase (Sigma-Aldrich, Inc.), and 0.001% (v/v) hydrogen peroxide solution. 50 μL each of the biotin standard solutions were introduced separately on the μPADs for colorimetric detection. The images of the μPADs were captured using a digital camera (EOS Kiss X6i Canon), and then analyzed using ImageJ software.
![[thin space (1/6-em)]](https://www.rsc.org/images/entities/char_2009.gif) :
:![[thin space (1/6-em)]](https://www.rsc.org/images/entities/char_2009.gif) 25
25![[thin space (1/6-em)]](https://www.rsc.org/images/entities/char_2009.gif) 000 dilution (0.163 pmol or 0.68 μg mL−1) of anti-AFB1 IgG-peroxidase, and 0.001% (v/v) hydrogen peroxide solution. 50 μL each of the AFB1 standard solutions were introduced separately on the μPADs for colorimetric detection. The images were captured using the digital camera and analyzed using ImageJ software.
000 dilution (0.163 pmol or 0.68 μg mL−1) of anti-AFB1 IgG-peroxidase, and 0.001% (v/v) hydrogen peroxide solution. 50 μL each of the AFB1 standard solutions were introduced separately on the μPADs for colorimetric detection. The images were captured using the digital camera and analyzed using ImageJ software.
Image analysis for colorimetric measurements
The blue color intensities produced during the competitive immunoassay were captured using the digital camera equipped with a standard 18–55 mm objective lens. For biotin measurements, the photos were taken using the ISO AUTO Close-up Mode with an exposure time of 1/100 s, an aperture of F/5, an ISO of 100, a focal distance of 42 mm, and color representation in standard RGB (sRGB). The μPADs were placed in a light box made of acrylic and painted black, with two LED lights positioned parallel to each other on top of the box (Fig. 1B). The light box had a cover with a hole that exactly fits the camera lens, where the camera was positioned above the μPAD during image acquisition. For the AFB1 measurements, the photos were taken using the ISO AUTO Close-up Mode with an exposure time of 1/60 s, an aperture of F/4.5, an ISO of 1250, a focal distance of 36 mm, and color representation in sRGB. The camera was hand-held and was positioned above the μPAD during image acquisition.The RAW file formats of the images were processed with Digital Photo Professional software (Canon) and stored as a 16-bit color TIF file (see Fig. S1 in the ESI†). The RGB file was then split to obtain the CMYK (cyan–magenta–yellow-key) profiles using ImageJ software. The cyan profile of each image was used and a circular region of interest (ROI) around each of the test and control zones of the μPAD was drawn for quantitative determinations. The histogram of each of these ROIs provided a mean cyan intensity value that was used for quantitative determinations and construction of calibration plots.
Results and discussion
Competitive immunoassay on μPAD
The μPAD detection system presented in this work demonstrates a competitive type of immunoassay. The μPAD has a sample introduction zone located on one end of it, and a control zone and a test zone that branch out from the sample introduction zone which are located on the other end. A capture zone is located between the test zone and the sample introduction zone where the competitive immunoassay takes place. Upon mixing of the components of the sample solutions, the peroxidase-conjugated antibody binds to the free antigen in the solution. As the sample solution is introduced into the sample zone, all the components flow via capillary action into the capture zone. Here, unbound peroxidase-conjugated antibodies are captured and they bind to the immobilized BSA-conjugated antigen. The previously antigen-bound peroxidase-conjugated antibodies however flow past the capture zone and reach the TMB-immobilized test zone as illustrated in Fig. 1C. A blue-colored TMB diimine product is then formed at the test zone for quantitative measurement. Hence, competition occurs at the capture zone. Prior to investigation, suitable proportion of the target antigen, the capture reagent, and the peroxidase-conjugated antibody was determined. The number of moles of the capture reagent is kept higher than the peroxidase-conjugated antibody so that even in the absence of any target antigen, which is at blank concentration, we assume that all the peroxidase-conjugated antibody will be captured at the capture zone, thereby hindering the formation of any blue-colored product at the test zone. Then, with increasing antigen concentration in the sample solution, more of the antigen-bound peroxidase-conjugated antibody component flows past the capture zone to the test zone which results in an increase in the intensity of the blue colored product. At the control zone however, all antigen-bound and free peroxidase-conjugated antibodies flow into the TMB-immobilized control zone, hence producing a constant blue color intensity. Quantification is then performed by measuring the relative intensity, IR, which is computed by simply dividing the test intensity, It, by the control intensity, Ic, as in the following equation:Data evaluation
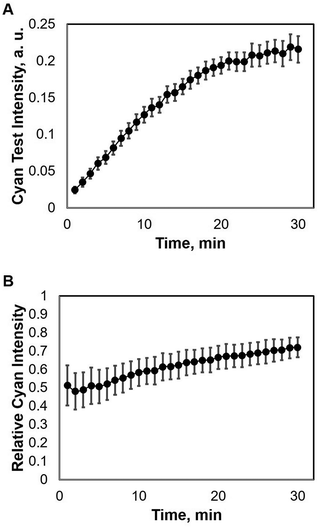
The competitive immunoassay system demonstrated a colorimetric detection of the target on a μPAD using the common enzymatically catalyzed TMB–H2O2 system. Upon enzymatic oxidation of TMB by hydrogen peroxide in the presence of peroxidase, a blue TMB diimine product is produced with water as a by-product. The blue intensity of the TMB diimine product depends on the amount of peroxidase that catalyzes the reaction of TMB and H2O2 as demonstrated in our previous work.38 The intensities were recorded using the digital camera, and then image-processed using Digital Photo Professional software and analyzed using ImageJ software.During image processing, the RGB images were first split to CMYK (cyan–magenta–yellow-key) profiles to determine which profile would best provide quantitative results (see Fig. S1†). Based on the different profiles, we found that the cyan profile provided the best quantitation for target measurement. Therefore, the TMB–H2O2 target detection at different concentrations, producing a varying immunoassay system was quantitatively measured using the cyan profiles of each μPAD.
Applications to specific target detection
Conclusions
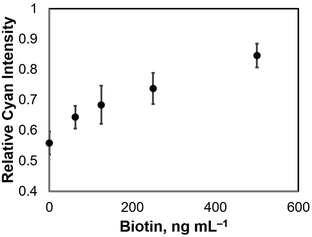
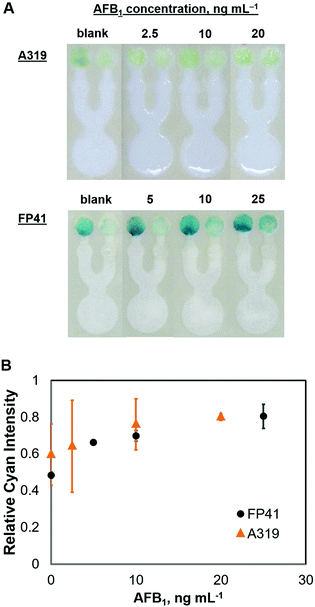
We have demonstrated a competitive immunoassay system on a microfluidic paper-based device. The μPAD consisted of three main elements: (1) test and control zones; (2) a sample introduction zone; and (3) a capture zone. Competition happens in the capture zone, where antigen-free peroxidase-conjugated antibodies are captured before reaching the test zone, allowing only the target-bound peroxidase-conjugated antibodies to travel into the test zone. The proposed competitive immunoassay system was demonstrated on μPADs with biotin as a model compound and with aflatoxin B1 for analytical testing as a practical application for food monitoring, with limits of 0.10 μg mL−1 for biotin and 1.31 ng mL−1 for AFB1, respectively. Although the same competitive immunoassay system for both targets was used, the difference in sensitivity was highly attributed to the different affinity of the antibodies used for biotin and AFB1 during the immunoassay. This simple competitive immunoassay system introduces the fundamental principle of competitive ELISA on microfluidic paper-based devices, and with this study, verified its promising applications for a broad range of analytical testing, not only in food monitoring, but also in environmental and clinical applications.Acknowledgements
This research was supported by the Urakami Foundation for Food and Food Culture Promotion.References
- A. W. Martinez, S. T. Phillips, M. J. Butte and G. M. Whitesides, Angew. Chem., Int. Ed., 2007, 46, 1318–1320 CrossRef CAS PubMed.
- L. S. A. Busa, S. Mohammadi, M. Maeki, A. Ishida, H. Tani and M. Tokeshi, Micromachines, 2016, 7, 86 CrossRef.
- J. A. Adkins and C. S. Henry, Anal. Chim. Acta, 2015, 891, 247–254 CrossRef CAS PubMed.
- X. Li, J. Tian, T. Nguyen and W. Shen, Anal. Chem., 2008, 80, 9131–9134 CrossRef CAS PubMed.
- S. Mohammadi, M. Maeki, R. M. Mohamadi, A. Ishida, H. Tani and M. Tokeshi, Analyst, 2015, 140, 6493–6499 RSC.
- J. C. Jokerst, J. A. Adkins, B. Bisha, M. M. Mentele, L. D. Goodridge and C. S. Henry, Anal. Chem., 2012, 84, 2900–2907 CrossRef CAS PubMed.
- C. Sicard, C. Glen, B. Aubie, D. Wallace, S. Jahanshahi-Anbuhi, K. Pennings, G. T. Daigger, R. Pelton, J. D. Brennan and C. D. M. Filipe, Water Res., 2015, 70, 360–369 CrossRef CAS PubMed.
- T. M. G. Cardoso, P. T. Garcia and W. K. T. Coltro, Anal. Methods, 2015, 7, 7311–7317 RSC.
- S. M. Z. Hossain and J. D. Brennan, Anal. Chem., 2011, 83, 8772–8778 CrossRef CAS PubMed.
- N. M. Myers, E. N. Kernisan and M. Lieberman, Anal. Chem., 2015, 87, 3764–3770 CrossRef CAS PubMed.
- J. A. Adkins and C. S. Henry, Anal. Chim. Acta, 2015, 891, 247–254 CrossRef CAS PubMed.
- J. Shi, F. Tang, H. Xing, H. Zheng, B. Lianhua and W. Wei, J. Braz. Chem. Soc., 2012, 23, 1124–1130 CrossRef CAS.
- M. Cuartero, G. A. Crespo and E. Bakker, Anal. Chem., 2015, 87, 1981–1990 CrossRef CAS PubMed.
- S. Ge, W. Liu, L. Ge, M. Yan, J. Yan, J. Huang and J. Yu, Biosens. Bioelectron., 2013, 49, 111–117 CrossRef CAS PubMed.
- Z. Nie, F. Deiss, X. Liu, O. Akbulut and G. M. Whitesides, Lab Chip, 2010, 10, 3163–3169 RSC.
- P. Zuo, X. Li, D. C. Dominguez and B.-C. Ye, Lab Chip, 2013, 13, 3921–3928 RSC.
- Y. Su, S. Ma, K. Jiang and X. Han, Chin. J. Chem., 2015, 33, 446–450 CrossRef CAS.
- Y. Zhang, P. Zuo and B.-C. Ye, Biosens. Bioelectron., 2015, 68, 14–19 CrossRef CAS PubMed.
- S. Wang, L. Ge, L. Li, M. Yan, S. Ge and J. Yu, Biosens. Bioelectron., 2013, 50, 262–268 CrossRef CAS PubMed.
- S.-Q. Jin, S.-M. Guo, P. Zuo and B.-C. Ye, Biosens. Bioelectron., 2014, 63, 379–383 CrossRef PubMed.
- W. Liu, J. Kou, H. Xing and B. Li, Biosens. Bioelectron., 2014, 52, 76–81 CrossRef CAS PubMed.
- W. Liu, Y. Guo, J. Luo, J. Kou, H. Zheng, B. Li and Z. Zhang, Spectrochim. Acta, Part A, 2015, 141, 51–57 CrossRef CAS PubMed.
- V. Mani, K. Kadimisetty, S. Malla, A. A. Joshi and J. F. Rusling, Environ. Sci. Technol., 2013, 47, 1937–1944 CrossRef CAS PubMed.
- Y. Kasahara and Y. Ashihara, Clin. Chim. Acta, 1997, 267, 87–102 CrossRef CAS.
- G. A. Posthuma-Trumpie, J. Korf and A. van Amerongen, Anal. Bioanal. Chem., 2009, 393, 569–582 CrossRef CAS PubMed.
- S. Rattle, O. Hofmann, C. P. Price and L. J. Kricka, The Immunoassay Handbook, Elsevier, 2013 Search PubMed.
- S. Wang, L. Ge, X. Song, M. Yan, S. Ge, J. Yu and F. Zeng, Analyst, 2012, 137, 3821–3827 RSC.
- D. Zang, L. Ge, M. Yan, X. Song and J. Yu, Chem. Commun., 2012, 48, 4683–4685 RSC.
- L. Zhang, L. Li, C. Ma, S. Ge, M. Yan and C. Bian, Sens. Actuators, B, 2015, 221, 799–806 CrossRef CAS.
- S. Ma, Y. Tang, J. Liu and J. Wu, Talanta, 2014, 120, 135–140 CrossRef CAS PubMed.
- S. Wang, L. Ge, X. Song, J. Yu, S. Ge, J. Huang and F. Zeng, Biosens. Bioelectron., 2012, 31, 212–218 CrossRef CAS PubMed.
- L. Ge, S. Wang, X. Song, S. Ge and J. Yu, Lab Chip, 2012, 12, 3150–3158 RSC.
- S. Wang, L. Ge, L. Li, M. Yan, S. Ge and J. Yu, Biosens. Bioelectron., 2013, 50, 262–268 CrossRef CAS PubMed.
- J. Shi, F. Tang, H. Xing, H. Zheng, B. Lianhua and W. Wei, J. Braz. Chem. Soc., 2012, 23, 1124–1130 CrossRef CAS.
- T. M. G. Cardoso, P. T. Garcia and W. K. T. Coltro, Anal. Methods, 2015, 7, 7311–7317 RSC.
- M. Cuartero, G. A. Crespo and E. Bakker, Anal. Chem., 2015, 87, 1981–1990 CrossRef CAS PubMed.
- N. M. Myers, E. N. Kernisan and M. Lieberman, Anal. Chem., 2015, 87, 3764–3770 CrossRef CAS PubMed.
- L. S. A. Busa, M. Maeki, A. Ishida, H. Tani and M. Tokeshi, Sens. Actuators, B, 2016, 236, 433–441 CrossRef CAS.
- W. Liu, C. L. Cassano, X. Xu and Z. H. Fan, Anal. Chem., 2013, 85, 10270–10276 CrossRef CAS PubMed.
- G. E. Fridley, H. Q. Le, E. Fu and P. Yager, Lab Chip, 2012, 12, 4321–4327 RSC.
- W.-B. Shim, K. Kim, J. A. Ofori, Y.-C. Chung and D.-H. Chung, J. Food Prot., 2012, 75, 1991–1999 CrossRef CAS PubMed.
Footnote |
| † Electronic supplementary information (ESI) available. See DOI: 10.1039/c6an01475e |
| This journal is © The Royal Society of Chemistry 2016 |


