 Open Access Article
An experimental study on the influence of trace impurities on ionization of atmospheric noble gas dielectric barrier discharges†
F. D.
Klute
a,
A.
Schütz
 a,
A.
Michels
a,
C.
Vadla
b,
D.
Veza
c,
V.
Horvatic
b and
J.
Franzke
*a
a,
A.
Michels
a,
C.
Vadla
b,
D.
Veza
c,
V.
Horvatic
b and
J.
Franzke
*a
aISAS—Leibniz Institut für Analytische Wissenschaften, Bunsen-Kirchhoff-Str. 11, 44139 Dortmund, Germany. E-mail: joachim.franzke@isas.de
bInstitute of Physics, Bijenicka 46, 10000 Zagreb, Croatia
cDepartment of Physics, Faculty of Science, University of Zagreb, Bijenicka 32, 10000 Zagreb, Croatia
First published on 4th August 2016
Abstract
While the influence of trace impurities in noble gas discharges is well established in theoretical work, experimental approaches are difficult. Particularly the effects of trace concentrations of N2 on He discharges are complicated to investigate due to the fact that for He 5.0 the purity of He is only 99.999%. This corresponds to a residual concentration of 10 ppm, thereof 3 ppm of N2, in He. Matters are made difficult by the fact that He DBD plasmajets are normally operated under an ambient atmosphere, which has a high abundance of N2. This work tackles these problems from two sides. The first approach is to operate a DBD plasmajet under a quasi-controlled He atmosphere, therefore diminishing the effect of atmospheric N2 and making a defined contamination with N2 possible. The second approach is using Ar as the operating gas and introducing propane (C3H8) as a suitable substitute impurity like N2 in He. As will be shown both discharges in either He or Ar, with their respective impurity show the same qualitative behaviour.
Introduction
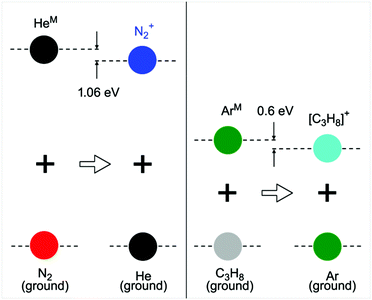
The use of dielectric barrier discharges (DBDs) at atmospheric pressure is widespread in different fields of science and in different applications.1–13 This is mainly due to their easy to operate setup, low power consumption, operation at a wide range of pressure and stability and therefore capability for long term operation, to name only some of their advantages. Next to industrial applications such as surface treatment or coating, medical applications or analytical approaches, DBDs also offer many advantages for fundamental studies. Their easy and stable operation gives access to an ideal system for time and space resolved measurements over a long time period without significant changes to the investigated system. It is therefore an ideal system to study the excitation and ionisation mechanisms of noble gas systems at atmospheric pressure. Many theoretical studies have already underlined the importance of trace impurities in this kind of discharge, naming N2 as the most important one.14,15 The experimental approach in this work will show that N2 is most certainly the main source of positive ions in a He DBD at atmospheric pressure with the here presented discharge parameters. These ions are formed by Penning ionisation of HeM with N2 giving a N2+ ion and an e−. The process is illustrated in Fig. 1. The fact that N2 is naturally abundant in a He discharge that is operated under an ambient atmosphere from either diffusion or trace contamination from the gas supply is on one hand an advantage for the easy operation of the DBD due to the fact that the source of ions is always present. On the other hand for the same reason a comparison of a contaminated system with a pure system is rather difficult. Therefore, a model system was introduced, using Ar as the noble gas and propane (C3H8) as the impurity, for a comparison of contaminated and pure systems. As Fig. 1 shows He and metastable states, starting at around 19.81 lie well above the ionisation energy of N2, which is around 15.58 eV and are even high enough to excite the B2Σ+u of N2+ with an energy of 18.75 eV. For a broader overview of all the involved levels refer to the ESI.†Ar is the first noble gas with a metastable energy of 11.54 eV that is lower than the ionization energy of N2. An Ar discharge can therefore not produce N2+ ions from Penning ionization collisions of ArM with N2. This leads to the fact that an Ar DBD needs higher applied voltages when compared to the system operated in He, because Ar has to be ionized directly when no suitable substitute for N2 is added. It is easy for electrons in an atmospheric DBD to reach energy levels up to the metastable energies of the respective working gas, through a cascade of inelastic collisions. However, the opposing voltage dependence of He and Ar indicates that it is much harder to further increase the energy of electrons up to the point where an effective ionisation of the working gas takes place once the metastable energies are met. To prove the importance of Penning ionization collisions of noble gas metastables with trace impurities, for the generation of positive species in a noble gas, propane (C3H8) was chosen, for Ar, as a substitute for N2 in He. With an ionisation energy of 10.94 eV it should be an appropriate ionization source of Ar.
Experimental
Experimental arrangement
To investigate the influence of trace impurities in a noble gas atmospheric DBD plasmajet discharge a quartz capillary configuration with a cylindrical electrode was chosen. The electrodes are separated by a 10 mm gap and have a width of 1 mm. The first electrode is placed 1 mm from the capillary orifice and is connected to the HV power supply. The electrodes are directly soldered onto the glass of the capillary to ensure an optimal contact of the metal surface and the quartz capillary. There were two power supplies used to operate the DBD, both in-house built square wave generators with very fast rise times of the applied voltage (voltage slope >4 kV μs−1) and a very stable output from 0–3.5 kV for the smaller version (generator I) and 0–6 kV for the bigger version (generator II). While it is possible to operate generator II at low voltages (>3.0 kV) it starts to show instabilities in these regions. It was therefore better to use generator I for most of the measurements shown in this work. The output of the power supply is stable over several hours making comparable time and space resolved emission measurements possible. A two channel digital oscilloscope Agilent DSO-X 3012A was used for these measurements, with one channel monitoring the discharge current by measuring the voltage over a 100 Ω resistance at the grounded electrode and the other channel monitoring the time resolved signal of an ET 9558 QB photomultiplier tube. The emission signal was amplified by an in-house built circuit before it was measured by an oscilloscope giving an overall temporal resolution of up to 1 ns. To distinguish the emission of different plasma species a 1 m monochromator from McPhearson was applied to select characteristic wavelengths from the relevant plasma species. The discharge itself was mounted on an mm-stage that could be moved perpendicular to the entrance slit of the monochromator. Given a 0.25 mm slit width and a 1![[thin space (1/6-em)]](https://www.rsc.org/images/entities/char_2009.gif) :
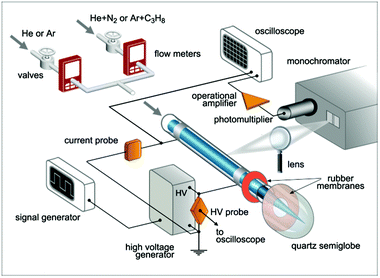
:![[thin space (1/6-em)]](https://www.rsc.org/images/entities/char_2009.gif) 1 imaging of the discharge onto this slit, a spatial resolution of 0.25 mm could be achieved in the best case. An optical fibre coupled to an Ocean optics USB 2000 spectrometer was used to obtain an overview of all emission lines to observe the parallel time integrated behaviour of different plasma species. Two mass flow controllers were applied to adjust the amount of impurity of the used noble gas. One mass flow controller was connected to a noble gas supply (He or Ar) the other one was connected to a gas bottle with a prepared mixture of either He and N2 or Ar and C3H8 (Fig. 2). This mixture was prepared in a 10 l gas bottle, which was first evacuated with a rotary vane pump and then filled with pressure up to 6 bar with the respective noble gas giving a resulting volume of 60 l. However before the noble gas was filled in the gas bottle a small volume of the corresponding impurity was added with a gas tight syringe through a rubber sealed connection. Noble gas mixtures with controlled impurities ranging from 300–1200 ppmV could be prepared with this method. It was possible to vary the concentration of the impurity in the discharge over several orders of magnitude by combining the pure master flow from the first mass flow controller with the mixed flow from the second mass flow controller, without changing the overall flow through the discharge. A quartz semiglobe that could be connected to the capillary orifice via a rubber seal was used to create a relatively pure noble gas atmosphere around the capillary. This was primarily used to decrease the influence of atmospheric N2 in the He discharge and therefore making controlled contamination in He possible to a certain degree.
1 imaging of the discharge onto this slit, a spatial resolution of 0.25 mm could be achieved in the best case. An optical fibre coupled to an Ocean optics USB 2000 spectrometer was used to obtain an overview of all emission lines to observe the parallel time integrated behaviour of different plasma species. Two mass flow controllers were applied to adjust the amount of impurity of the used noble gas. One mass flow controller was connected to a noble gas supply (He or Ar) the other one was connected to a gas bottle with a prepared mixture of either He and N2 or Ar and C3H8 (Fig. 2). This mixture was prepared in a 10 l gas bottle, which was first evacuated with a rotary vane pump and then filled with pressure up to 6 bar with the respective noble gas giving a resulting volume of 60 l. However before the noble gas was filled in the gas bottle a small volume of the corresponding impurity was added with a gas tight syringe through a rubber sealed connection. Noble gas mixtures with controlled impurities ranging from 300–1200 ppmV could be prepared with this method. It was possible to vary the concentration of the impurity in the discharge over several orders of magnitude by combining the pure master flow from the first mass flow controller with the mixed flow from the second mass flow controller, without changing the overall flow through the discharge. A quartz semiglobe that could be connected to the capillary orifice via a rubber seal was used to create a relatively pure noble gas atmosphere around the capillary. This was primarily used to decrease the influence of atmospheric N2 in the He discharge and therefore making controlled contamination in He possible to a certain degree.
Results and discussion
Measurements and results
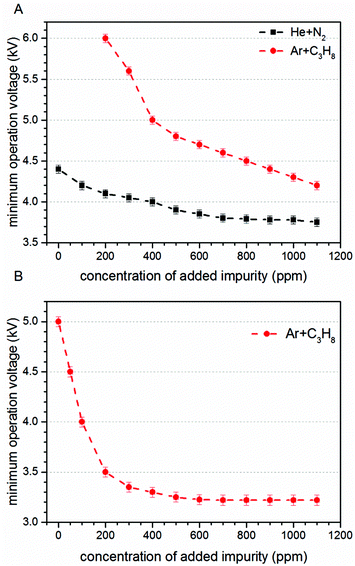
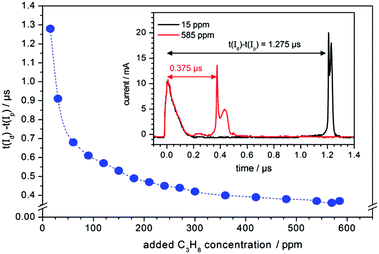
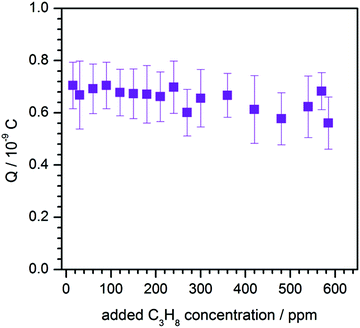
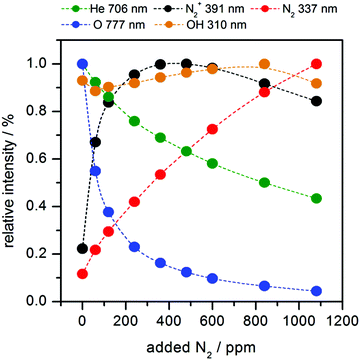
First of all the influence of the degree of impurity on the minimum operation voltage of the discharge was investigated, because as stated before the voltage necessary to operate an Ar-discharge with the same parameters is much higher than that of a He-discharge. This operation voltage should not be mixed up with the voltage necessary to initially ignite a DBD plasma, which is in general much higher than the operation voltage. The minimum operation voltage is the voltage needed to keep the discharge in quasi-stable operation. Fig. 3 shows a strong dependence of the aforementioned minimum operation voltage on the concentration of the impurity. Fig. 3A shows the results of a discharge that was operated with the semiglobe, either using He or Ar as the working gas. Both cases show that, the minimum operation voltage decreases significantly when the concentration of the impurity rises. For Ar it was only possible to ignite and operate the discharge with a minimum added C3H8 impurity of 200 ppmV and a voltage of 6.0 kV. On comparing both cases He shows a much shallower and smaller decrease of the operation voltage of only 0.6 kV in total. The decrease caused by using the Ar working gas is much stronger pronounced with a total of 1.8 kV and also the decrease is much steeper. This indicates that the residual concentration of N2 is still very high for the case of He discharge leading to an unknown offset for the concentration of impurity.The quartz semiglobe was also a source of instability for the discharge, which can be seen by comparing the results of Fig. 3A and B. Without the semiglobe it was possible to ignite the Ar discharge with only a small amount of C3H8 at a maximum voltage of 6.0 kV. This small amount of C3H8 was stepwise removed until the discharge reached a stable operation point without any C3H8 left in the discharge. The minimum operation voltage of pure Ar with the same discharge parameters could be subsequently reduced to 5.0 kV. Only a slight increase of the C3H8 concentration to 200 ppmV decreases this voltage by 1.5 kV. At a concentration of around 300 ppmV C3H8 the voltage reducing effect of the impurity diminishes and the voltage saturates at 3.2 kV giving a total decrease of 1.8 kV. A comparison of the Ar measurement to the one made with He shows that the impact of added N2 on the operation voltage of the helium discharge is smaller than the impact of C3H8, but qualitatively similar. On comparing the slopes of the discharge, it can be assumed that despite the quartz semiglobe the residual concentration of N2 in a He atmosphere is still in the ∼100 ppmV range where the most pronounced effect of the added impurity could be observed in Ar. When a fixed voltage is used it can be observed that the plasma current occurs faster when the concentration of the impurities increases as shown in Fig. 4. This behaviour can be seen for both noble gases He and Ar alike but only the case of Ar is shown. The time delay of the plasma current relative to the displacement current can be interpreted as the time necessary for the discharge to accumulate positive charges to fully ignite. During this time delay two early plasmas, one outside the capillary called the plasmajet and one inside the capillary called early plasma develop as was shown in previous studies and will be shown later on.16 During the time these early plasmas form, noble gas metastables are generated by collisions with electrons and in turn ionize a suitable impurity. This process takes place until enough ions are accumulated and the ignition of the inner coincident plasma takes place. This plasma is called coincident plasma because its occurrence is coincidental with the plasma current. When the concentration of the impurity is increased, the accumulation of the ions speeds up leading to the observable decrease of the time delay between the plasma current and the displacement current. Fig. 5 supports this fact as it shows that while the time delay decreases drastically by nearly one whole microsecond the charge coupled to the discharge remains nearly constant considering the accuracy of the measurement. It seems that a critical charge of positive species has to be accumulated in order to ignite the coincident plasma. This critical charge can be accumulated faster if the level of impurity is higher leading to a higher ionization efficiency of the Penning ionization of N2+ by collisions of HeM with N2. This process can be observed, if the emission of the discharge could be measured with high spatial and temporal resolutions. Fig. 6 shows the spatio-temporal development of the He 706 nm and the N2+ 391 nm emission. As mentioned before there is already a strong emission in the time delay between the displacement and plasma current lasting approximately 0.62 μs. These early emissions, in particular, the plasma jet, play a key part in the soft ionization process for molecular mass spectrometry and were the focus of previous studies.17–19 The coincident plasma on the other hand can be attributed to a dissociative character unwanted in most soft ionization processes.16 While it was already shown that the intensity of this plasma strongly depends on the charge coupled to the DBD and could be enhanced significantly by increasing the total electrode width of the used DBD, the mode change from an early soft plasma to a dissociative coincident plasma can only be understood with the ionization of the trace impurities. As can be seen from Fig. 6 the He emission shows a very narrow temporal distribution when compared to the N2+ emission. This arises from the fact that He is excited by electron collisions which very strictly follow the applied electric field and have very narrow energy distributions. The N2+ ions on the other hand are generated by collisions with the previously excited HeM which leads to a blurred temporal distribution due to the fact that the HeM does not follow any field and the collisions leading to the ionization of the N2+ are highly statistical. This also leads to the fact that the emission of N2+ follows behind the emission of He by a couple of ten to hundred ns (105–70 ns) and can very well be observed in the provided supplementary video† that shows the time dependent development of both emission lines. This process takes place until the aforementioned critical charge is accumulated. Not only the time of this process is highly dependent on the concentration level of the N2 impurity but also the applied voltage. As indicated in Fig. 6 the emission maximum of N2+ is at 3.5 mm farther away from the grounded electrode than the maximum of the He emission at its 1.3 mm farther away location. While the maximum of He emission remains relatively independent of the parameters, the N2+ emission moves up to 1.5 mm to the grounded electrode for the lowest considered voltage of 2.4 kV and the maximum observed distance with 3.5 kV was 4.5 mm (not shown in Fig. 6). The delay of the plasma current on the other hand can be as short as 0.25 μs for the highest and as long as 12 μs for the lowest voltage in these measurements. If the voltage is too low and the time delay takes longer than a half-period to finish, at 20 kHz this time is 25 μs; not enough positive charges can be accumulated for the plasma to ignite. If on the other hand the time is long enough to accumulate enough positive charges in the previously described process, these charges will attract an avalanche of electrons, creating the first current peak at T1 and also reaccelerate the electrons which have gathered on the glass wall near the applied HV from the start of the positive half cycle. This avalanche and reacceleration lead to an abrupt increase of the electron density and gives the coincident plasma its dissociative character. A second video† is provided, showing a schematic sequence of these processes. While the saturation behaviour observable in Fig. 3 and 4 indicates that the level of impurity cannot be increased indefinitely, the observed relative intensities of several plasma species shown in Fig. 7 show that the intensity of the N2+ 391 nm after increasing by approximately 80% at an added concentration of around 400 ppm, falls again when the concentration is further increased. The intensities were normalised to their maximum intensity to show their relative change. The monotonous decrease of He 706 nm and O 777 nm and the monotonous increase of N2 337 nm can be explained by an increase of electron collisions with N2. This of course increases the excitation of the second positive emission system of N2 but decreases the number of highly energetic electrons necessary for the excitation of He and O. The mainly constant behaviour of the OH 309 nm line further emphasizes this because the upper band A2Σ+ of this transition has only an energy of 4.05 eV and has a direct transition down to the X2Πi ground state. The first energy band of N2 on the other hand is the A3Σu+ with an energy of 6.22 eV, meaning that only the transitions above this energy are directly affected by the N2 concentration. The non-monotonous behaviour of N2+ gives further evidence that the generation of N2+ is directly related to the HeM density. The different excitation mechanisms of the N2 dependent species can also be seen in the spatio-temporal behaviour of the N2 337 nm line shown in Fig. 8A. N2 is excited only when either its concentration is very high which is the case outside of the capillary or the electron density is very high, which is probably the case for the coincident plasma.
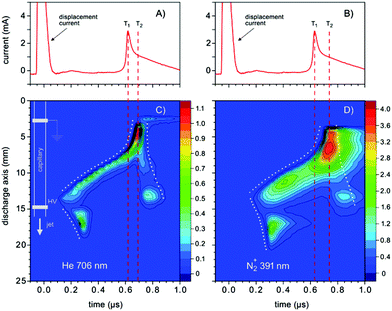 | ||
| Fig. 6 (A), (B) The discharge current signals. (C), (D), Spatio-temporal development of the emissions of He 706 nm and N2+ 391 nm lines observed from the He/N2 mixture, respectively. The discharge was operated at a voltage of 3.0 kV @ 20 kHz and a total flow of 200 ml min−1. 150 ppm N2 was added to the gas mixture. The dotted lines in (C) and (D) are a guide to the eye for the early and coincident plasma formation. T1 indicates the instance of time when the propagation of the excitation towards the cathode increases the velocity, which is accompanied by the first sharp peak in the discharge current. T2 labels the time when the main discharge in the capillary occurs, characterized with the second, broad peak (better discerned in Fig. 8) in the discharge current. See the text for the detailed explanation. | ||
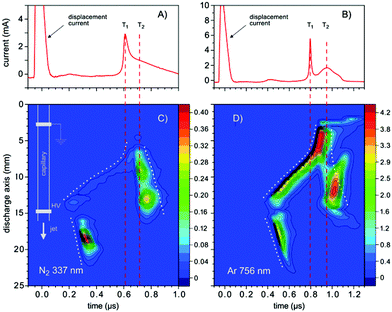 | ||
| Fig. 8 (A), (B) The discharge current signals. (C), (D), Spatio-temporal behaviour of the emissions of the N2 337 nm and Ar 756 nm lines observed from the He/N2 and Ar/C3H8 mixtures, respectively. The parameters for (A) and (C) were the same as that presented in Fig. 6. For (B) and (D) the discharge was operated at 3.0 kV @ 20 kHz and a total Ar flow of 200 ml min−1. 300 ppm of C3H8 was added to the gas mixture. The dotted lines in (C) and (D) are a guide to the eye for the early and coincident plasma formation. T1 indicates the instance of time when the propagation of the excitation towards the cathode increases the velocity, which is accompanied by the first sharp peak in the discharge current. T2 labels the time when the main discharge in the capillary occurs, characterized by the second, broad peak in the discharge current. See the text for the detailed explanation. | ||
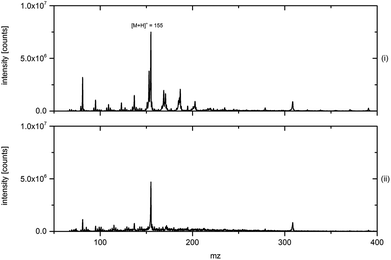
For a confirmation of this a separate electron density measurement for the early plasmas and the coincident plasma is necessary. A comparison of Fig. 8B and 6A shows that the emissions of He 706 and Ar 756 nm have qualitatively the same temporal development starting with a jet and the inner early plasma, leading to the ignition of a coincident plasma. The strong emission of the coincident plasma and the higher plasma current observable in Fig. 8B indicate that the Ar plasma has a higher electron density compared to the He discharge, giving a much stronger coincident plasma. This also has to be confirmed by a separate measurement of the electron density in the early and in the coincident plasmas. Measurements with a MS and an OES system are also necessary to investigate the influence of the potentially higher electron density of an Ar discharge on the soft ionization and dissociation capabilities of the DBDI-source. A comparison of He and Ar mixed with propane as discharge gases using menthone as an analyte is shown in Fig. 9. The protonated peak with a mass of [M + H]+ = 155 g mol−1 can be identified for both discharge gases. Although the absolute signal intensity for case (ii) showing Ar mixed with propane is slightly smaller than that of case (i) that uses He, the overall spectral quality might be better with a smaller background and therefore, a much better signal to noise ratio. For a definite assessment of the suitability of Ar mixed with propane as a discharge gas for soft ionization a more systematic approach would be necessary. In particular, Ar mixed with propane shows a different behaviour regarding the systematic tuning of discharge parameters already presented in the previous studies.19 While menthone could be classified as a category 1 (referring to the nomenclature in ref. 19) analyte when He is used, meaning that tuning does not noticeably change the spectrum at all, it could be defined as a category 4(a) analyte when Ar with propane is used, meaning that the signal intensity increases while the background decreases at the same time. This topic will not be further discussed at this time because it would go far beyond the scope of this work.
Conclusions
Strong evidence of the dominant role of the ionization of trace impurities in a noble gas DBD was shown. In addition, it is possible to artificially create a model system of Ar and C3H8 that behaves similar to the naturally occurring He and N2 systems. With an appropriate impurity, it is therefore possible to operate a DBD in Ar under comparable conditions as in He. As shown, Ar mixed with propane shows comparable results to classical He discharges when used as a soft ionization source in MS measurements. The tuning approach presented in previous studies might further enhance the ionization capabilities of discharges using Ar mixed with propane and has to be further systematically studied. The use of Ar mixed with propane might also lead to cost reduction due to the fact that Ar 5.0 in general only costs half as much as He 5.0. The additional cost of the admixed impurity such as propane can, at the same time, be neglected due to the fact that only trace amounts of several 10–100 ml are necessary to create the desired concentration values of 100–1000 ppmV. More investigations are necessary to do a more systematic comparison of He and Ar as discharge gases and also to show the importance of trace impurities as the main sources of ionisation in atmospheric noble gas DBDs. For example a quantitative measurement of the overall abundance of He+ compared to N2+ and Ar+ compared to C3H8+, respectively, should show a definite excess of the impurity ions. Such a measurement is in general possible by e.g. elemental MS but is made difficult by the fact that ionization of the neutral noble gas flushed into the MS has to be prevented for a definite quantification of the real discharge ions.Acknowledgements
The financial support by the Ministerium für Innovation, Wissenschaft und Forschung des Landes Nordrhein-Westfalen, the Senatsverwaltung für Wirtschaft, Technologie und Forschung des Landes Berlin, the Bundesministerium für Bildung und Forschung, and the Deutsche Forschungsgemeinschaft is gratefully acknowledged. This work has been supported in part by the Croatian Science Foundation under the project no. 2753.References
- B. Eliasson and U. Kogelschatz, Appl. Phys. B, 1988, 46, 299–303 CrossRef.
- O. Goossens, E. Dekempeneer, D. Vangeneugden, R. Van de Leest and C. Leys, Surf. Coat. Technol., 2001, 142, 474–481 CrossRef.
- K. Kunze, M. Miclea, G. Musa, J. Franzke, C. Vadla and K. Niemax, Spectrochim. Acta, Part B, 2002, 57, 137–146 CrossRef.
- G. Borcia, C. A. Anderson and N. M. D. Brown, Plasma Sources Sci. Technol., 2003, 12, 335–344 CrossRef CAS.
- K. Kunze, M. Miclea, J. Franzke and K. Niemax, Spectrochim. Acta, Part B, 2003, 58, 1435–1443 CrossRef.
- N. Na, M. X. Zhao, S. C. Zhang, C. D. Yang and X. R. Zhang, J. Am. Soc. Mass Spectrom., 2007, 18, 1859–1862 CrossRef CAS PubMed.
- J. D. Harper, N. A. Charipar, C. C. Mulligan, X. R. Zhang, R. G. Cooks and Z. Ouyang, Anal. Chem., 2008, 80, 9097–9104 CrossRef CAS PubMed.
- Y. L. Yu, Z. Du, M. L. Chen and J. H. Wang, Angew. Chem., Int. Ed., 2008, 47, 7909–7912 CrossRef CAS PubMed.
- J. F. Garcia-Reyes, F. Mazzoti, J. D. Harper, N. A. Charipar, S. Oradu, Z. Ouyang, G. Sindona and R. G. Cooks, Rapid Commun. Mass Spectrom., 2009, 23, 3057–3062 CrossRef CAS PubMed.
- H. Hayen, A. Michels and J. Franzke, Anal. Chem., 2009, 81, 10239–10245 CrossRef CAS PubMed.
- Y. Zhang, X. X. Ma, S. C. Zhang, C. D. Yang, Z. Ouyang and X. R. Zhang, Analyst, 2009, 134, 176–181 RSC.
- W. Li, X. M. Jiang, K. L. Xu, X. D. Hou and C. B. Zheng, Microchem. J., 2011, 99, 114–117 CrossRef CAS.
- X. M. Jiang, Y. Chen, C. B. Zheng and X. D. Hou, Anal. Chem., 2014, 86, 5220–5224 CrossRef CAS PubMed.
- X. H. Yuan and L. L. Raja, Appl. Phys. Lett., 2002, 81, 814–816 CrossRef CAS.
- T. Martens, A. Bogaerts, W. J. M. Brok and J. V. Dijk, Appl. Phys. Lett., 2008, 92 Search PubMed.
- F. D. Klute, A. Michels, A. Schutz, C. Vadla, V. Horvatic and J. Franzke, Anal. Chem., 2016, 88, 4701–4705 CrossRef CAS PubMed.
- A. Schutz, S. Brandt, S. Liedtke, D. Foest, U. Marggraf and J. Franzke, Anal. Chem., 2015, 87, 11415–11419 CrossRef PubMed.
- V. Horvatic, A. Michels, N. Ahlmann, G. Jestel, D. Veza, C. Vadla and J. Franzke, Anal. Bioanal. Chem., 2015, 407, 7973–7981 CrossRef CAS PubMed.
- A. Schütz, F. D. Klute, S. Brandt, S. Liedtke, G. Jestel and J. Franzke, Anal. Chem., 2016, 88, 5538–5541 CrossRef PubMed.
Footnote |
| † Electronic supplementary information (ESI) available: A schematic energy diagram of the involved levels and animated videos showing emission development in time and the schematic discharge evolution. See DOI: 10.1039/c6an01352j |
| This journal is © The Royal Society of Chemistry 2016 |

