 Open Access Article
Creative Commons Attribution 3.0 Unported Licence
Designed miniaturization of microfluidic biosensor platforms using the stop-flow technique†
C.
Dincer
 *ab,
A.
Kling
a,
C.
Chatelle
cd,
L.
Armbrecht
a,
J.
Kieninger
a,
W.
Weber
cde and
G. A.
Urban
ab
aLaboratory for Sensors, Department of Microsystems Engineering - IMTEK, University of Freiburg, Germany. E-mail: dincer@imtek.de
bFreiburg Materials Research Center - FMF, University of Freiburg, Germany
cCentre for Biological Signalling Studies - BIOSS, Germany
dFaculty of Biology, University of Freiburg, Germany
eSpemann School of Biology and Medicine, University of Freiburg, Germany
First published on 15th August 2016
Abstract
Here, we present a novel approach to increase the degree of miniaturization as well as the sensitivity of biosensor platforms by the optimization of microfluidic stop-flow techniques independent of the applied detection technique (e.g. electrochemical or optical). The readout of the labeled bioassays, immobilized in a microfluidic channel, under stop-flow conditions leads to a rectangular shaped peak signal. Data evaluation using the peak height allows for a high level miniaturization of the channel geometries. To study the main advantages and limitations of this method by numerical simulations, a universally applicable model system is introduced for the first time. Consequently, proof-of-principle experiments were successfully performed with standard and miniaturized versions of an electrochemical biosensor platform utilizing a repressor protein-based assay for tetracycline antibiotics. Herein, the measured current peak heights are the same despite the sextuple reduction of the channel dimensions. Thus, this results in a 22-fold signal amplification compared to the constant flow measurements in the case of the miniaturized version.
Introduction
The miniaturization and portability of biosensor platforms have recently become increasingly important in clinical diagnostics, especially in the field of point-of-care testing (POCT).1,2 In this regard, microfluidic chip design is a crucial point and thus, further improves the analytical performances of lab-on-a-chip (LOC) systems, in particular by reducing the reagent consumption as well as shortening assay preparation and analysis times.3–5In microfluidic LOC platforms employing catalyst labeled bioassays, the dimensions of the immobilization section play a decisive role not only on their overall size, but also on their system performance as bio- or immunosensors. Either a specific part of the microfluidic channel or the detection cell itself serves as the immobilization area. This brings along technical limitations on the design and fabrication of these systems, especially for multi-analyte approaches, as well as non-technical issues (e.g., cost). Nowadays, multiplexing, simultaneous detection of multiple analytes from a single sample, is gaining in importance for point-of-care diagnostics.6–8 Herein, it is highly desirable to realize multiplexed diagnostic platforms in a low-cost and sensitive manner. In this context, the miniaturization of microfluidic devices without any loss of sensor sensitivity is essential and thus, a matter of research interest.2,4,9,10
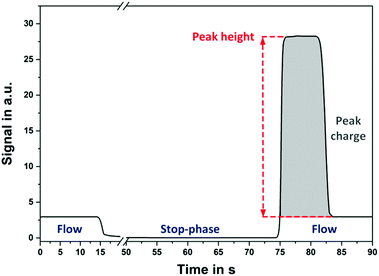
To achieve a signal amplification along with rapid detection in any enzyme-mediated microfluidic biosensor, the so called stop-flow technique, similar to the flow injection analysis (FIA),11,12 can be employed. This method facilitates the fast and sensitive detection of various analytes independent of the assay format, as presented previously in the literature.13–16 In this technique, the fluid flow through the microcapillary is interrupted for a defined time interval (termed as stop-time). This results in an accumulation of the products of enzymatic reactions in the immobilization section (e.g. the target molecule hydrogen peroxide (H2O2) in the case of the enzyme glucose oxidase (GOx)). By restarting the flow, this enhanced concentration of target molecules is subsequently flushed over the measurement cell for detection (e.g., in this work the electrochemical cell). The obtained rectangular-shaped peak signal, as illustrated in Fig. 1, arises from the target concentration profile and is directly proportional to the duration of the stop-time. The longer the stop interval is, the higher the measured signal response will be.
For the data analysis, the stop-flow technique provides two different parameters, the height and the charge (i.e., the integral) of the peak signal. Considering the signal evaluation based on the peak height, the concentration profile of the target molecule (e.g., H2O2) over the channel cross-section is crucial for the gauged signals and thus, leads to the rectangular-shaped signal behavior. This concentration profile depends only on the diffusion coefficient of the target molecule and on the applied stop-time.16 Therefore, the maximum peak height of the stop-flow signal remains constant down to a minimum length of the immobilization region of the channel. This special feature enables a drastic decrease in sensor geometries, especially in the channel length, of traditional microfluidic biosensor systems independent of the utilized detection technique (e.g., electrochemical or optical) while enhancing their sensitivity and detection time. In this regard, the main advantages and limitations of the stop-flow technique including the diffusion of the analyte as well as the channel dimensions have to be studied by numerical simulations. Herein, the quantification of the smallest possible immobilization capillary maintaining its full functionality is of great importance for the optimization of microfluidic biosensors.
In recent years, the prevalence of multi drug-resistant bacteria has become a serious issue worldwide.17 Herein, the extensive usage of antibiotics is one of the major driving forces. Thus, this has to be kept under surveillance. In this regard, there is a great demand for point-of-care devices enabling the fast, low-cost and quantitative detection of antibiotics. Tetracyclines, a group of broad-spectrum antibiotics, are mostly employed as growth promoters in the livestock industry.18
This work is based on the claim that application of the stop-flow technique eliminates the effect of channel geometry on sensor performance (e.g., the sensitivity) and thus, increases the degree of miniaturization in microfluidic biosensor platforms. For the verification of this claim, a universally applicable model system for different channel dimensions, measurement conditions (e.g., flow rate or stop-time) or even channel materials was introduced by time-dependent 3D simulations. By varying the size of the immobilization area, the minimal channel length without the loss of sensor sensitivity was determined. Consequently, a miniaturized format of the existing electrochemical biosensor chip was designed and fabricated. Finally, the proof-of-principle experiments were carried out using a repressor protein-based antibiotic assay for tetracyclines to compare the performances of the standard and the miniaturized biosensor versions.
Numerical simulations
The numerical simulation of the differential equations has been performed through a finite element method (FEM) with COMSOL Multiphysics 5.1 (COMSOL Inc., Sweden). In this context, a simulation model was generated and combined with the appropriate initial and boundary conditions. Subsequently, it was solved on a Mac OS X platform utilizing an Intel 3.06 GHz Core 2 Duo processor with 12 GB RAM.Simulation model
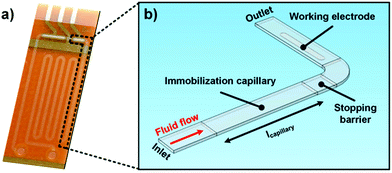
For the numerical analysis of the stop-flow technique, the basic model geometry is an L-shaped microchannel, as depicted in Fig. 2. It comprises an immobilization capillary with a 500 × 64 μm2 rectangular cross-section and a variable length Lchannel, a working electrode (WE) having an electroactive area of 19.7 × 10⁻² μm2, and a 5 μm deep well as a stopping barrier in order to define the immobilization section. The channel height of 64 μm is given by the thickness of the used dry film photoresist (DFR), Pyralux® PC1025 (DuPont™, USA). The flow direction is highlighted in Fig. 2b and occurs from the inlet to the outlet of the channel.Boundary conditions
The values of the parameters used in the boundary conditions employed in the simulations are depicted in Table 1.| Parameters | Value | Unit | Remark |
|---|---|---|---|
| Temperature, T | 298 | K | |
| Density, ρ | 1 × 10³ | kg m−3 | Water |
| Dynamic viscosity, μ | 0.001 | Pa s | Water |
| Diffusion coefficient, D | 1 × 10⁻⁹ | m2 s−1 | H2O2![[thin space (1/6-em)]](https://www.rsc.org/images/entities/char_2009.gif) 19 19 |
| Flow rate | 10.4 × 10⁻³ | m s−1 | |
| Enzyme unit per area, nenzyme | 4.27 | m−2 | Experimentally derived |
| Enzyme activity per unit, aenzyme | 0.166 × 10⁻⁷ | mol s−1 | GOx @ 25 °C (ref. 20) |
Fluid flow
For microfluidics, the Reynolds numbers are low (typically Re ≤ 1) due to low fluid velocities and small channel geometries. As a result, the surface forces (e.g., viscous shear stress) become dominant over the body forces (e.g., gravitation).21–23 The microfluidic flow is assumed to be incompressible since it is far in the laminar regime. Neglecting the momentum conservation and the terms of mass (e.g., convection) the flow velocity field in microcapillaries is simply formulated by the Navier–Stokes and continuity equations as:The resulting Poiseuille flow is characterized by the typical parabolic velocity profile with its maximum at the channel center and zero velocity (no-slip condition) at the capillary walls. In the simulation model, the no-slip boundary conditions are employed for all of the channel walls. Furthermore, a constant velocity is applied to the inlet of the microfluidic channel while the channel outlet is set to no pressure conditions. The stop-flow protocol is achieved by utilizing a rectangle step function where the flow is interrupted for a given stop-time.
Mass transport
In microfluidic systems, molecules are transported through the channel by controlled convection (e.g., using a pump). On the other hand, the diffusion dominates the mass transport transverse to the direction of the fluid flow to compensate the resulting concentration gradient because of the electrochemical reaction at the WE. The flux of the electroactive species to the working electrode is time-dependent. Fick's second law describes their concentration change with time for the linear diffusion asSince there is no mass transport possible through the channel walls, insulation (no flux) boundary conditions are applied to all walls except for those of the immobilization capillary. Here, the capillary surfaces of the immobilization capillary (beside the channel bottom side because of the inactivity of SU-8) are specified as the inward flux boundary along with a time-dependent function f(t) = nenzyme·aenzyme·t to represent the glucose oxidase-based hydrogen peroxide generation. The linear time dependency is due to the operation under substrate saturation and therefore, the Michaelis–Menten term can be neglected. Furthermore, the outflow boundary is applied to the capillary outlet, where the electroactive molecules are transported out by the microfluidic flow. For the realization of the electrochemical reaction, the H2O2 concentration at the working electrode is implied to be zero. It should be noted that the electron transfer rate at the platinum is assumed to be sufficiently high.
In summary, the following initial and boundary conditions are implemented using the time-dependent, laminar “Incompressible Flow” module along with the “Transport of Diluted Species” interface of COMSOL Multiphysics for the simulations of the stop-flow technique in a 3D environment:
| CH2O2@ Electrode(t) = 0 |
| CH2O2@ Channel(t = 0) = 0 |
| CH2O2@ Immobilization area(t) = nenzyme·aenzyme·t |
| υChannel walls(t) = 0 (no-slip) |
Simulation of the stop-flow technique
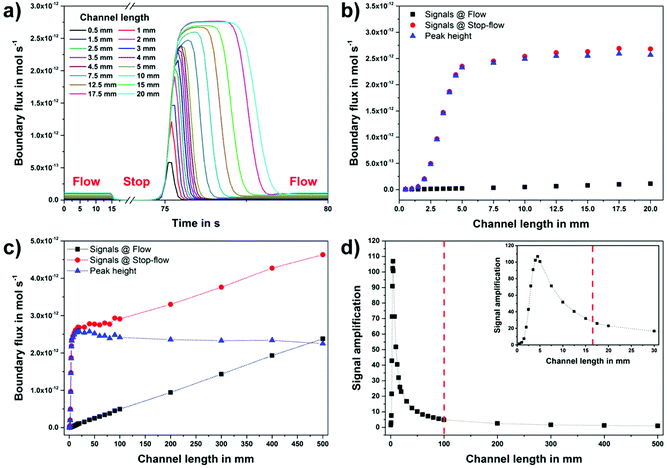
The influence of the channel geometry on the sensor performance of microfluidic biosensors was studied numerically by employing the stop-flow technique. To imitate the electrochemical detection of hydrogen peroxide, the boundary flux values (mol s−1), similar to the amperometric current signals, at the working electrode were calculated for different lengths of the immobilization capillary and compared with each other.A parameter study for different channel lengths between 0.5 mm and 50 cm for the immobilization section was carried out. As expected for the microfluidic flow profile, a fully developed laminar flow was observed in all simulations. The simulated stop-flow signal peaks, their comparison with the simulated continuous flow signal levels as well as the resulting signal amplification for different channel geometries are summarized in Fig. 3.
In the case of the continuous fluid flow, the calculated boundary flux values are constant and their signal levels correlate with the channel length of the immobilization area, as illustrated in Fig. 3a. As the flow is interrupted, the analyte (here hydrogen peroxide) concentration near the working electrode decreases drastically to a minimum level, which is defined by the analyte diffusion to the electrode. At the same time, the hydrogen peroxide concentration accumulates linearly in the immobilization section. After the restart of the flow, this increased H2O2 concentration is transported to the working electrode and thus, it results in the experimentally validated, rectangle-like peak signal behavior of the stop-flow technique.
The calculated stop-flow signals for different channel dimensions, as depicted in Fig. 3a, demonstrate that the charge of the stop-flow peak, the total analyte concentration, increases linearly with the channel length of the immobilization area. On the other hand, the obtained peak values reach a plateau under consideration of the linearly increasing flow (background) signals at larger immobilization capillary dimensions.
The comparison of the boundary flux values between the stop-flow technique (using the peak height) and the constant flow is given in Fig. 3b. The simulated signals at a constant flow (black) are directly proportional to the immobilization capillary length as the peak height values (blue) are saturated at a channel length of only 5 mm. To support this statement, a comprehensive comparison at larger immobilization capillary dimensions (up to 50 cm) is presented in Fig. 3c.
This special feature of the stop-flow technique based on the peak height results in a signal amplification (e.g., more than 100-times at a capillary length of 5 mm) compared to the constant flow, as illustrated in Fig. 3d. At this point, the shorter the immobilization channel length is, the higher the obtained signal gain will be. Starting from a minimum channel length (in this work 4.5 mm) dependent on the given model geometry, at which the maximum peak height of the stop-flow measurement cannot be reached anymore, the signal amplification decreases again.
The numerical simulations presented in this work show that the use of the stop-flow technique does not only highly increase the degree of miniaturization in microfluidic biosensors, but also enhances their sensor performance regarding sensitivity as well as detection time.
Proof-of-principle measurements
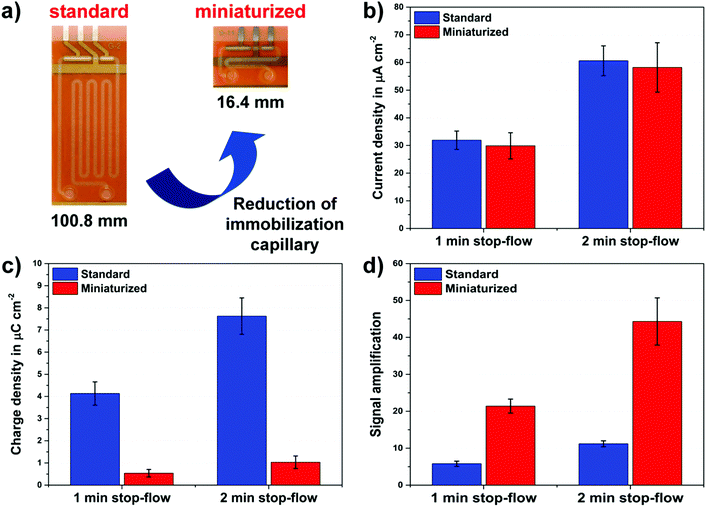
For the verification of our claim and the predictions of the simulations, proof-of-principle measurements were performed in diluted human plasma using a repressor protein-based antibiotic assay for tetracyclines. In this context, two different versions, a standard and a miniaturized format, of the electrochemical biosensor platform were compared with each other. The standard biosensor has an immobilization capillary with a channel length of 100.8 mm, while the channel length of the miniaturized chip is 16.4 mm only, as depicted in Fig. 4a.The microfluidic biosensor chips are produced at the wafer-level by common MEMS technology, employing a dry film photoresist. The fabrication procedure is based on laminating different layers of DFR on a polyimide wafer with patterned platinum, forming the microfluidic channels. The design and fabrication of the DFR based microfluidic biosensors have been previously described in detail elsewhere.24
The working principle of the repressor protein-based antibiotic assays relies on the resistance mechanism developed by some prokaryotes against different classes of antibiotics (e.g., tetracyclines).18,25,26 It comprises a repressor protein (e.g., TetR) that binds to its cognate operator DNA (e.g., tetO). The addition of antibiotics (e.g., tetracyclines) results in the dose-dependent dissociation of the protein–DNA complexes. Thus, the repressor protein-based antibiotic assay shows competitive behavior. The major benefits of these systems are the high sensitivity and specificity of the repressor protein to its cognate antibiotics owing to high association rate constants (e.g., Ka = 109 M−1 in the case of TetR and tetracycline27). The assay preparation for the on-chip tetracycline detection is explained in detail in the ESI.†
To demonstrate the proof-of-principle, the on-chip tetracycline assay signals in the absence of antibiotics were recorded in quadruplicate for different versions of the microfluidic biosensor platform. The obtained results, the current height and the charge of the stop-flow signals, are presented in Fig. 4b and c. Herein, adequate intra-assay CVs of below 15% were achieved with both biosensor formats by stop-flow measurements for different stop-times.
As predicted by the simulations, the current peak heights of both chip designs are nearly the same despite the significant difference in the channel length of their immobilization capillaries, as shown in Fig. 4b. In contrast, the measured peak charge values (Fig. 4c) differ more than 6-times from each other depending on the ratio of their channel dimensions. Finally, the signal gains achieved with both biosensor formats by means of the stop-flow technique are displayed in Fig. 4d. Compared to the simulations, the measured values of 5.8 and 22.4 are in good agreement with the calculated signal amplifications of 4.9 and 28.1 for the standard and the miniaturized biosensor versions, respectively. Hereby, the results of the proof-of-principle experiments clearly verified our postulated claim about the stop-flow technique.
Conclusions
The application of the stop-flow technique using the peak height for the data evaluation enhances the miniaturization degree and the performance, such as the sensitivity and detection time, of the microfluidic biosensor platforms by eliminating the influence of the channel dimensions on the sensor characteristics.A simulation model for microfluidic LOC platforms using the stop-flow method is introduced for the first time to study the optimal channel length of the immobilization capillary. This universally applicable system enables the investigation of different channel cross-sections, measurement conditions (e.g., flow rate or stop-time) or even channel materials. Therewith, different design rules for microfluidic biosensors are derived from numerical simulations. Data analysis of the stop-flow technique by the peak height can result in signal amplifications about more than 100-times in typical biosensor formats compared to the constant flow measurements by miniaturizing the chip dimensions.
In order to verify the proposed claim, proof-of-principle measurements were successfully carried out with standard and miniaturized formats of the existing electrochemical biosensor platform using a repressor protein-based antibiotic assay for tetracyclines. Comparing the performances of both chip versions, the consequent current peak heights are almost identical in spite of the considerable differences in their channel volumes. Furthermore, a 22-fold signal amplification is achieved with the miniaturized biosensors. In order to provide a quantitative comparison, different aspects of both biosensor formats are summarized in Table 2.
| Miniaturized | Standard | |
|---|---|---|
| Capillary length | 16.4 mm | 100.8 mm |
| Chip size | 8 × 10.2 mm2 | 25.65 × 10.2 mm2 |
| Chips per 6′′ wafer | 130 | 40 |
| Channel volume | 580 nl | 3.24 μl |
| Hydraulic resistance, RH (in GPa s m−3) | 1.44 | 8.86 |
| Sample/reagent consumption | 17.9% | 100% |
| Signal gain by the stop-flow technique | 22.4 | 5.8 |
In light of this knowledge, our future work will be the compact and cost-effective implementation of a highly miniaturized microfluidic multiplexed biosensor platform for point-of-care diagnostics.
Acknowledgements
The authors thank the German Research Foundation (DFG) for the funding of this work under grant numbers UR 70/10-01, WE 4733/4 and EXC-294 (BIOSS). Furthermore, we would like to acknowledge the University Medical Center Freiburg, Germany for providing serum samples.Notes and references
- J. Kling, Nat. Biotechnol., 2006, 24, 891–893 CrossRef CAS PubMed.
- A. Manz, N. Graber and H. M. Widmer, Sens. Actuators, B, 1990, 1, 244–248 CrossRef CAS.
- G. M. Whitesides, Nature, 2006, 442, 368–373 CrossRef CAS PubMed.
- A. Bange, H. B. Halsall and W. R. Heineman, Biosens. Bioelectron., 2005, 20, 2488–2503 CrossRef CAS PubMed.
- P. Yager, T. Edwards, E. Fu, K. Helton, K. Nelson, M. R. Tam and B. H. Weigl, Nature, 2006, 442, 412–418 CrossRef CAS PubMed.
- S. Spindel and K. E. Sapsford, Sensors, 2014, 14, 22313–22341 CrossRef CAS PubMed.
- Y.-J. Ko, J.-H. Maeng, Y. Ahn, S. Y. Hwang, N.-G. Cho and S.-H. Lee, Electrophoresis, 2008, 29, 3466–3476 CrossRef CAS PubMed.
- Q. Fu, J. Zhu and J. E. Van Eyk, Clin. Chem., 2010, 56, 314–318 CAS.
- C. D. Chin, V. Linder and S. K. Sia, Lab Chip, 2007, 7, 41–57 RSC.
- E. K. Sackmann, A. L. Fulton and D. J. Beebe, Nature, 2014, 507, 181–189 CrossRef CAS PubMed.
- D. Betteridge, Anal. Chem., 1978, 50, 832A–846A CrossRef CAS.
- J. Ruzicka and E. H. Hansen, Flow injection analysis, John Wiley & Sons, Inc., New York, 2nd edn, 1988 Search PubMed.
- J. Horak, C. Dincer, H. Bakirci and G. Urban, Sens. Actuators, B, 2014, 191, 813–820 CrossRef CAS.
- J. Horak, C. Dincer, H. Bakirci and G. Urban, Biosens. Bioelectron., 2014, 58, 186–192 CrossRef CAS PubMed.
- J. Horak, C. Dincer, E. Qelibari, H. Bakirci and G. Urban, Sens. Actuators, B, 2015, 209, 478–485 CrossRef CAS.
- T. Ohashi, K. Mawatari, K. Sato, M. Tokeshi and T. Kitamori, Lab Chip, 2009, 9, 991–995 RSC.
- F. J. Lannigan, Clin. Otolaryngol. Allied Sci., 2004, 29, 284–284 CrossRef PubMed.
- C. C. Weber, N. Link, C. Fux, A. H. Zisch, W. Weber and M. Fussenegger, Biotechnol. Bioeng., 2005, 89, 9–17 CrossRef CAS PubMed.
- S. B. Hall, E. A. Khudaish and A. L. Hart, Electrochim. Acta, 1999, 44, 4573–4582 CrossRef CAS.
- M. Biomedicals, Product data sheet of Glucose Oxidase from Aspergillus niger, 2010.
- G. Hauke, An Introduction to Fluid Mechanics and Transport Phenomena, Springer, Netherlands, Dordrecht, 2008, vol. 86 Search PubMed.
- M. J. Davies, M. P. C. Marques and A. N. P. Radhakrishnan, in Microfluidics in Detection Science: Lab-on-a-chip Technologies, ed. F. H. Labeed and H. O. Fatoyinbo, Royal Society of Chemistry, 2015, pp. 29–60 Search PubMed.
- K. W. Oh, K. Lee, B. Ahn and E. P. Furlani, Lab Chip, 2012, 12, 515–545 RSC.
- L. Armbrecht, C. Dincer, A. Kling, J. Horak, J. Kieninger and G. Urban, Lab Chip, 2015, 15, 4314–4321 RSC.
- M. Gossen and H. Bujard, Proc. Natl. Acad. Sci. U. S. A., 1992, 89, 5547–5551 CrossRef CAS.
- N. Link, W. Weber and M. Fussenegger, J. Biotechnol., 2007, 128, 668–680 CrossRef CAS PubMed.
- P. Orth, D. Schnappinger, W. Hillen, W. Saenger and W. Hinrichs, Nat. Struct. Biol., 2000, 7, 215–219 CrossRef CAS PubMed.
Footnote |
| † Electronic supplementary information (ESI) available: On-chip tetracycline assay preparation and on-chip electrochemical measurements. See DOI: 10.1039/c6an01330a |
| This journal is © The Royal Society of Chemistry 2016 |


