 Open Access Article
Quantitative surface-enhanced Raman spectroscopy for kinetic analysis of aldol condensation using Ag–Au core–shell nanocubes†
Joshua D.
Weatherston
 ,
Nolan C.
Worstell
 and
Hung-Jen
Wu
*
Dept. of Chemical Engineering, Texas A&M University, College Station, Texas, 77843, USA. E-mail: hjwu@tamu.edu
First published on 22nd August 2016
Abstract
Surface-enhanced Raman spectroscopy (SERS) is a powerful tool with high potential for multiplexed detection of dilute analytes. However, quantitative SERS of kinetic assays can be difficult due to the variation in enhancement factors caused by changing reaction conditions. We report a method for quantitative SERS kinetic analysis using colloidal Ag–Au core–shell nanocubes (Ag@AuNCs) as the SERS substrate. This substrate is mass producible, possesses large SERS enhancement, and is resistant to degradation in most environments. The SERS enhancement of the Ag@AuNCs was evaluated both experimentally and computationally. Quantitation was achieved by covalently attaching a non-reactive internal standard (IS) to substrate surfaces and normalizing SERS spectra to the IS signal. We demonstrated that IS normalization corrects for temporal variations in enhancement factor and particle concentration. Quantitation was demonstrated by monitoring the base-catalyzed aldol condensation of surface-bound 4-(methylthio)benzaldehyde with free acetone. The kinetic model of this reaction was fitted to IS normalized SERS data, resulting in kinetic parameters that agreed well with published values. This SERS platform is a robust and sensitive method for quantitative analysis of kinetic assays, with potential applications in many fields.
1. Introduction
Raman spectroscopy is an analytical technique which provides fingerprint information capable of directly identifying chemical species. Surface-enhanced Raman Spectroscopy (SERS) is a surface phenomenon that amplifies the inherently weak Raman scattering signal of molecules adsorbed on metal surfaces by many orders of magnitude.1–3 SERS advantages include large signal enhancement, fingerprint chemical identification, and inherent suitability for aqueous measurements. These advantages make SERS an effective tool for qualitative detection of dilute analytes in complex media. SERS has great potential for sensing applications in many fields, including biological detection, environmental toxicology, reaction analysis, and forensic science.4–6 However, quantitative SERS remains challenging because the signal strength can be confounded by variable signal enhancements.7The SERS effect is induced primarily by the amplified electromagnetic (EM) field near nanostructured metal surfaces. EM enhancement is a near-field effect and is particularly large in hot spots – nanoscale gaps between surfaces. Because of this, SERS-active substrates have been designed either as solid films of patterned metallic structures8 or as nanoparticle colloids.9 Both types of substrate provide large signal enhancement, but they also suffer from variability in enhancement. In patterned films, the uniformity of periodic metallic structures can influence the SERS effect. In nanoparticle colloids, particle sedimentation and aggregation can change the average interparticle distance between nanoparticles, modulating the strength of SERS signals. In addition, the SERS effect is dependent on the local dielectric environment, which can change as a reaction mixture evolves with time. Therefore, quantitative detection must be designed to account for the changing environment of a kinetic study.
To overcome these barriers in SERS quantification, we report a method in which a colloidal suspension of SERS-active core (silver)–shell (gold) nanocubes (Ag@AuNCs) is used in conjunction with an internal standard (IS) for quantitative signal calibration. The enhancing properties of silver and the easy, scalable synthesis of highly structured, monodisperse silver nanoparticles offer an ideal SERS-active substrate. A thin gold film provides a protective coating over the silver core in order to maintain the large SERS enhancement despite harsh environments. The Ag@AuNC substrate was evaluated experimentally and computationally to quantify its SERS enhancement and its suitability for use in a kinetic assay.
In addition to the scaled-up synthesis of high quality SERS substrates, we introduced an internal standard – a reference molecule with high Raman activity that is bound to the substrate and whose SERS enhancement varies with time in the same manner as the target analyte. SERS spectra can be calibrated with respect to the spectral features of the IS, allowing the normalized intensity of analyte peaks to serve as proxy for the relative concentration of analyte to IS. There are several schemes for the use of IS, including core-molecule-shell nanoparticle (CMS NP) systems10–12 and simple surface adsorption systems. CMS NPs can be useful because the IS is protected from the surrounding environment, affording no opportunity for surface site replacement. However, the local dielectric environment of a shielded IS is not subject to exactly the same variations as that of the surface adsorbed analyte. The IS position inside the metallic substrate could result in diminished enhancement and their structure inhibits versatility – if a different IS molecule is desired, a new batch of CMS NPs must be synthesized. In contrast, surface-bound IS signal should correlate more closely with the analyte signal, and a single NP batch can be functionalized with any number of IS/analyte combinations. The potential for species desorption can be resolved by selecting an IS that covalently bonds to the surface. The IS/analyte co-functionalized Ag@AuNCs used as SERS probes in this work are capable of detailed quantitative analysis of reacting systems.
To demonstrate this quantitative analytical method, we report a kinetic study of the aldol condensation reaction of acetone and 4-(methylthio)benzaldehyde, using 4-nitrothiophenol as the IS; however, this is only a demonstration of platform capability. The method employed here can be easily modified for a quantitative examination of many reacting systems. Its highly sensitive nature allows probing of biological reactions and other highly dilute reactions. One must simply select a reactive species as the probe analyte, initiate a reaction by changing the probe media, and acquire spectral data over time. This simple, yet effective, method can yield a wealth of data and has good potential for practical applications.
2. Experimental and computational methods
Materials
1,5-Pentanediol 98% (PD) and 4-mercaptophenol 99% (MP) were purchased from Acros Organics. Silicone oil, polyvinylpyrrolidone avg. MW 55![[thin space (1/6-em)]](https://www.rsc.org/images/entities/char_2009.gif) 000 (PVP), gold(III) chloride trihydrate 99.9% (chloroauric acid), and 4-(methylthio)benzaldehyde 95% (MTBH) were purchased from Sigma-Aldrich. Silver nitrate 99.9995% and sodium hydroxide pellets 98% were purchased from Alfa Aesar. L-Ascorbic acid 99.9% was purchased from Fisher Chemical. 4-Nitrothiophenol 98% (NTP) was purchased from Oakwood Chemical.
000 (PVP), gold(III) chloride trihydrate 99.9% (chloroauric acid), and 4-(methylthio)benzaldehyde 95% (MTBH) were purchased from Sigma-Aldrich. Silver nitrate 99.9995% and sodium hydroxide pellets 98% were purchased from Alfa Aesar. L-Ascorbic acid 99.9% was purchased from Fisher Chemical. 4-Nitrothiophenol 98% (NTP) was purchased from Oakwood Chemical.
Silver–gold core–shell nanocube (Ag@AuNCs) SERS probe synthesis procedure
The silver nanocube synthesis procedure was based on the polyol method.13,14 Briefly, 20 mL of PD was heated with magnetic stirring in a silicone oil bath at 190 °C. When the PD reached approximately 130 °C, the reaction was initiated by injecting 250 μL silver nitrate solution (0.2 g, in 10 mL PD containing ∼0.02 mg CuCl2 seeding agent), immediately followed with 500 μL PVP solution (0.2 g, in 10 mL PD). Injections of 500 μL silver nitrate solution and 500 μL PVP solution were repeated every minute thereafter until the reactant solutions were consumed. The nanocube solution was washed repeatedly with 200 proof ethanol, purified by passing through a 0.22 μm filter, and suspended in a final volume of 50 mL ethanol.The gold coating procedure was adapted from the protocol of Yang et al.15 with few modifications. Briefly, 10 mL of AgNC solution were suspended into 10 mL ultrapure water and added to 1 L of PVP solution (1 mM, aqueous) under magnetic stirring, along with 250 mL ascorbic acid (10 mM, aqueous) and 50 mL NaOH (200 mM, aqueous). Next, a syringe pump (model NE-300, New Era Pump Systems, Inc.) was used to inject chloroauric acid (0.1 mM, aqueous) to the reaction mixture at a rate of 10 mL min−1. When 200 mL chloroauric acid had been added, injection was halted and the reaction was allowed to continue at room temperature for 10 minutes. The product, collected by centrifugation, was washed repeatedly with ultrapure water, filtered through a 0.22 μm filter, and stored in a final volume of 10 mL ethanol.
To make SERS probes from the nanoparticle substrate, the Ag@AuNCs were collected by centrifugation, suspended in an adsorbent solution containing the desired analytes, and incubated for more than 5 hours to ensure that the target molecules fully covered the NCs. The functionalized particles were then washed and suspended in clean solvent.
For the two-dye calibration experiments, the adsorbent solution was a mixture of NTP (20 mM, in ethanol) and MP (100 mM, in ethanol), blended in varying ratios, and the clean solvent was ultrapure water. To test the two-dye calibration's dependence on particle concentration, some of these samples were diluted with additional ultrapure water. For SERS enhancement factor quantification, the adsorbent solution was MP (160 mM, in ethanol) and the clean solvent was ethanol. For the aldol reaction experiments, a saturated ethanolic NTP solution was diluted 1![[thin space (1/6-em)]](https://www.rsc.org/images/entities/char_2009.gif) :
:![[thin space (1/6-em)]](https://www.rsc.org/images/entities/char_2009.gif) 1000 with ethanol; the adsorbent solution was an equal volume mixture of this NTP solution and pure MTBH, and the clean solvent was ethanol.
1000 with ethanol; the adsorbent solution was an equal volume mixture of this NTP solution and pure MTBH, and the clean solvent was ethanol.
Characterization of Ag@AuNCs
SEM images were obtained using a Quanta 600 FE-SEM (FEI Company, Hillsboro, OR) operated at 20 kV. This instrument was equipped with an Energy Dispersive X-ray spectroscopy (EDX) detector (Oxford Instruments, Abingdon, UK). TEM images were obtained with a Tecnai F20 FE-TEM (FEI Company) operated at 200 kV. EDX data was collected with this instrument using an EDX detector (Oxford Instruments) and an ultra-high resolution high-angle annular dark-field imaging (HAADF)- scanning transmission electron microscope (STEM) detector (Fischione Instruments Inc., Export, PA). UV/Vis spectra were acquired with a FLUOstar Omega UV/Vis spectrophotometer (BMG Labtech, Germany).Raman measurements were collected using a Thermo Scientific DXR Raman microscope (Thermo Fisher Scientific, Inc.) with 780 nm diode laser excitation, equipped with a Rayleigh rejection filter, a high resolution (∼2 cm−1) diffraction grating, and a CCD detector. Spectral intensity was acquired in the range of 300 cm−1–1874 cm−1. To measure, samples were loaded into a microwell plate (5 μL per sample), and the laser was focused just below the liquid surface by a 10× dark field objective. Each spectrum was acquired at 15 mW laser power with an integration time of 5 seconds and 4 accumulations.
Aldol condensation reaction
300 μL MTBH/NTP-coated Ag@AuNCs were concentrated to a volume of 200 μL and combined with 50 μL acetone. To initiate the reaction, freshly prepared NaOH (1 M, in ethanol) was added to reach desired catalyst concentrations. Aliquots from the colloidal reaction mixture were drawn at various time points and used to obtain Raman and UV/Vis spectra. The reaction mixture was kept in a sealed vial to prevent evaporative loss of reagents, and it was vortexed and sonicated immediately before each aliquot was withdrawn. To ensure that spectral observations were indicative of aldol condensation reactions, a control experiment was also performed wherein the acetone was replaced by an equal volume of ethanol.Spectral data analysis
To experimentally determine the SERS enhancement factor for MP, unprocessed bulk and SERS spectra were integrated in the 1559 cm−1–1622 cm−1 region to obtain peak areas. The ratio of average SERS peak area to average bulk peak area was used for the calculation. For all other experiments, spectral data were first pre-processed in the Raman Processing software16 implemented in MATLAB 2013b (MathWorks, Inc., Natick, MA). This pre-processing performed baseline subtraction, noise reduction, and spectral normalization.To obtain peak ratios for the co-functionalized MP/NTP Ag@AuNCs, the Peak Analyzer module in the OriginPro 9.1 software (OriginLab Corp., Northampton, MA) was used to fit Voigt peak profiles to the 1530 cm−1–1630 cm−1 region. Peak height and area ratios were calculated from these fitted peaks; NTP![[thin space (1/6-em)]](https://www.rsc.org/images/entities/char_2009.gif) :
:![[thin space (1/6-em)]](https://www.rsc.org/images/entities/char_2009.gif) MP surface composition was approximated as the NTP
MP surface composition was approximated as the NTP![[thin space (1/6-em)]](https://www.rsc.org/images/entities/char_2009.gif) :
:![[thin space (1/6-em)]](https://www.rsc.org/images/entities/char_2009.gif) MP molar ratio in the probe adsorbent. Linear least-squares regression was used in OriginPro 9.1 to fit a line to the peak ratio vs. molar ratio data.
MP molar ratio in the probe adsorbent. Linear least-squares regression was used in OriginPro 9.1 to fit a line to the peak ratio vs. molar ratio data.
For quantitative kinetic analysis of the aldol reaction, each SERS spectrum was pre-processed as described above. For comparison, each raw spectrum was separately processed omitting the normalization step. The peak intensity at 1618 cm−1 was recorded for each processed spectrum. The intensity at t = 0 (approximated as the average intensity during the control run) was subtracted from each subsequent time point. This yielded the time-dependent relative intensity shifts that were used to fit a kinetic model. The model was a system of ordinary differential equations that represented stepwise elementary reactions simplified from the known mechanism of the aldol condensation reaction. The parameters in this model included four rate constants and the initial concentration of adsorbed MTBH. A scaling parameter was also introduced to convert spectral intensity to the concentration of product formed. The model solution was generated in MATLAB 2015a by the stiff ODE solver ode23s, using guess parameters and known initial conditions as inputs. The nonlinear model fitting function fitnlm was used to find the combination of parameter values that fit the model output to spectral data.
Simulation of electric field near nanocube surfaces
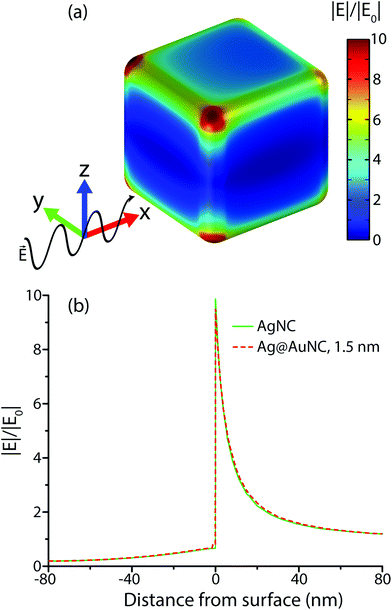
The electric field near a single nanocube was calculated by constructing a Finite Element Method (FEM) model in the COMSOL Multiphysics RF Module (AltaSim Technologies, Columbus, OH). The average geometric parameters of nanocubes observed through SEM and TEM imaging were model inputs, and the scattered electric field was the model output. The base model was a rounded cube of pure silver with edge length of 106 nm and with a 12 nm radius of curvature on edges and corners, surrounded by a sphere of solvent. The frequency-dependent bulk dielectric properties empirically determined by Johnson and Christy17 were used to define silver and gold materials, and the solvent was defined by its frequency-dependent refractive index.18,19 This model exhibits symmetry in the EM fields as well as the geometry, so the simulation space was truncated at the origin in the y and z planes, resulting in a quarter-sphere space. Excitation radiation was introduced as a monochromatic plane wave polarized along the z axis and traveling in the +x direction. The excitation wavelength was swept from 400 nm to 800 nm. To determine the effect of gold coating on the nanocubes, the simulation was repeated with a 1.5 nm layer of pure gold added to the cube surface.Vibrational characterization
DFT calculations were performed in the Gaussian 09 software20 in order to construct theoretical Raman spectra and assign vibrational modes to the spectra acquired during the aldol condensation reaction. Molecules involved in the condensation reaction were simulated, including NTP, MTBH, and 4-(4-methylthio)-3-buten-2-one. Detailed computational procedures and results can be found in the ESI.†3. Results and discussion
Synthesis of Ag@AuNC SERS probe
Highly monodisperse AgNCs, prepared by the polyol method,13 served as SERS substrates. In order to maintain the stability of the Raman sensors in harsh environments, the AgNCs were coated with a several atom thick layer of gold by adapting a published technique.15 For this sensing application, large-scale synthesis of high quality sensors was critical. The AgNCs synthesis reached mass production (∼100 mg); however, the published Au coating process was relatively small scale. We slightly modified the Au coating process (described in method section) to yield a larger batch of Ag@AuNCs (500 times scaled up). TEM and SEM images (Fig. 1) demonstrated that the Ag@AuNCs maintain a cubic shape after Au film coating.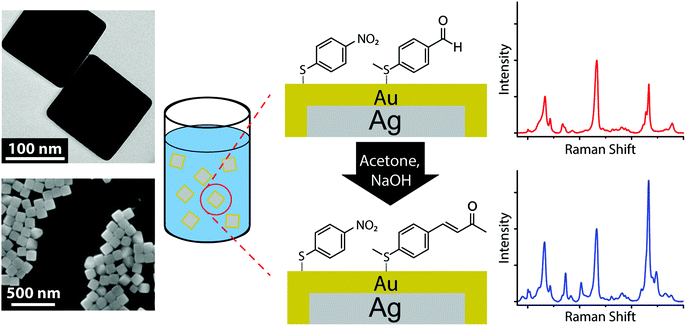 | ||
| Fig. 1 Schematic of the aldol condensation kinetic assay, with TEM and SEM images of the Ag@AuNC substrate. | ||
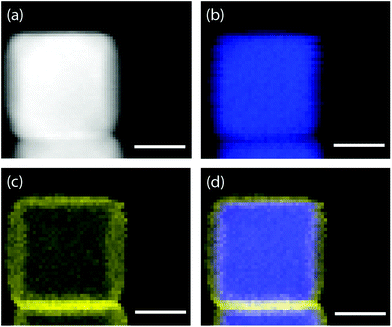
EDX was used to confirm the Au film. EDX maps acquired by HAADF-STEM clearly showed the localization of gold atoms on the surface of AgNCs (Fig. 2). Regions of the EDX spectral map (Fig. S2 & S3, ESI†) that had a large number of nanocubes displayed a strong signal for silver and weaker signals for gold and carbon. The carbon signal could be from PVP, the capping agent on the surface of Ag@AuNCs. To further demonstrate the presence of the Au film, Ag@AuNCs were sonicated in 10% aqueous HNO3 for 2 hours and observed through TEM. The morphology of most Ag@AuNCs was unaffected. This result showed that the AgNC surfaces were successfully coated with a continuous layer of Au, and that this Au film provided adequate resistance to degradation from a strongly oxidizing solution. This assured that the Ag@AuNCs could withstand the milder conditions of subsequent sensing experiments for long periods of time without reducing their effectiveness as SERS substrates.
SERS enhancement factor
The SERS enhancement factor, GSERS, represents the fundamental figure of merit for SERS detection systems. It is defined as the ratio of the signal intensity per molecule of a SERS sample to the intensity per molecule of a bulk sample (eqn (1)), | (1) |
G SERS was calculated experimentally for Ag@AuNCs by comparing the Raman intensity of the 1600 cm−1 peak for monolayer adsorbed MP with the intensity of an ethanolic MP solution. The excess unbound MP was removed from the SERS sample, so NSERS was calculated as the product of the nanocube concentration and the number of MP molecules on a single nanocube. Nanocube concentration was estimated assuming 100% yield on nanocube synthesis and modification. The number of molecules per nanocube was estimated assuming maximum packing and an adsorption footprint area of 26 Å2 for MP.21,22 These assumptions overestimate NSERS, which decreases the calculated value of GSERS. This in turn means that our calculated SERS enhancement of GSERS = 3.88 × 10⁴ is a conservative estimate.
Influence of Au film on SERS enhancement: simulation of electric field
To understand the influence of the Au film on the SERS enhancement factor, computational methods were employed to simulate the electric field environment of AgNCs and Ag@AuNCs. Because the protocols we adapted for Au coating were shown to deposit 3–6 atomic layers of gold, corresponding to a maximum Au film thickness of roughly 1.5 nm, this value was used for the Ag@AuNC simulation.Simulation results were used to calculate the single particle UV/Vis extinction cross section as a function of radiation frequency, allowing the construction of predicted extinction spectra (Fig. 3a). These calculated spectra predicted that the gold coating process should result in a redshift of the two main UV/Vis peaks as well as a change in their relative intensities. These calculated spectral shifts correlated closely with the experimentally obtained spectral shifts between the Ag@AuNC SERS probes and their AgNC precursors (Fig. 3b). This similarity demonstrated that the computational model reasonably approximated the electric field environment of a single nanocube. Differences between calculated and observed spectra likely came from particle polydispersity and the ensemble of randomly oriented particles.
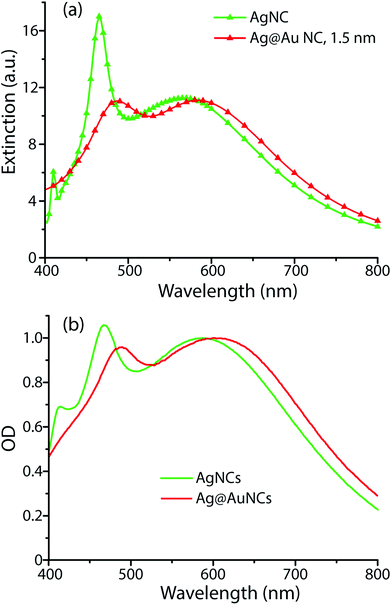 | ||
| Fig. 3 UV/Vis extinction spectra of AgNCs and Ag@AuNCs, determined (a) computationally and (b) experimentally. | ||
To a first approximation, the enhancement of Raman signal due to electromagnetic effects, EMGSERS, is related the magnitude of the electric field as shown in eqn (2),23
 | (2) |
The simulated electric field data at 780 nm excitation were used to calculate EMGSERS for AgNC and Ag@AuNC. The maximal value of the electric field amplification near a single cube was 9.86 for Ag and 9.70 for Ag@Au. This corresponds to EMGSERS,Ag = 0.95 × 10⁴ and EMGSERS,Ag@Au = 0.89 × 10⁴. The particle-averaged enhancement factor for the simulated Ag@AuNC was 470. This is lower than the experimentally determined value for our Ag@AuNCs, but it is important to note that single particle simulations ignore any contribution from SERS hot spots. In many cases, a large proportion of SERS signal intensity originates from these hot spots;24 therefore, it is likely that this computational enhancement factor underestimates the true value. This calculation also ignores SERS chemical enhancement, a phenomenon wherein the chemical bond with a metal surface increases the Raman cross section of some vibrational modes, which can further enhance SERS signal by a factor of ∼10–100.25 Chemical enhancement is a function of analyte geometry, surface composition, and the nature of the adsorption bond, and is difficult to independently quantify.26 The exclusion of these effects from the model are most likely responsible for the disparity between the experimental and simulated SERS enhancement factors for Ag@AuNCs. In summary, the comparable enhancements of Ag@AuNCs and AgNCs indicated that Ag@AuNCs are a more optimal SERS substrate because of their resistance to harsh environments.
Quantification through internal standard
Raman signal intensity is a linear function of the number of molecules sampled so, assuming constant excitation power and sampling volumes, intensity increases linearly with analyte concentration.27 However, particle sedimentation and aggregation can drastically change the local concentration of adsorbed analyte within the sampling volume. Nanoparticle clusters can also alter the SERS enhancement factor as decreasing interparticle distance generates more SERS hot spots. In addition, volatile solvents and reactants are subject to evaporative loss under Raman excitation lasers, which changes the analyte concentration of the entire sample. All of these phenomena can introduce artificial changes in spectral intensity over time. Without calibration, the experimenter can not necessarily discern whether spectral shifts should be attributed to chemical reactions or to these confounding phenomena.Our solution is to co-adsorb a nonreactive IS and use a characteristic spectral feature of that label species for spectral normalization. Spectral changes over time caused by changes in particle concentration or changes in SERS enhancement should be reflected equally in IS and analyte species. Calibrating spectral intensity with respect to an invariant IS peak can ensure that any changes over time are the result of reactions. This analytical technique relies on the assumption that the relative spectral intensity of both species varies linearly with the relative amount of the adsorbed species, a restatement of the general dependence of Raman intensity on concentration. It also depends on the assumption that the spectra of multiple adsorbed species respond identically to changes in enhancement factor. If these assumptions hold, then there is no need to determine the number of nanoparticles in any given sampling volume – all that is needed to track kinetics is to measure the spectral evolution over time with respect to the immutable peak of the IS.
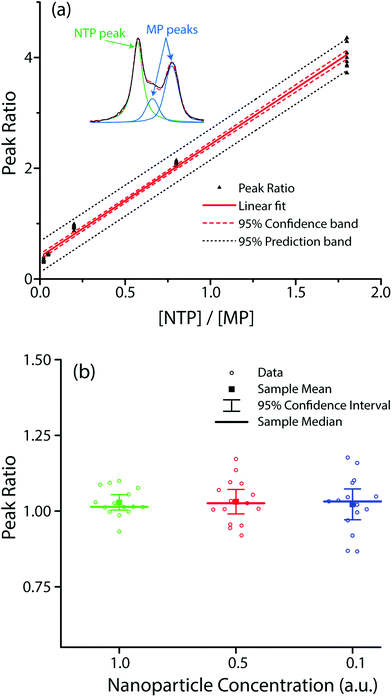
To verify these assumptions, we co-functionalized Ag@AuNCs with NTP and MP and performed SERS measurements while (1) varying the relative surface composition of the two analytes, and (2) varying the interparticle distance by particle dilution to alter the enhancement factor. Given the similarity in their chemical structures, we presumed that the relative surface composition of NTP and MP was approximately equal to their relative concentration in the adsorbent solution. Plotting the ratio of peak sizes against the ratio of adsorbate concentration [NTP]/[MP] yielded the expected linear trend (Fig. 5a). To alter the amount of hot spot sampling, and therefore GSERS, the particles were diluted to one half and one tenth of their original concentration. As the sample concentration decreased, the overall SERS intensity correspondingly diminished, resulting in weaker and noisier spectra. The resulting distributions of peak ratios for diluted and undiluted samples were compared. The results (Fig. 5b) showed no significant difference in mean value at the α = 0.01 level. While dilution did not significantly change the average peak ratio, it did increase the variance. Using the linear relation in Fig. 5a, a 95% confidence interval about the sample mean for undiluted cubes resulted in a [NTP]/[MP] prediction error of ±4.0% whereas the 95% confidence interval for half and tenth strength samples resulted in prediction errors of 6.4% and 8.2%, respectively.
Kinetic analysis of aldol condensation reaction
The IS co-adsorption method was used in conjunction with the Ag@AuNCs to quantitatively probe the reaction kinetics of the base-catalyzed crossed aldol condensation of surface adsorbed MTBH with free acetone. NTP was used as the IS. The aldol reaction mechanism was proposed by Nielsen and Houlihan.28 First, the acetone is activated by base to its reactive enolate form in an equilibrium reaction step. The enolate then undergoes nucleophilic addition, forming a new C–C bond with the electrophilic carbonyl group of MTBH to form an aldol intermediate, 4-hydroxy-4-(4-methylthiophenyl)-2-butanone. Finally, water is eliminated via the E1cb mechanism, forming the α,β-unsaturated ketone product, 4-(4-methylthiophenyl)-3-buten-2-one. This elimination product is stabilized by conjugation with the phenyl and carbonyl groups, and is the only product to form at high yield under the ambient conditions of this experiment.29 The mechanism is summarized in eqn (3)–(5), | (3) |
 | (4) |
 | (5) |
The kinetic model (eqn (6)) proposed by Koudelka for the self-condensation of butanal30 was modified to accommodate a crossed aldol reaction and to account for the additional dehydration step that forms the observed product in this reaction.31 [HB] was assumed to be constant in this model because it was the solvent and its fluctuations were small.
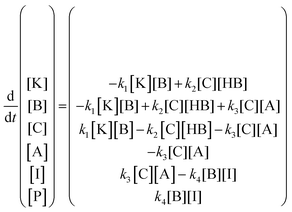 | (6) |
MTBH was chosen because, lacking α-hydrogens, it cannot be activated by NaOH to perform self-addition and because its –SCH3 group can bind to Ag@AuNC surfaces through thiol–gold interactions.32 Furthermore, its electrophilic aldehyde carbon is much more susceptible to nucleophilic attack than that of a ketone.28 This ensures that the acetone enolate will react with the cube-bound species preferentially; the side product formed by self-condensation of acetone should be minimal on the time scale of this experiment.33 There is the possibility that NaOH could activate the terminal carbon of the product, resulting in the linkage of two MTBH molecules by a single acetone molecule. However, the acetone concentration in this experiment exceeds the MTBH concentration by a factor of ∼106 so it is unlikely for unreacted MTBH to encounter the activated product molecule before reacting with an acetone enolate.
The aldol condensation reaction caused the extinction spectrum of the SERS probes to evolve with time (Fig. S8†). The OD increased and the main UV/Vis peak redshifted slightly with increasing reaction time, and a new feature appeared near 750 nm. These spectral alterations imply that the SERS enhancement factor for 780 nm excitation changes during the reaction.
The reaction also caused the Raman spectrum of the SERS probes to evolve with time (Fig. 6a). The main peaks at the reaction start were at 1081 cm−1 (NTP, MTBH, product, νCAryl–S), 1110 cm−1 (NTP, νCAryl–N), 1340 cm−1 (NTP, νsNO2), 1570 cm−1, and 1580 cm−1 (phenyl quadrant stretch for NTP and MTBH, respectively). A weak peak existed at 1695 cm−1 due to the MTBH νC![[double bond, length as m-dash]](https://www.rsc.org/images/entities/char_e001.gif) O vibration, and minor peaks from the ethanol solvent were also present at ∼1050 and 1420–1500 cm−1. Over the course of the reaction, notable features appeared at 1180, 1260, and 1618 cm−1. These correspond to the condensation product and can be assigned to the phenyl in-plane C–H bending, the H–C
O vibration, and minor peaks from the ethanol solvent were also present at ∼1050 and 1420–1500 cm−1. Over the course of the reaction, notable features appeared at 1180, 1260, and 1618 cm−1. These correspond to the condensation product and can be assigned to the phenyl in-plane C–H bending, the H–C![[double bond, length as m-dash]](https://www.rsc.org/images/entities/char_e001.gif) C–H rocking, and the νC
C–H rocking, and the νC![[double bond, length as m-dash]](https://www.rsc.org/images/entities/char_e001.gif) C stretching, respectively. The peak at 1580 cm−1 increased dramatically in intensity as the reaction progressed because the Raman activity of the phenyl quadrant stretch is much higher for the condensation product than for MTBH (Fig. S5, ESI†). Additionally, the aldehyde C
C stretching, respectively. The peak at 1580 cm−1 increased dramatically in intensity as the reaction progressed because the Raman activity of the phenyl quadrant stretch is much higher for the condensation product than for MTBH (Fig. S5, ESI†). Additionally, the aldehyde C![[double bond, length as m-dash]](https://www.rsc.org/images/entities/char_e001.gif) O stretch peak at 1695 cm−1 diminished over time and was undetectable by the reaction end.
O stretch peak at 1695 cm−1 diminished over time and was undetectable by the reaction end.
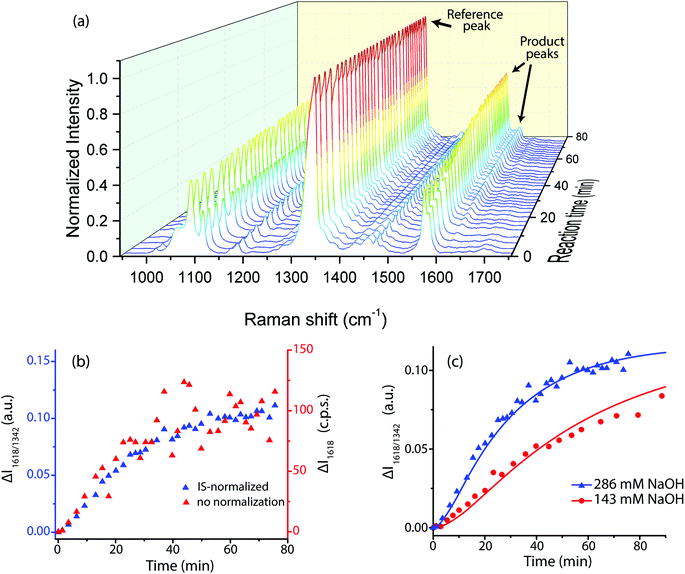 | ||
| Fig. 6 Results of the aldol condensation reaction between free acetone and adsorbed MTBH at room temperature, with adsorbed NTP present as the IS. Initial acetone concentration was 1.95 M. (a) 3D SERS spectrum showing time evolution during the reaction for the spectral range 950 cm−1 to 1750 cm−1. The initial NaOH concentration was 286 mM. (b) Intensity change over time of the 1618 cm−1 peak, comparing is-normalized data (blue) to non-normalized data (red) at the same experimental conditions as (a). (c) The fitted kinetic model for 1618 cm−1 peak, using the parameters in Table 1. | ||
The peak at 1618 cm−1 was used for quantification because it was distinct, appeared only in the final condensation product, and had sufficient signal to noise ratio. Plotting the IS-normalized intensities I1618/1340 and the non-normalized intensities I1618vs. reaction time clearly demonstrates that IS normalization greatly reduced the noise in the system (Fig. 6b). This effectiveness implies that a large component of the noise in this system comes from variable enhancement and variable analyte concentration within the sampling volume of the Raman laser. IS-normalized intensities were used in all subsequent analysis.
The fitted kinetic model predicted the values of the rate constants k1, k2, k3, and k4. Because the model is expressed in terms of concentration, an additional unit conversion parameter X was used to relate relative SERS intensity to relative sample concentration. NTP binds to Au surfaces with much greater strength than MTBH,32 so it was not reasonable to assume that the molar ratio MTBH![[thin space (1/6-em)]](https://www.rsc.org/images/entities/char_2009.gif) :
:![[thin space (1/6-em)]](https://www.rsc.org/images/entities/char_2009.gif) NTP on Au surfaces was equal to that in the bulk adsorbing solution. Therefore, the initial concentration of adsorbed MTBH, [A]0, was included as a model parameter. Parameter estimations, fitted to I1618/1340, are tabulated in Table 1, and the fit is plotted in Fig. 6c (see Fig. S9, ESI,† for alternate visualization).
NTP on Au surfaces was equal to that in the bulk adsorbing solution. Therefore, the initial concentration of adsorbed MTBH, [A]0, was included as a model parameter. Parameter estimations, fitted to I1618/1340, are tabulated in Table 1, and the fit is plotted in Fig. 6c (see Fig. S9, ESI,† for alternate visualization).
| Parameter | Fitted valuea | ref. 30 |
|---|---|---|
| a Error displayed is the standard error of the fitted parameter. | ||
| k 1 (M−1 min−1) | 4.796 ± 2.04 | 4.163 |
| k 2 (M−1 min−1) | 0.0060 ± 0.0036 | 0.0015 |
| k 3 (M−1 min−1) | 0.1197 ± 0.0036 | 4.686 |
| k 4 (M−1 min−1) | 129.206 ± 55.01 | N/A |
| [A]0 (μM) | 7.916 ± 0.220 | N/A |
| X (μM−1) | 0.0148 ± 0.0005 | N/A |
Based on estimated nanocube yields and dilution factors, the predicted value of [A]0 was physically realistic, corresponding to a surface monolayer composed of approximately 9.7% MTBH and 91.3% NTP by number. The values of the rate constants k1 and k2 were in reasonable agreement with the published values for the self-condensation of butanal.30 Our observed k3 was significantly lower than that for self-condensation of butanal; this could be explained by a lower reactivity for MTBH due to its resonance stabilization and its bulkier structure, or by the steric hindrance of the surface monolayer in our experiment.
4. Conclusions
In conclusion, we have achieved the large-scale synthesis of high quality Ag@AuNCs and characterized them for use in colloidal suspensions as a SERS substrate. The Ag@AuNCs demonstrated SERS enhancement and good stability in varied environments. The enhancement factor was calculated both experimentally and computationally. We demonstrated, by investigating the kinetics of an aldol condensation reaction at dilute reagent concentrations, that an internal standard can be co-functionalized on our substrate to yield a SERS probe capable of highly sensitive analyte quantification. This probe is versatile, enabling the use of many combinations of IS and analyte including combinations with different adsorption behaviors, provided both species can adsorb to probe surfaces. The IS correction adequately accounts for aggregation and other phenomena which affect the SERS enhancement factor, rendering this probe suitable for kinetic assays in diverse conditions, including reactions with highly dilute reagents and reactions in complex media or harsh environments. Furthermore, our analyte/IS functionalized Ag@AuNC probe has great potential in the biological and biomedical fields, and our current investigations center on extending their use for these applications.Acknowledgements
We acknowledge and thank Texas A&M High Performance Research Computing for resources used in DFT calculations and the Microscopy & Imaging Center at Texas A&M University for use of the FEI Technai G2 F20 FE-TEM and FEI Quanta 600 FE-SEM. The FE-SEM acquisition was supported in part by the National Science Foundation under Grant No. DBI-0116835.Notes and references
- G. McNay, D. Eustace, W. E. Smith, K. Faulds and D. Graham, Appl. Spectrosc., 2011, 65, 825–837 CrossRef CAS PubMed.
- B. Sharma, R. R. Frontiera, A.-I. Henry, E. Ringe and R. P. Van Duyne, Mater. Today, 2012, 15, 16–25 CrossRef CAS.
- P. L. Stiles, J. A. Dieringer, N. C. Shah and R. P. Van Duyne, Annu. Rev. Anal. Chem., 2008, 1, 601–626 CrossRef CAS PubMed.
- J. Hao, M.-J. Han, S. Han, X. Meng, T.-L. Su and Q. K. Wang, J. Environ. Sci., 2015, 36, 152–162 CrossRef PubMed.
- S. McAughtrie, K. Faulds and D. Graham, J. Photochem. Photobiol., C, 2014, 21, 40–53 CrossRef CAS.
- C. Muehlethaler, M. Leona and J. R. Lombardi, Anal. Chem., 2016, 88, 152–169 CrossRef PubMed.
- S. E. J. Bell and N. M. S. Sirimuthu, Chem. Soc. Rev., 2008, 37, 1012–1024 RSC.
- Y. Ou, L.-Y. Wang, L.-W. Zhu, L.-S. Wan and Z.-K. Xu, J. Phys. Chem. C, 2014, 118, 11478–11484 CAS.
- M. Fan, G. F. S. Andrade and A. G. Brolo, Anal. Chim. Acta, 2011, 693, 7–25 CrossRef CAS PubMed.
- W. Shen, X. Lin, C. Jiang, C. Li, H. Lin, J. Huang, S. Wang, G. Liu, X. Yan, Q. Zhong and B. Ren, Angew. Chem., Int. Ed., 2015, 54, 7308–7312 CrossRef CAS PubMed.
- L. Xia, N. H. Kim and K. Kim, J. Colloid Interface Sci., 2007, 306, 50–55 CrossRef CAS PubMed.
- Y. Zhou, R. Ding, P. Joshi and P. Zhang, Anal. Chim. Acta, 2015, 874, 49–53 CrossRef CAS PubMed.
- A. Tao, P. Sinsermsuksakul and P. Yang, Angew. Chem., Int. Ed., 2006, 45, 4597–4601 CrossRef CAS PubMed.
- H.-J. Wu, J. Henzie, W.-C. Lin, C. Rhodes, Z. Li, E. Sartorel, J. Thorner, P. Yang and J. T. Groves, Nat. Methods, 2012, 9, 1189–1191 CrossRef CAS PubMed.
- Y. Yang, J. Liu, Z.-W. Fu and D. Qin, J. Am. Chem. Soc., 2014, 136, 8153–8156 CrossRef CAS PubMed.
- L. A. Reisner, A. Cao and A. K. Pandya, Chemom. Intell. Lab. Syst., 2011, 105, 83–90 CrossRef CAS.
- P. B. Johnson and R. W. Christy, Phys. Rev. B: Condens. Matter, 1972, 6, 4370–4379 CrossRef CAS.
- M. Daimon and A. Masumura, Appl. Opt., 2007, 46, 3811–3820 CrossRef PubMed.
- J. Rheims, J. Köser and T. Wriedt, Meas. Sci. Technol., 1997, 8, 601 CrossRef CAS.
- M. J. Frisch, G. W. Trucks, H. B. Schlegel, G. E. Scuseria, M. A. Robb, J. R. Cheeseman, G. Scalmani, V. Barone, B. Mennucci, G. A. Petersson, H. Nakatsuji, M. Caricato, X. Li, H. P. Hratchian, A. F. Izmaylov, J. Bloino, G. Zheng, J. L. Sonnenberg, M. Hada, M. Ehara, K. Toyota, R. Fukuda, J. Hasegawa, M. Ishida, T. Nakajima, Y. Honda, O. Kitao, H. Nakai, T. Vreven, J. A. Montgomery Jr., J. E. Peralta, F. Ogliaro, M. J. Bearpark, J. Heyd, E. N. Brothers, K. N. Kudin, V. N. Staroverov, R. Kobayashi, J. Normand, K. Raghavachari, A. P. Rendell, J. C. Burant, S. S. Iyengar, J. Tomasi, M. Cossi, N. Rega, N. J. Millam, M. Klene, J. E. Knox, J. B. Cross, V. Bakken, C. Adamo, J. Jaramillo, R. Gomperts, R. E. Stratmann, O. Yazyev, A. J. Austin, R. Cammi, C. Pomelli, J. W. Ochterski, R. L. Martin, K. Morokuma, V. G. Zakrzewski, G. A. Voth, P. Salvador, J. J. Dannenberg, S. Dapprich, A. D. Daniels, Ö. Farkas, J. B. Foresman, J. V. Ortiz, J. Cioslowski and D. J. Fox, Gaussian 09, Revision D.01, Gaussian, Inc., Wallingford, CT, 2009 Search PubMed.
- G. Z. Liu, L. Y. Ou Yang, C. H. Shue, H. I. Ma, S. L. Yau and S. H. Chen, Surf. Sci., 2007, 601, 247–254 CrossRef CAS.
- J. Zhang, Q. Chi, J. U. Nielsen, E. P. Friis, J. E. T. Andersen and J. Ulstrup, Langmuir, 2000, 16, 7229–7237 CrossRef CAS.
- E. C. Le Ru, M. Meyer, E. Blackie and P. G. Etchegoin, J. Raman Spectrosc., 2008, 39, 1127–1134 CrossRef CAS.
- E. C. Le Ru, P. G. Etchegoin and M. Meyer, J. Chem. Phys., 2006, 125, 204701 CrossRef CAS PubMed.
- P. Kambhampati, C. M. Child, M. C. Foster and A. Campion, J. Chem. Phys., 1998, 108, 5013–5026 CrossRef CAS.
- A. Campion and P. Kambhampati, Chem. Soc. Rev., 1998, 27, 241–250 RSC.
- E. C. Le Ru, E. Blackie, M. Meyer and P. G. Etchegoin, J. Phys. Chem. C, 2007, 111, 13794–13803 CAS.
- A. T. Nielsen and W. J. Houlihan, in Organic Reactions, John Wiley & Sons, Inc., 2004, DOI:10.1002/0471264180.or016.01.
- C. K. Ingold, Structure and mechanism in organic chemistry, Cornell University Press, Ithaca, NY, 1953 Search PubMed.
- L. Koudelka, Chem. Pap., 1984, 38, 637–647 CAS.
- R. Bruckner, in Advanced Organic Chemistry, Academic Press, San Diego, 2002, pp. 129–167, DOI:10.1016/B978-012138110-3/50007-6.
- D. J. Lavrich, S. M. Wetterer, S. L. Bernasek and G. Scoles, J. Phys. Chem. B, 1998, 102, 3456–3465 CrossRef CAS.
- J. P. Guthrie, Can. J. Chem., 1978, 56, 962–973 CrossRef CAS.
Footnote |
| † Electronic supplementary information (ESI) available. See DOI: 10.1039/c6an01098a |
| This journal is © The Royal Society of Chemistry 2016 |

