 Open Access Article
A library-screening approach for developing a fluorescence sensing array for the detection of metal ions†
David G.
Smith
a,
Naveed
Sajid
ab,
Simone
Rehn
a,
Ramya
Chandramohan
a,
Isaac J.
Carney
a,
Misbahul A.
Khan
b and
Elizabeth J.
New
*a
aSchool of Chemistry, The University of Sydney, NSW 2006, Australia. E-mail: elizabeth.new@sydney.edu.au
bDepartment of Chemistry, The Islamia University of Bahawalpur, Bahawalpur, Pakistan
First published on 13th June 2016
Abstract
Detection of individual metal ions is of importance across a range of fields of chemistry including environmental monitoring, and health and disease. Fluorescence is a highly sensitive technique and small fluorescent molecules are widely used for the detection and quantification of metal ions in various applications. Achieving specificity for a single metal from a single sensor is always a challenge. An alternative to selective sensing is the use of a number of non-specific sensors, in an array, which together respond in a unique pattern to each analyte. Here we show that screening a library of compounds can give a small sensor set that can be used to identify a range of metal ions following PCA and LDA. We explore a method for screening the initial compounds to identify the best performing sensors. We then present our method for reducing the size of the sensor array, resulting in a four-membered system, which is capable of identifying nine distinct metal ion species in lake water.
Introduction
The development of analytical tools to identify and quantify metal ions in complex fluids is of interest to many, from environmental scientists to forensic investigators to biological researchers. For the biologically-essential metal ions (typically first row transition metals such as iron, copper and zinc), visualisation of localisation, oxidation state and the coordination environment will enable the uncovering of novel biological roles, and understanding of the cause and effect of metal dysregulation in disease.1,2 For toxic metal ions (of which mercury and lead are quintessential examples), tools are required to reveal modes of biological uptake, toxicity and excretion, while monitoring the levels of toxic metals in the environment is also essential.3–5Fluorescence sensing offers the sensitivity required for such studies.2 The development of fluorescent sensors (or probes) can be coupled to a variety of fluorescence detection systems that best suit the research question, from confocal microscopes6 to fluorescent plate readers,7,8 or even mobile phone cameras.9 To date, the majority of investigations aiming to develop fluorescent tools for the study of metal ions have focussed on selective fluorescent sensors, with each probe designed to be highly selective and specific for an individual analyte.10,11 However, many such studies fail to screen all possible interferents, whether other metal ions, proteins, or competing ligands. For the study of metal ions in complex solutions in which spatial resolution is not required (such as samples from environmental waterways, or blood serum), fluorescence sensing arrays are proving to be valuable.12 Such systems involve the use of multiple fluorescent sensors which are cross-reactive with a set of analytes. Rather than a selective response to a single analyte, the set of probes gives a characteristic “fingerprint” response to each analyte.13 To this end, a number of fluorescence sensing arrays have been reported that are capable of distinguishing various combinations of metal ions.14–24
The design of sensors both for selective probes and in arrays typically involves the rational design of each candidate or of a small set of molecules.25 This is in stark contrast to medicinal chemistry approaches, in which large libraries of molecules are developed, and screened for their suitability. Such an approach can be valuable in enabling the discovery of unexpected metal–ligand interactions and selectivities, and novel fluorescence quenching or enhancing mechanisms. In this work, we aim to utilise a medicinal chemistry approach to the generation of a novel fluorescent metal sensing array, by developing a systematic method for rapidly screening a large set of potential sensors, and sequentially reducing the library to a smaller subset of probes with the greatest discriminating ability.
Thiophene and its analogues have long been studied for their diverse biological activities.26 While their intense colours have been extensively utilised in the dye industry,27 little work has been performed to study the fluorescence behaviour of thiophenes. Because of their synthetic accessibility, a number of studies have reported the preparation and biological screening of libraries of thiophene derivatives.28 Having noted the suitable photophysical characteristics of these thiophenes, and the presence of many suitable ligand groups, we decided to investigate the potential use of thiophenes as fluorescent sensors for metal ions. In this paper, we report our investigation of a library of 55 thiophene derivatives, and the methodology that we developed to reduce this library to a set of four probes that is capable of discriminating nine biological and toxic metal ions.
Results and discussion
Creation of the thiophene library
The initial motivation for the synthesis of the thiophene library was not to create a set of metal responsive fluorescent sensors, but as part of studies towards developing potential antimicrobial agents. When looking at the set of structures obtained, it was clear that the molecules contained oxygen-, nitrogen- and sulfur-containing groups characteristic of good metal ligands. Given the large degree of diversity across our library, the molecules therefore represent ideal candidates to put forward into array based screening. While we expected that some library members could exhibit a selective response to a single metal ion, it was more probable that members would show differential responses to a range of metal ion species and therefore not show selectivity for a single metal. However, it was more likely still that a molecule would exhibit no response to any metal. Those in the latter category of non-responsive compounds could be quickly discarded leaving those which show the greatest potential, which could then be selected for further investigation and screening. Sensing arrays are highly useful in this situation, in providing a rapid and efficient method to investigate this large library.Fig. 1 illustrates the generic structure of the Thiophene Array Probes 1 to 55 (TAP-1 to 55), with further details provided in the ESI (Fig. S1†). The probes were either simple substituted 2-aminothiophenes (Fig. 1a) or fused thiophene-pyrimidine derivatives (Fig. 1b). The fifty-five thiophene-containing molecules were taken forward into the screening stage.
 | ||
| Fig. 1 Generic structures of the thiophene probes used in this report, based on (a) 2-aminothiophenes or (b) fused thiophene-pyrimidines. The full structures of all 55 probes are given in the ESI.† | ||
Initial screening: identification of potential sensors from the complete thiophene library
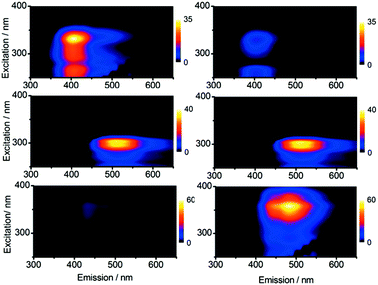
The fifty-five probes, TAP-1 to 55 (Fig. S2†) were screened against nine metal ions. The metal ions were chosen to represent both the most abundant biologically relevant (Cu(I), Cu(II), Fe(II), Ni(II) and Zn(II)) and highly toxic (Al(III), Cd(II), Cr(VI) and Hg(II)) species. Importantly, this set of analytes contains pairs or groupings of metal ions that are typically difficult to distinguish from one another, such as Cd(II) and Zn(II), variations in the oxidation state of the same metals (Cu(I) and Cu(II)), and a combination of both soft (e.g. Hg(II)) and hard (e.g. Cd(VI)) species.Briefly, the experimental setup for the initial screen was prepared as follows (further details including metal salts used, concentrations of thiophene and cations, and solvents, are given in the ESI†): black 96-well plates were used, with each row containing a single TAP, and each column containing a particular metal ion species such that each individual well contained a unique probe/metal combination. Twenty-four sets of fluorescence emission spectra were recorded for each well, using excitation wavelengths stepped every 10 nm over the range 230–460 nm. This enabled construction of excitation–emission matrices or contour plots, allowing a complete visual representation of the fluorescence output. From these plots, it was relatively straightforward to recognise changes in excitation or emission wavelengths upon addition of metal ions, by observing shifts in the peak maxima. Intensity changes could also be observed by comparison of relative colour intensity. Examples of three metal–probe combinations from this initial screen are shown in Fig. 2. This method was useful in identifying where changes in the fluorescence output have occurred upon metal binding. For example, the addition of Fe(II) to TAP-14 causes an increase in the emission intensity, addition of Ni(II) to TAP-6 results in no change in the fluorescence emission, and addition of Zn(II) to TAP-36 causes a shift in the excitation/emission maxima along with a significant increase in intensity.
A number of probes showed no response to any of the metals tested, whilst the remainder showed a response to one or more metals. It is of note that, of the fifty-five probes tested, only a few probes exhibited selectivity for a single metal ion, confirming the utility of these thiophene probes in array-based applications rather than for selective sensing.
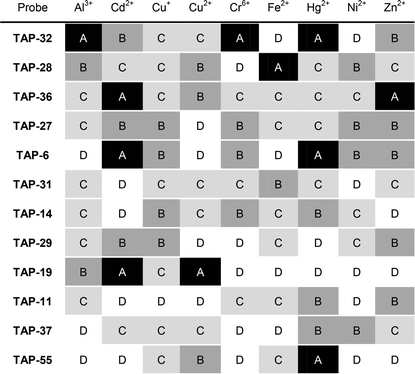
For the 495 metal–probe combinations, the data was compared and recorded in tabular form (Table 1 and S2†), using four categories to define the observed changes. Our first category, A was assigned to instances where changes in the excitation/emission maxima occurred, with or without an accompanying change in emission intensity, i.e. a ratiometric change. Category B corresponds to a large change in intensity, where the intensity at least doubles, or in the case of quenching gives fluorescence intensities of less than 25% of the original value, again without change in excitation or emission wavelengths. Category C includes those probes which show a relatively small change in fluorescence intensity, defined as intensity increases of 10–100%, or fluorescence quenching to 90–25% of the original value, without change in the emission or excitation wavelength maxima. Finally, category D included probes for which there were fluorescence differences of less than 10% – this category was considered to be “no change”, as we were less interested in relatively small subtle changes, and additionally this eliminates the possibility that any small pipetting errors might lead to a probe being wrongly taken for further investigation.
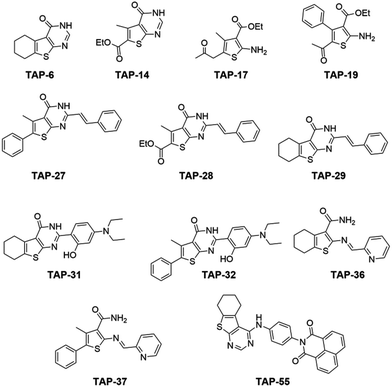
The information obtained from this initial screening was used to significantly reduce the number of probes that would be taken forward for more in-depth screening. To perform the reduction, the categorisation (A, B, C or D) for each probe–metal pairing was used to rank the probes in the order of apparent usefulness. A change in the excitation/emission maxima or ratiometric change was considered to be most valuable as it is easier to observe and also gives at least two points of interest to include in statistical analysis, so this was given the greatest weighting. A large change in intensity is more valuable than a small change in intensity, and these were weighted accordingly. To give higher priority to probes which show a differing response with multiple metal ion species, a further additional weighting was given to probes which showed changes for several metals. Following this procedure, each probe was associated with an overall score, which enabled ranking of probes (Table S4†). From this ranking, the top twelve probes (Fig. 3) were taken forward for more detailed analysis. It is important to note that, at this stage, the weighting criteria were somewhat arbitrary, and we could have used a differing set of criteria to score the probes, leading to a slightly different subset of probes appearing in the top twelve.
The array: screening the chosen twelve compounds to create the final, small set of sensors
Each of the twelve selected probes was screened against the original set of nine metals, using five replicates for each combination. For this experiment, selected excitation/emission points were taken rather than the full matrix emission scans. This greatly reduced the time taken to obtain the data, and would facilitate high-throughput screening in the future. The selected excitation/emission points (Table S3†) were chosen based on the most significant features identified in the previous round of screening, focussing on wavelengths at which the greatest changes were observed for each of the probes.The resulting output from this array gives a large amount of data. Visual examination of this data (Table S5†) clearly shows that differences occur throughout the data and the probes are responding to the series of metals in unique ways. It can also be seen that some probes show similarity to another probe. However, the quantity of data is too vast to readily interpret by simple methods. It is necessary to employ statistical methods such as Principal Component Analysis (PCA) and Linear Discriminant Analysis (LDA) to enable reduction of this high dimensionality dataset to a lower number of dimensions.29 This can then be subsequently converted to a form that enables a more facile interpretation of the data; in this case, the identification of the samples.
Principal Component Analysis (PCA) can be used to reduce the number of dimensions contained within the original data to a small number of dimensions, in which patterns can be identified. Whilst in theory, reduction to any reasonably low number of variables is useful, if the data can be reduced to just two or three variables it can be visualised as a 2- or 3-dimensional plot. PCA also provides information on the relative importance of each variable, allowing the least important variables to be omitted in subsequent iterations, leading to a final array consisting of a reduced number of sensor elements, with minimal loss in efficiency. An array consisting of fewer sensors is advantageous as there will be less synthetic expenditure, and the array will take less operating time to set up and less instrument time to run. There are limited examples in the literature for explicit methods of reducing the size of an array,17 and no clearly defined instructions or methodology of doing so.
In this work, PCA was used in combination with Linear Discriminant Analysis (LDA) to reduce the number of sensors. While PCA gives useful information on which sensors may be removed, LDA can be used to assess the effect of removing a sensor by analysing the degree of correct classification of replicates through the jack-knife procedure. This iterative process was repeated until we had identified the smallest set of sensors that still maintained high discrimination. The leave-one-out or jack-knife procedure iteratively leaves one probe out, calculates the LDA using all the other probes in the analysis and then sees if the left-out probe would be correctly classified on this basis.
PCA of the data derived from all twelve probes effectively reduced the data to three dimensions, which account for 77% of the original variance. Using all twelve probes in the analysis led to 100% correct classification by using the ‘leave-one-out’ jack-knife procedure through LDA. The PCA output at this stage indicated that three probes had a particularly low Measure of Sampling Adequacy (MSA), which is a numerical value between zero (low adequacy) and one (high adequacy) that can be used to describe how well suited a probe is for inclusion in the array and for analysis by PCA. A value less than 0.5 would be considered unsatisfactory, and such that inclusion in an array is unsuitable.30TAP-17 (0.482), 28 (0.414) and 31 (0.405), all exhibited low MSA values, and were therefore excluded from subsequent iterations. LD analysis on the remaining nine probes indicated a 98% correct classification, which was deemed as being acceptable. The incorrect classification corresponded to one Cu(II) measurement being misclassified as a Cr(VI). It is perhaps unrealistic to expect a 100% classification from a large array, we are hoping for a correct classification of around 95% or above. It is also important to look at which replicates are being misclassified, as this can guide the choice in sensor reduction, or indicate underlying issues if multiple incorrectly classified replicates all belonged to the same group.
In the next iteration, PCA indicated that TAP-32 now had a very low MSA (0.379), and so this probe was excluded. Correct classification by LDA dropped to 96%, with a blank misclassified as Ni(II), and now a Cr(VI) misclassified as Cu(II).
In the following round of PCA, no probes had significantly low MSA values, so we turned to other measures to identify the probes that could be excluded. The communality measurement explains the variance that an observed variable shares with all the other variables. TAP-19 had a communality of 0.427, and it was therefore predicted that exclusion of this probe should not have a significant effect on the output. Removing TAP-19 still gave a 96% correct classification, with the two errors now being a blank misclassified as Cu(II) and a Cr(VI) also misclassified as Cu(II).
In the next round, a third criterion was used for reduction of the number of sensors: the correlation coefficient, which identifies probes that respond in a similar manner to one another and therefore contribute little extra to the array. The correlation coefficient was found to be very high between TAP-36 and TAP-37, indicating that these two probes are contributing the same information to the array and so one can be removed with little effect on the overall output. The structures of TAP-36 and TAP-37 do indeed show a very high degree of similarity, with the proposed metal-binding ligand within the structures being identical. TAP-36 was retained in this array over TAP-37, as the former showed the higher intensity change of the two.
These four rounds of probe reduction gave rise to a six-component sensor array, which retained a 96% degree of correct classification by LDA. Subsequent PCA on this subset of six revealed that TAP-55 gave the lowest MSA (0.538), and its loadings onto the various principal components were also low, and it was therefore excluded. Again, LD analysis gave 96% correct classification, with two Cu(II) samples miscalculated as a Cr(VI) and a Ni(II).
This gave TAP-6, 14, 27, 29 and 36 as the five best performing sensors according to the screening and reduction process we employed. To assess whether we could further reduce the array at this stage, we analysed the five possible subsets consisting of four probes, by PCA and LDA. Of these five possible subsets, all resulted in a decreased success rate except the subset in which TAP-29 was omitted. This indicates that the remaining four probes are all essential contributors to the success of the array.
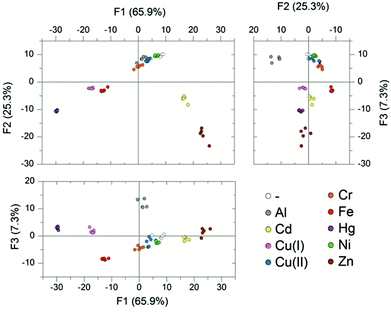
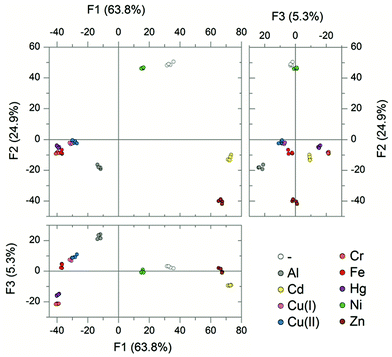
Attempting any further removal of any of these four probes resulted in a marked decrease in the success of the array. It was not possible to go below a four-membered array system. The final four sensor array consisting of TAP-6, 14, 27 and 36 was identified as being capable of differentiating nine metal species with a 96% correct classification (Fig. 4).
Using the four-membered array to identify metal ions in an environmental water sample
To assess the applicability of the selected four-membered array at detecting a range of metal ions in an environmental sample, a further experiment was performed using water obtained from a lake. This simulates what would be a likely application of such an array by detecting metal ions in environmentally polluted waterways, and evaluates the discrimination of the array in a more complex solution compared to the carefully controlled pH-buffered aqueous solution.The four probes were incubated with ten equivalents of the same nine metal ion species as the previous study. The media used in this experiment was water taken directly from a lake, with no treatments applied. Each probe was scanned at four wavelengths, corresponding to the maximum change for each of the four probes, giving a 16-dimensional dataset.
PCA of the resulting data showed that 94% of the variance could be explained by the three largest components. The resulting plots showed good separation between the groupings of the different metals. This suggests that the four probe array is powerful to discriminate metals, even when lake water is used instead of buffered HEPES solution. LDA was then applied to the same data and this showed 100% of the analytes were successfully classified as the correct metal species (Fig. 5).
The concentrations of metal ions used here are higher than those expected in all but extremely polluted samples. Nonetheless, this study demonstrates the utility of this methodology, where a large set of candidate molecules is reduced to a sub-set that is capable of perfectly distinguishing a large set of metal ion species. The library of molecules that formed the starting point of this particular work was not designed to act as fluorophores or metal chelators. Future work using this same approach with known fluorophores and metal chelators would likely lead to libraries and probe sub-sets exhibiting stronger fluorescence and higher binding affinities. This could lead to greatly improved arrays with vastly improved sensitivities.
Conclusions
We have demonstrated the power of array-based sensing methods by taking a library of thiophene-based structures that were initially designed as potential antimicrobial agents, and exemplifying a method that can be used to identify nine distinct metal ion species in an array. Initial high throughput screening against the suite of metals identified some of the best performing probes. A more detailed subsequent investigation of these top performers using principal component analysis and linear discriminant analysis led to a reduction in the size of the sensor-array, without impacting on the effectiveness. Four probes could successfully identify nine metals with 100% accuracy in lake-water samples.Our method shows how a medicinal chemistry screening approach could be used to explore analytical sensing. There are potential advantages to this approach compared with the iterative designs of selective sensors. The most promising applications would correspondingly be those in which a number of targets were being screened. Existing libraries of compounds can be screened or new libraries can be created quickly from simple combinatorial reactions. If desired, the resulting probes which show the most promise could be individually refined further, potentially resulting in improved sensitivities.
Acknowledgements
D. G. S. gratefully acknowledges a Henry Bertie and Florence Mabel Gritton Postdoctoral Fellowship from the University of Sydney. N. S. appreciatively acknowledges HEC Pakistan for providing an International Research Support Initiative Program (IRSIP) scholarship.Notes and references
- D. J. Hare, E. J. New, M. D. De Jonge and G. Mccoll, Chem. Soc. Rev., 2015, 44, 5941–5958 RSC.
- E. J. New, Dalton Trans., 2013, 42, 3210–3219 RSC.
- L. T. Bereza-Malcolm, G. Mann and A. E. Franks, ACS Synth. Biol., 2015, 4, 535–546 CrossRef CAS PubMed.
- M. Vázquez-González and C. Carrillo-Carrion, J. Biomed. Opt., 2014, 19, 101503 CrossRef PubMed.
- L. Cui, J. Wu and H. Ju, Biosens. Bioelectron., 2015, 63, 276–286 CrossRef CAS PubMed.
- M. Fernández-Suárez and A. Y. Ting, Nat. Rev. Mol. Cell Biol., 2008, 9, 929–943 CrossRef PubMed.
- B. Vilozny, A. Schiller, R. A. Wessling and B. Singaram, J. Mater. Chem., 2011, 21, 7589–7595 RSC.
- W. Xu, J. Bai, J. Peng, A. Samanta, Divyanshu and Y.-T. Chang, Chem. Commun., 2014, 50, 10398–10401 CAS.
- A. Hossain, J. Canning, S. Ast, P. J. Rutledge and A. Jamalipour, IEEE Sens. J., 2015, 15, 5095–5102 CrossRef.
- D. W. Domaille, E. L. Que and C. J. Chang, Nat. Chem. Biol., 2008, 4, 168–175 CrossRef CAS PubMed.
- K. P. Carter, A. M. Young and A. E. Palmer, Chem. Rev., 2014, 114, 4564–4601 CrossRef CAS PubMed.
- P. Anzenbacher, P. Lubal, P. Bucek, M. a. Palacios and M. E. Kozelkova, Chem. Soc. Rev., 2010, 39, 3954–3979 RSC.
- L. You, D. Zha and E. V. Anslyn, Chem. Rev., 2015, 115, 7840–7892 CrossRef CAS PubMed.
- L. H. Yuen, R. M. Franzini, S. S. Tan and E. T. Kool, J. Am. Chem. Soc., 2014, 136, 14576–14582 CrossRef CAS PubMed.
- W. Xu, C. Ren, C. L. Teoh, J. Peng, S. H. Gadre, H. W. Rhee, C. L. K. Lee and Y. T. Chang, Anal. Chem., 2014, 86, 8763–8769 CrossRef CAS PubMed.
- L. H. Yuen, R. M. Franzini, S. Wang, P. Crisalli, V. Singh, W. Jiang and E. T. Kool, Angew. Chem., Int. Ed., 2014, 53, 5361–5365 CrossRef CAS PubMed.
- M. A. Palacios, Z. Wang, V. A. Montes, G. V. Zyryanov and P. Anzenbacher, J. Am. Chem. Soc., 2008, 130, 10307–10314 CrossRef CAS PubMed.
- Z. Wang, M. A. Palacios and P. Anzenbacher, Anal. Chem., 2008, 80, 7451–7459 CrossRef CAS PubMed.
- L. Basabe-Desmonts, F. van der Baan, R. S. Zimmerman, D. N. Reinhoudt and M. Crego-Calama, Sensors, 2007, 7, 1731–1746 CrossRef CAS.
- T. Mayr, C. Igel, G. Liebsch, I. Klimant and O. S. Wolfbeis, Anal. Chem., 2003, 75, 4389–4396 CrossRef CAS PubMed.
- K. Severin, Curr. Opin. Chem. Biol., 2010, 14, 737–742 CrossRef CAS PubMed.
- J. W. J. S. Lee, J. W. J. S. Lee, M. Kang, A. I. Su and Y. T. Chang, Chem. – A Eur. J., 2006, 12, 5691–5696 CrossRef CAS PubMed.
- Y. Wu, Y. Tan, J. Wu, S. Chen, Y. Z. Chen, X. Zhou, Y. Jiang and C. Tan, ACS Appl. Mater. Interfaces, 2015, 7, 6882–6888 CAS.
- H. Kang, L. Lin, M. Rong and X. Chen, Talanta, 2014, 129, 296–302 CrossRef CAS PubMed.
- G. V. Zyryanov, M. A. Palacios and P. Anzenbacher, Angew. Chem., Int. Ed., 2007, 46, 7849–7852 CrossRef CAS PubMed.
- J. B. Sperry and D. L. Wright, Curr. Opin. Drug Discovery Dev., 2005, 8, 723–740 CAS.
- M. A. Weaver and L. Shuttleworth, Dyes Pigm., 1982, 3, 81–121 CrossRef CAS.
- N. Amanov, A. D. Dzhuraev, K. M. Karimkulov and A. G. Makhsumov, Pharm. Chem. J., 1993, 26, 882–884 CrossRef.
- S. Stewart, M. A. Ivy and E. V. Anslyn, Chem. Soc. Rev., 2014, 43, 70–84 RSC.
- H. F. Kaiser, Educ. Psychol. Meas., 1974, 34, 111–117 CrossRef.
Footnote |
| † Electronic supplementary information (ESI) available. See DOI: 10.1039/c6an00510a |
| This journal is © The Royal Society of Chemistry 2016 |

