 Open Access Article
Creative Commons Attribution 3.0 Unported Licence
Infrared and Raman screening of seized novel psychoactive substances: a large scale study of >200 samples†
L. E.
Jones
a,
A.
Stewart
a,
K. L.
Peters
b,
M.
McNaul
b,
S. J.
Speers
c,
N. C.
Fletcher
d and
S. E. J.
Bell
*a
aSchool of Chemistry, The Queen's University of Belfast, Belfast, UK BT9 5AG. E-mail: s.bell@qub.ac.uk
bThe Forensic Science Agency of Northern Ireland, 151 Belfast Road, Carrickfergus, UK BT38 8PL
cSchool of Veterinary and Life Sciences, Murdoch University, Western Australia, WA 6150, Australia
dDepartment of Chemistry, Lancaster University, Bailrigg, Lancaster, UK LA1 4YB
First published on 8th January 2016
Abstract
The potential of IR absorption and Raman spectroscopy for rapid identification of novel psychoactive substances (NPS) has been tested using a set of 221 unsorted seized samples suspected of containing NPS. Both IR and Raman spectra showed large variation between the different sub-classifications of NPS and smaller, but still distinguishable, differences between closely related compounds within the same class. In initial tests, screening the samples using spectral searching against a limited reference library allowed only 41% of the samples to be fully identified. The limiting factor in the identification was the large number of active compounds in the seized samples for which no reference vibrational data were available in the libraries rather than poor spectral quality. Therefore, when 33 of these compounds were independently identified by NMR and mass spectrometry and their spectra used to extend the libraries, the percentage of samples identified by IR and Raman screening alone increased to 76%, with only 7% of samples having no identifiable constituents. This study, which is the largest of its type ever carried out, therefore demonstrates that this approach of detecting non-matching samples and then identifying them using standard analytical methods has considerable potential in NPS screening since it allows rapid identification of the constituents of the majority of street quality samples. Only one complete feedback cycle was carried out in this study but there is clearly the potential to carry out continuous identification/updating when this system is used in operational settings.
Introduction
Novel Psychoactive Substances (NPS), often known in the media as “legal highs”, are a widespread and growing issue for police and forensic services. The number of substances reported to the European Monitoring Centre for Drugs and Drug Addiction (EMCDDA) has risen from 13 in 20081 to 101 in 2014.2 These substances can be marketed as “not for human consumption” or “research chemicals”3 from internet sellers or head shops and their composition is constantly changing in order to circumvent drug legislation. As with established drugs of abuse the negative health impacts associated with Novel Psychoactive Substances have brought them to the attention of the wider forensic community as well as public media. The number of fatalities in England and Wales where NPS were included in the death certificate increased from 29 in 2011 to 52 in 20124 and this figure is likely to rise as more new and untested compounds become available. The adverse health effects of NPS provide an additional incentive for developing rapid methods to identify NPS as a public health protection issue as well as a challenge to the criminal justice system.The ever changing nature of this illicit drug population is difficult to address using the established analytical tools, GC-MS and HPLC-MS, which are normally employed by forensic laboratories for identification and quantification of drugs of abuse.5,6 In part this is because the sample preparation steps used for GC-MS and HPLC-MS make them unsuitable for high throughput rapid screening although fast GC-MS has shown some promise.7 In addition, these methods work best when certified reference standards are available for comparison and for NPS such standards are often not available.
Here we have carried out a large study on a randomly selected set of seized samples which were obtained under conditions which mean they have the same composition and diversity as the general population of NPS available at street level. The main techniques used were attenuated total reflection infrared absorption (ATR-IR) and Raman spectroscopy, since both these techniques are non-destructive, fast and inexpensive whilst still giving data unique to each compound.8 Previous studies have shown that Raman spectroscopy is useful for the identification and analysis of “traditional” drugs of abuse, for example: ecstasy,9–14,17 amphetamines9,15,17 and cocaine,9,16,17 as well as pharmaceutical drugs.18–21 More recently small scale studies on Raman,22,23 and IR24,25 analysis of NPS have been published.
The aim of this paper is to establish if a strategy of using vibrational spectroscopy, supplemented by other identification methods as required, can provide an effective method of meeting the challenges set by NPS in real operational conditions. There are two separate problems: one is to increase sample throughput by decreasing analysis times, the second is how to make such a screening process work in an environment where previously unknown compounds are expected to appear frequently in the sample set. In the current study this will be addressed using a two stage approach. In the first stage the proportion of samples which can be identified using ATR-IR and Raman spectroscopy, combined with spectral library searching, will be determined. More importantly, the samples for which there are no reference spectra in the libraries will also be detected. As discussed above, it is inevitable that libraries will be incomplete since new variants are appearing much more quickly than the supply of certified standards. The second stage will then involve identification and characterisation of these unknown compounds using NMR and mass spectrometry. ATR-IR and Raman spectra of these samples will then be added into the spectral libraries and the screening process repeated using the extended reference data. This second screening step will give a better estimate of how effective the ATR-IR and Raman screening can be if the spectral libraries are continuously updated with data for previously unknown NPS as soon as they appear.
Experimental
IR spectra were recorded using a Bruker Alpha FT-IR spectrometer with ATR attachment operating in single bounce mode. Spectra were recorded using 24 scans in the 400–4000 cm−1 range with a resolution of 4 cm−1. Raman data were acquired with two systems; an Avalon Instruments RamanStation R2 equipped with a 785 nm diode laser (ca. 100 mW at sample). The spectrometer recorded spectra over the range of 100–3200 cm−1 with sampling resolution 2 cm−1, using an echelle spectrograph and an Andor Technology Ltd CCD cooled to −50 °C. 10–20 mg of each sample was placed onto aluminium foil covering a 24-well terraced plate and 4 spectra acquired for 10 s each in a 2 mm square grid pattern. A Perkin Elmer RamanMicro200, which uses a 300 mW (at source) 785 nm diode laser, 6 cm−1 resolution, was also utilised. Microscope data were collected using a 20× objective, which focuses the laser beam onto a 40 μm spot, at 40% laser power for 10 s, unless otherwise stated. A small spatula full (<10 mg) of each sample was deposited onto an aluminium covered glass slide. Powders and crystalline solids were analysed without preparation. Tablets were first analysed without preparation and then crushed with a mortar and pestle and/or their outer coating removed with a sharp blade. Raw spectra from all Raman and IR instruments were viewed and processed in GRAMS/AI v7.02 software and spectral searching was carried out in SpectralID, a sub-program of GRAMS. All samples were provided by Forensic Science Northern Ireland (FSNI).Proton NMR spectra were recorded on either a Bruker AVX300 (300 MHz) or an AVX400 (400 MHz) spectrometer as dilute solutions in deuterated chloroform (CDCl3) or deuterated dimethylsulfoxide (DMSO-d6). Chemical shifts were referenced to the residual protonated solvent (7.26 and 2.50 ppm, respectively). Carbon NMR spectra were recorded on either Bruker AVX300 (75 MHz) or AVX400 (100 MHz) instruments and chemical shifts were referenced to residual protonated solvent (77.0 ppm for CDCl3 and 39.5 ppm for DMSO-d6). When required, assignments for 1H and 13C NMR spectra were aided by two-dimensional NMR spectroscopy (COSY, HSQC). Mass spectra were recorded using a Waters GTC Premier Electron ionization (EI) time-of-flight spectrometer.
Results and discussion
A total of 221 samples were screened using IR and Raman spectroscopy. These samples, which were provided by Forensic Science Northern Ireland (FSNI), were obtained from uncompleted postal deliveries which on inspection by the carrier were found to contain materials which were either labelled as NPS or whose appearance suggested they were NPS. The only samples excluded from this study were those of herbal mixtures. This is because herbal mixtures contain a very low concentration of active ingredient (cannabinoid)26,27 and therefore screening of these materials will be the subject of a different study. For each of the 221 samples the IR spectrum was recorded and four Raman spectra taken at different positions within the sample. In general, the IR spectra were consistently high quality, whereas the quality of the Raman spectra (in particular the background fluorescence level) varied significantly between samples. However, since there were several processing options available for the Raman spectra the spectra of all samples were graded 1–4 according to both the quality of the raw data they provided and the level of processing that was required to make them suitable for spectral searching. Representative examples of each grade are shown in Fig. 1.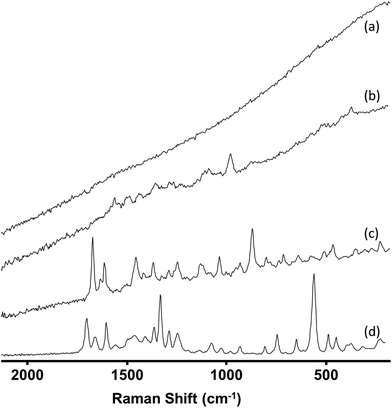 | ||
| Fig. 1 Typical Raman spectra of (a) Grade 4 sample (b) Grade 3 sample (c) Grade 2 sample (d) Grade 1. Spectra are vertically offset for clarity. | ||
Table 1 shows the criteria for each of the 4 grades used. The Raman spectra of more than 75% of samples were Grade 1 or 2 and so required little or no spectral processing. The Grade assigned to each sample was found to be the same for both Raman instruments used, since both used the same excitation wavelength and the difference in resolution was too small to give any noticeable difference in the spectra. Typically, when spectral quality fell to Grade 3 or 4 this was due to fluorescence. Although the IR spectra did not suffer from fluorescence problems, the presence of carbohydrates (e.g. microcrystalline cellulose, D-mannitol etc.) masked the peaks from the active ingredients as they all have a broad peak at approximately 1000 cm−1. Both carbohydrate and fluorescence interference were more commonly found for the tableted samples than the powders, in part because in the tablets the proportion of active drug is reduced by the excipient.
| Grade | Criteria |
|---|---|
| 1 | Spectra required no processing to give convincing matches |
| 2 | Spectra required simple baseline correction or spectral subtraction for spectral matches |
| 3 | Spectra required more advanced techniques such as averaging, smoothing etc. for spectral matches |
| 4 | No spectral information was available even after extensive processing |
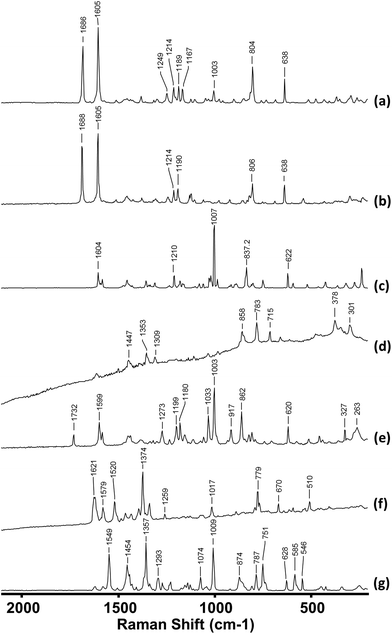
The compounds identified in the samples encompassed a range of the different sub-classifications of NPS, including, but not limited to, stimulant-like drugs (cathinones, amphetamines), synthetic cannabinoids and hallucinogens (tryptamines). Fig. 2 shows the Raman spectra of a small selection of the NPS studied. As would be expected, the spectra of the different drug types are very different from each other. Moreover, it is also possible to distinguish between even closely related compounds within each category. For example, mephedrone (4-methylmethcathinone, 4-MMC) and 4-ethylmethcathinone (4-MEC) differ only by a single methyl group and therefore their spectra (Fig. 3(a) and (b)) have many features in common. However, their spectra also show distinguishable characteristics for each compound; the Raman spectrum of 4-MMC displays a characteristic peak at 1167 cm−1 that is not present in 4-MEC.
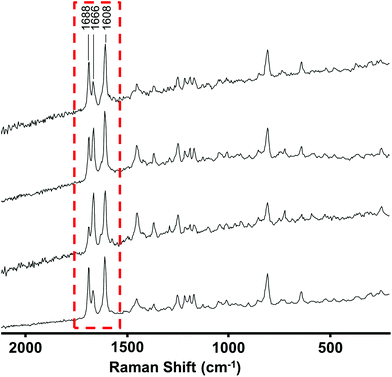 | ||
| Fig. 3 Raman spectra recorded at 4 different positions in a mixed sample showing point-to-point variation in relative signal intensities. Spectra are vertically offset for clarity. | ||
Since more than 75% of the samples gave good quality (Grade 1 or 2) spectra and each drug has a unique Raman spectrum it might be expected that at least 75% of the samples could be identified using Raman spectroscopy. In fact this is not the case for two reasons, firstly the Raman spectral library did not contain the spectra of some of the new drug compounds which were present in the seized sample set and secondly, some of the samples were clearly composed of a mixture of compounds. The first problem was addressed by first principles identification of unknown samples, which is described in more detail below. For the second problem, the first task was to identify which samples had mixed composition. This was achieved by recording four Raman spectra at different positions across the surface of each sample. A more detailed analysis of the experimental and statistical basis for selecting 4 spectra as being sufficient to identify mixtures in these types of samples will be published separately28 but in essence this was found to be the best compromise between recording numerous spectra of each sample and misclassifying mixtures as pure compounds.
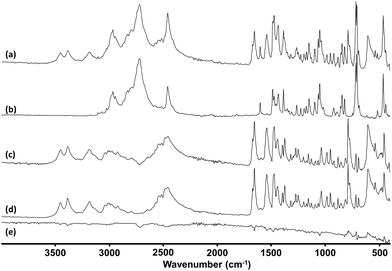
Since the mixtures were typically heterogeneous each of the spectra in a mixed sample contained different contributions from the components present which appeared as a variation of the relative peak heights at different points. An example of this effect is shown in Fig. 3, where there is clear variation in the relative peak heights in the 1600–1700 cm−1 range. This variation between the 4 spectra allowed the spectra of individual components to be extracted from the raw data. In the simplest cases, spectra recorded at some positions by chance showed only one of the components in the mixture. The spectra at these positions could be searched against the library in the normal way. In other cases, where no single point gave a pure spectrum, the library was searched and once the best match was found its spectrum was subtracted from the mixture, as shown in Fig. 4. The residual was then searched again to identify the second component etc.
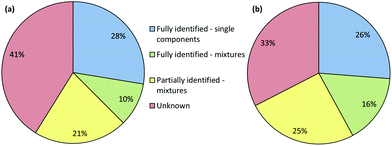
The results of the screening by both Raman and IR are illustrated in Fig. 5(a) and (b), respectively. In these Figures the samples were grouped into four classifications. These were: single components that have been identified, mixtures that have been fully identified, mixtures where only some of the compounds present have been identified and samples where no matches were found and are completely unknown.
It is clear that for this first pass a significant number of samples (41%) could not be identified using Raman spectroscopy and 21% were only partly identified. The results were similar for the IR data, although in this case the number of completely unidentified samples was lower at 33%. This was predominantly due to IR spectroscopy's superior ability to identify carbohydrate excipients, which meant that samples with high concentrations of these excipients were classified as being partially or fully identified mixtures rather than unknowns. However, pure samples of known drugs were typically identified with high confidence by both methods.
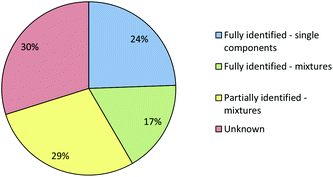
Combining the results from both approaches does improve the overall results which can be obtained, as shown in Fig. 6. However, the improvement is not dramatic, primarily because samples which were easy to identify with one technique were also easy for the other and vice versa. There were some examples where a sample which was unknown in one technique could be identified, or partially identified with the other but in general the overall effectiveness was similar to that of the most effective individual technique. However, this does not imply that combining IR and Raman screening is not useful, the fact that two independent methods both produce the same result gives an increased confidence that the identification is correct. This confidence is important in a forensic context, even for a screening method.
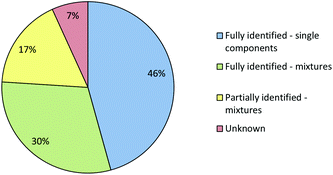
Fig. 6 shows that even using the combined IR and Raman screening method only 41% of samples could be fully identified and 30% of the samples could not be fully or even partially identified. In some cases a sample may not have matched a reference because it gave a poor quality spectrum. However, since >75% of the samples gave good quality (Grade 1 or 2) Raman spectra and all gave good quality IR spectra poor quality was not the major issue. In fact, the main reason that samples which were single compounds with low backgrounds, and therefore should have been easy to identify, were not matched in the library search was that their reference spectra were missing from the library. This is unsurprising, the appearance of previously unknown NPS in seized samples means that the set of NPS whose spectra are available in libraries inevitably lag behind the population of drugs in circulation. Within the current study we therefore included a procedure in which the samples which appeared to be single compounds but did match any library reference spectra were selected for characterisation using NMR and MS. When these samples had been confidently identified their reference spectra were then added to the Raman and IR libraries.
The primary method of characterising the structures was 1H NMR, along with 13C NMR and high resolution mass spectrometry. In some cases 2D NMR (COSY, HSQC) was used to allow all of the peaks to be assigned with confidence. The majority of the samples were in packaging that was labelled with a chemical structure and/or the common name of their supposed active ingredient. Although this is clearly not a reliable guide to the contents, it was found to be useful in many cases, so the first step of analysis involved comparing the proton spectrum to the literature spectrum of the named component, if one was available. In the few cases where no literature data could be found or the sample did not match its stated composition, the splitting patterns in the proton spectrum, as well as mass spectrometry fragmentation pattern, 13C NMR and 2D NMR were used as required to elucidate the structure.
33 structures were identified in this manner, the 1H-NMR of three examples are shown in Fig. 7. Fig. 8 shows the structures of these 33 compounds, the corresponding 1H-NMR data are given in the ESI.† The ESI† also lists the names of the NPS which were initially available in the spectral library which covered the more common variants such as mephedrone and MDMA. Following identification, the IR and Raman spectra of the 33 compounds were added to the spectral libraries as ‘non-standard’ reference spectra.
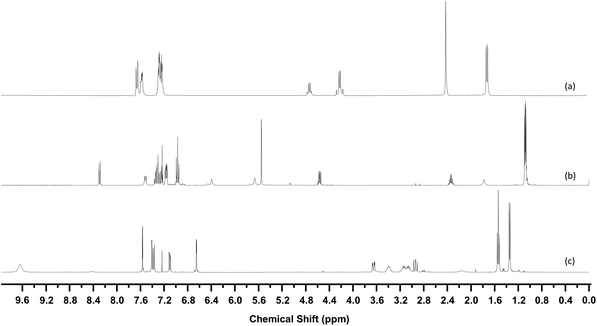 | ||
| Fig. 7 1H-NMR Spectra of (a) 4-methylbenzylcathinone (b) AB-FUBINACA (c) 5-EAPB. Spectra are vertically offset for clarity. | ||
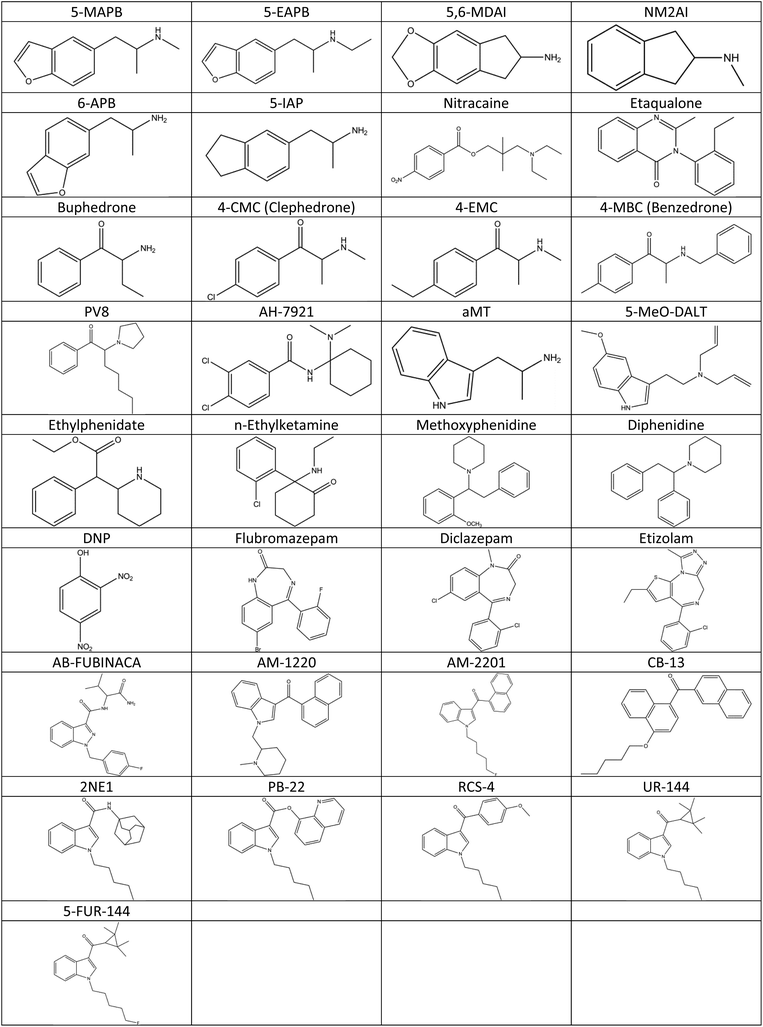 | ||
| Fig. 8 Names and chemical structures of the 33 compounds that were identified using NMR and mass spectrometry within the seized sample set. | ||
When the combined IR and Raman screening process was repeated using the extended spectral libraries the proportion of samples identified increased significantly. The results of this second screening process are shown in Fig. 9. Notably, the proportion of samples which could be fully identified on the basis of their IR and Raman spectra increased from 41% to 76%. Additionally, the proportion of samples where no components could be identified fell from 30% to 7%. Although the proportion of spectral hits is well below 100% it is still certainly high enough to mean that screening using this method will have a very significant effect on the average time required to characterise incoming casework samples, since approximately three quarters of all samples can be identified from spectra which are accumulated in less than one minute with no sample preparation. Subsequent data manipulation and library searching requires a few seconds for IR spectra and the better quality (Grade 1 & 2) Raman data. Even the data processing required for Grade 3 Raman spectra takes less than one minute. This rapid data acquisition and processing means that IR and Raman screening can dramatically increase sample throughput over chromatographic methods and also free up instrument capacity to address the small proportion of more challenging samples which require detailed examination.
Conclusions
This large study was sufficiently comprehensive to allow the potential of combined IR and Raman spectroscopy for screening suspected samples for NPS to be explored under realistic conditions. In particular, the sample set contained unsorted samples with street level composition, including compounds whose spectra were not initially available in the spectral libraries used in the screening process. Initial results appeared unpromising since a large proportion of the samples could not be identified in the first screening cycle. However, this was principally due to the incomplete state of the libraries rather than a problem with the spectroscopy. Independent identification of the compounds which did not match using a combination of NMR and MS allowed the sample library to be extended. With the extended library the screening approach allowed a much larger proportion of samples (76%) to be identified by IR/Raman screening alone.This study therefore suggests that although simple IR/Raman screening using fixed libraries will be problematic due to missing compounds, the more structured approach investigated here has significant potential. In this approach, the first pass screening allows known materials to be rapidly identified, while any non-matching samples are detected in the screening process and then taken for first principles identification, which then feeds back into the spectral libraries. In this study only one complete feedback cycle was carried out but there is clearly the potential in operational settings to carry out continuous identification/updating or implement a system of updating at regular intervals. This will give a rapid screening system in which the composition of the majority of samples are rapidly determined in the first pass and which continuously evolves to meet the challenges imposed by the frequent appearance of previously unreported NPS.
Acknowledgements
L.E.J. gratefully acknowledges funding from the Dept. of Justice (N.I.).References
- European Monitoring Centre for Drugs and Drug Addiction (EMCDDA), “EMCDDA–Europol 2008 Annual Report on the implementation of Council Decision 2005/387/JHA”, EMCDDA, 2009.
- European Monitoring Centre for Drugs and Drug Addiction (EMCDDA), “European Drug Report 2015. Trends and Developments”, EMCDDA, Luxembourg, 2015.
- H. R. Sumnall, M. Evans-Brown and J. McVeigh, Drug Test. Anal., 2011, 3, 515–523 CrossRef CAS PubMed.
- Office for National Statistics, “Deaths related to drug poisoning in England and Wales, 2012” Retrieved from: http://www.ons.gov.uk/ons/dcp171778_320841.pdf.
- H. M. Maher, T. Awad and R. C. Clark, Forensic Sci. Int., 2009, 188, 31–39 CrossRef CAS PubMed.
- M.-J. Wang, J.-T. Liu, H.-M. Chen, J.-J. Lin and C.-H. Lin, J. Chromatog., A, 2008, 1181, 131–136 CrossRef CAS PubMed.
- M. P. Elie, L. E. Elie and M. G. Baron, Drug Test. Anal., 2012, 5, 281–290 CrossRef PubMed.
- M. D. Hargreaves, in Infrared and Raman Spectroscopy in Forensic Science, ed. J. M. Chalmers, H. G. M. Edwards and M. D. Hargreaves, Wiley, West Sussex, 2013 Search PubMed.
- M. D. Hargreaves, K. Page, T. Munshi, R. Tomsett, G. Lynch and H. G. M. Edwards, J. Raman Spectrosc., 2008, 39, 873–880 CrossRef CAS.
- S. E. J. Bell, T. Burns, A. C. Dennis, L. J. Matchett and J. S. Speers, Analyst, 2000, 125, 1811–1815 RSC.
- S. E. J. Bell, R. J. Beattie, J. J. McGarvey, L. K. Peters, N. M. S. Sirimuthu and J. S. Speers, J. Raman Spectrosc., 2004, 35, 409–417 CrossRef CAS.
- S. E. J. Bell, T. D. Burns, A. C. Dennis and J. S. Speers, Analyst, 2000, 125, 541–544 RSC.
- S. E. J. Bell, L. J. Barrett, T. Burns, A. C. Dennis and J. S. Speers, Analyst, 2003, 128, 1331–1335 RSC.
- S. E. J. Bell, L. A. Fido, N. M. S. Sirimuthu, J. S. Speers, L. K. Peters and S. H. Cosbey, J. Forensic Sci., 2007, 52(5), 1063–1067 CrossRef CAS PubMed.
- R. G. Weston, J. Forensic Sci., 2010, 55(4), 1068–1075 CrossRef CAS PubMed.
- A. G. Ryder, G. M. O'Connor and T. J. Glynn, J. Raman Spectrosc., 2000, 31, 221–227 CrossRef CAS.
- M. J. West and M. J. Went, Drug Test. Anal., 2011, 3, 532–538 CrossRef CAS PubMed.
- U. Gala and H. Chauhan, Expert Opin. Drug Discovery, 2015, 10(2), 187–206 CrossRef CAS PubMed.
- B. Li, A. Calvet, Y. Casamayou-Boucau, C. Morris and A. G. Ryder, Anal. Chem., 2015, 87, 3419–3428 CrossRef CAS PubMed.
- S. Šašić, Pharm. Res., 2007, 24(1), 58–65 CrossRef PubMed.
- G. Fini, J. Raman Spectrosc., 2004, 35, 335–337 CrossRef CAS.
- R. Christie, E. Horan, J. Fox, C. O'Donnell, H. J. Byrne, S. McDermott, J. Power and P. Kavanagh, Drug Test. Anal., 2014, 6, 651–657 CrossRef CAS PubMed.
- S. P. Stewart, S. E. J. Bell, N. C. Fletcher, S. Bouazzaoui, Y. C. Ho, J. S. Speers and K. L. Peters, Anal. Chim. Acta, 2012, 711, 1–6 CrossRef CAS PubMed.
- K. Tsujikawa, T. Yamamuro, K. Kuwayama, T. Kanamori, Y. T. Iwata, K. Miyamoto, F. Kasuya and H. Inoue, Forensic Sci. Int., 2014, 242, 162–171 CrossRef CAS PubMed.
- N. Sondermann and K.-A. Kovar, Forensic Sci. Int., 1999, 106, 147–156 CrossRef CAS PubMed.
- L. Fattore and W. Fratta, Front. Behav. Neurosci., 2011, 5(60), 1–12 Search PubMed.
- K. G. Shanks, T. Dahn, G. Behonick and A. Terrell, J. Anal. Toxicol., 2012, 36, 360–371 CrossRef CAS PubMed.
- L. E. Jones, A. Stewart, K. L. Peters, M. McNaul, J. S. Speers and S. E. J. Bell, unpublished work.
Footnote |
| † Electronic supplementary information (ESI) available: 1H NMR spectra of the 33 identified compounds. See DOI: 10.1039/c5an02326b |
| This journal is © The Royal Society of Chemistry 2016 |

