
 Open Access Article
 This Open Access Article is licensed under a
 Creative Commons Attribution 3.0 Unported Licence
Biomarker detection technologies and future directions
Satish Balasaheb
Nimse
a,
Mukesh Digambar
Sonawane
a,
Keum-Soo
Song
b and
Taisun
Kim
*a
aInstitute for Applied Chemistry and Department of Chemistry, Hallym University, Chuncheon, 200-702, Korea. E-mail: tskim@hallym.ac.kr
bBiometrix Technology, Inc., 202 BioVenture Plaza, Chuncheon, 200-161, Korea
First published on 6th November 2015
Abstract
Biomarkers play a vital role in disease detection and treatment follow-up. It is important to note that diseases in the early stage are typically treated with the greatest probability of success. However, due to various technical difficulties in current technologies for the detection of biomarkers, the potential of biomarkers is not explored completely. Therefore, the developments of technologies, which can enable the accurate detection of prostate cancer at an early stage with simple, experimental protocols are highly inevitable. This critical review evaluates the current methods and technologies used in the detection of biomarkers. The aim of this article is to provide a comprehensive review covering the advantages and disadvantages of the biomarker detection methods. Future directions for the development of technologies to achieve highly selective and sensitive detection of biomarkers for point-of-care applications are also commented on.
 Satish Balasaheb Nimse | Satish Balasaheb Nimse earned a Bachelor of Pharmaceutical science from the University of Pune, Maharashtra, India and a Master of Medicinal Chemistry from Biju Pattanaik University Technology, Orissa, India. He joined the group of Prof. Taisun Kim in 2007 and received his PhD in 2011 from the Department of Chemistry, Hallym University, South Korea. Currently he is a faculty in the Department of Chemistry, Hallym University. His research interests include Medicinal Chemistry, Bioorganic chemistry, supramolecular chemistry, and applications of supramolecules for the fabrication of diagnostic DNA chips. |
 Mukesh Digambar Sonawane | Mukesh Digambar Sonawane completed his Bachelor of Pharmaceutical science from the University of Pune, Maharashtra, India and a Master of Technology (Pharmaceutical Sciences) from the National Institute of Pharmaceutical Education and Research, SAS Nagar, Punjab, India. He joined the group of Prof. Taisun Kim in 2013 in the Department of Chemistry, Hallym University, South Korea. His research interests include organic chemistry, medicinal Chemistry, and application of protein and DNA chips for various diagnostic applications. |
 Keum-Soo Song | Keum-Soo Song earned a Bachelor and a Master of Organic Chemistry and Biochemistry from Hallym University, South Korea. He joined the bio-venture company, Biometrix Technology, Inc. in 2000. He started to develop DNA chips based on molecular recognition of nine consecutive guanine bases (called 9G Technology). To date, his research records many peer-reviewed scientific publications, domestic and international patents. |
 Taisun Kim | Taisun Kim received his PhD from the Department of Chemistry and Biochemistry at the University of Texas at Austin. After a two-year postdoctoral fellowship at Texas A&M University, he joined the faculty at Hallym University in 1995. He founded the bioventure company, Biometrix Technology, Inc. in 2000, which is proficient in making 9G DNA Chips for research and diagnostic purposes. To date, his research records many peer-reviewed scientific publications and 23 domestic and international patents. |
1. Introduction
Biomarkers play a vital role in disease detection and treatment follow-up. The detection of the biomarkers in body fluids such as blood and urine is a powerful medical tool for early diagnosis and treatment of diseases.1 However, due to various technical difficulties in current technologies for the detection of biomarkers, the potential of biomarkers is not explored completely.2 The biomarkers are often present at very low concentrations mixed with various other proteins which makes it more difficult to identify them. In many cases detection of biomarkers at a very low concentration is difficult and time-consuming. It is important to note that the diseases in the early stage are typically treated with the greatest probability of success. Therefore, the early detection of biomarkers is very important in the case of cancer, cardiovascular disorders, and other pathological conditions.3,4There are a variety of bio-molecules which are used as biomarkers including antigens, DNA, mRNA, and enzymes.5 However, protein biomarkers are the most common type of biomarkers used in medical diagnostics. Therefore this article is focused on the use of antigens as biomarkers and their detection technologies. Biomarkers are present in tumour tissues, serum, and other body fluids. The ultimate goal of researchers in the field of biomarker detection is to develop a reliable, cost-effective, powerful detection tool for prognosis, diagnosis, and monitoring the recurrence of a particular disease. Furthermore, biomarkers can also be used for the follow-up of a treatment by monitoring the constant decrease in its concentration to a certain level. There has been huge progress in the field of biomarker detection technologies. Various biomarker detection methods based on highly specific recognition biomarkers have been developed. The enzyme-linked immunosorbent assay (ELISA),6,7 gel electrophoresis,8,9 surface plasmon resonance (SPR),10,11 Mass-sensing BioCD protein array,12 surface enhanced Raman spectroscopy (SERS),13,14 colorimetric assay,15,16 electrochemical assay,17,18 and fluorescence methods,19,20 are few of the biomarker detection methods. Many of these methods are based on the conventional immunoassays in which a capture antibody is functionalized on a solid support for target capture and a reporter antibody for assay read-out. These technologies suffer from a common drawback of nonspecific adsorption of non-target proteins onto the surface of a bio-sensor.21 Therefore, most of the current methods suffer from drawbacks such as the lack of accuracy, sensitivity, and specificity required for clinical diagnostic applications.
Considering the enormous number of antigens used for the diagnosis of various diseases and disorders it is impractical to review all of them. Furthermore, even though the antigens have different sizes, shapes, and stability profiles the technologies used for their detection are common. Therefore, in this article we have focused on the technologies and methods used for the detection of biomarkers for the diagnosis of prostate cancer (PCa).
It is evident from many observations that the recurrence rate of cancer is very high in patients after radical prostactomy.22 The PSA levels 4 ng mL−1 and lower are considered as normal. After radical prostactomy these levels drop much below 1 ng mL−1, however in recurring cancer the level of PSA starts to increase again. Therefore, for accurate diagnosis and treatment follow-up it is essential for a biomarker detection technology to allow the detection of a concerned biomarker at a very low concentration such as far below 100 pg mL−1.
The aim of this article is to provide a comprehensive review covering the advantages and disadvantages of the detection methods of PCa biomarkers. This article also elaborates the latest developments in achieving high selectivity and sensitivity for the detection of biomarkers which can be used in the early detection of the PCa biomarkers. The problems and solutions for the early detection of the PCa biomarkers is also discussed based on some of the recent examples from our own work and the reports found in the literature. It is hoped that this article will stimulate broader interests across various disciplines for the development of biomarker detection technologies.
2. Technologies used for the detection of biomarkers
The ultimate goal behind the use of biomarkers for diagnosis is to develop reliable and cost-effective powerful detection tools for early diagnosis of diseases and disorders. Therefore, by using biomarker detection technologies, physicians can choose precise and accurate therapy for their patients.23,24 Furthermore, it can help physicians to effectively monitor the disease progression, and recurrence.25There are several reports on the various biomarkers evaluated for their diagnostic and prognostic values in the PCa diagnosis. The biomarker genes evaluated for diagnosis of PCa includes the prostate cancer antigen 3 (PCA3) gene26,27 and the transmembrane protease serine 2 (TMPRSS2-ERG) gene.28 The biomarker proteins evaluated for the diagnosis of PCa include early prostate cancer antigen-2 (EPCA-2), human glandular kallikrein (hK2), cluster of differentiation 147 (CD 147), prostatic acid phosphatase (PAP), and prostate specific antigen (PSA), respectively. There are two types of PSA, a free PSA (fPSA) and total PSA (tPSA).29 The structures of few biomarker proteins are depicted in Fig. 1.
 | ||
| Fig. 1 Structures of the biomarker proteins (A) human glandular kallikrein, (B) cluster of differentiation 147, (C) prostatic acid phosphatase, (D) prostate specific antigen. | ||
PCA3 is considered as a PCa-specific gene, which is overexpressed in prostate tumours relative to non-malignant prostate tissue.30 PCA3 showed a very low diagnostic accuracy with the sensitivity and specificity of 58% and 72%, respectively.31 However, several studies have demonstrated that the simultaneous detection of PCA3 along with the PSA can improve the diagnostic accuracy in multivariable regression models.32,33 The involvement of the TMPRSS2 gene in PCa has been widely studied.34 In a clinical study of PCa patients, the test results showed 93% specificity with a 94% predictive value.35 However, during the same period some other studies found conflictive results about the prognostic value of the TMPRSS2 gene in fusion positive patients.36,37 Therefore, further studies to evaluate the diagnostic and prognostic values of the TMPRSS2 gene are required.
It is important to note that the genetic biomarkers such as DNA and RNA are essential when the genotypic information is required such as in the detection and discrimination of pathogens. Even though the genetic biomarkers have been perused for the detection of PCa, more importance has been given to the protein biomarkers. Furthermore, the DNA extraction and processing is considered as laborious and costly. On the contrary, proteins present in serum samples can be easily assessed by immunohistochemistry, which makes them easily applicable in routine diagnostics. Hence, technologies applied for the detection of protein biomarkers have been primarily explored in this article.
EPCA, a nuclear matrix protein was initially considered as a good candidate for PCa detection. However, the role of EPCA in the prostate adenocarcinoma and BPH reduces its prognostic value for PCa.38 It is reported that the hK2 and PSA are closely related serine proteases and they have 80% sequence homology.39 The concentration of hK2 in circulation is around 1–2% (<100 pg mL−1) to that of PSA.40 Unfortunately, the biomarker detection technology which can detect the concentrations below 100 pg mL−1 is not available. Hence, hk2 was not explored for its diagnostic and prognostic values in PCa. CD147, a membrane glycoprotein is overexpressed in solid tumours. Though it is related to PCa it has a poor prognostic value.41,42 The human PAP was the first serum biomarker used for the diagnosis of PCa. The preoperative PAP levels were used to evaluate the lymph node-positive disease and the development of metastasis. However, after the induction of PSA for the diagnosis of PCa, it was found that the PSA is superior to PAP in PCa screening, staging, and prognosis.43 In 1994, USFDA approved the use of PSA (defined upper limit 4 ng mL−1) as the diagnostic marker for PCa.44
The diagnosis of PCa has relied heavily on the use of PSA for over 20 years. However, due to the recent reports on the randomized PCa-screening trials45,46 and highly controversial recommendation against the PCa screening released by the United States Preventive Services Task Force (USPSTF) has highlighted the need for novel clinically useful biomarkers.47 In the recent review article on the PCa biomarkers in serum, urine, and tissue it is stated that none of the biomarkers can take the place of PSA.48 Furthermore, this review article also claims that no individual biomarker is ideal for diagnostic and prognostic values. Thus, discovery of novel biomarkers and their validation are needed. Therefore, the development of technologies, which can detect multiple biomarker proteins with high accuracy in terms of clinical sensitivity and specificity is highly inevitable. The multiplex detection of protein biomarkers promises a new, personalized approach to early detection and treatment follow-up in diseases like cancer.
There are several immunoassays used for the detection of biomarkers in serum and biological fluids. Antibodies bind non-covalently to the antigen epitopes through non-covalent interactions such as hydrogen bonds, electrostatic bonds, van der Waals forces, and hydrophobic interactions. These interactions are reversible and affect the strength of the binding between antibodies and antigens. In immunoassays, antibodies that bind directly to the specific antigen are called as primary antibodies (pABs). The secondary antibodies (sABs) can also bind to epitopes of the antigen other than those used for binding with the pAB. The sABs are useful in immunoassays because they are usually conjugated or labelled with enzymes and are used as detection antibodies to determine the extent of binding of antigen to pAB. Immunoassays can be highly sensitive and specific, depending on the binding specificity of the pABs and sABs to the antigens which are used as biomarkers. Therefore, the sensitivity and specificity of any immunoassay depends on the active conformation of the pAB and sAB. The slightest distortion in the active confirmations of the pAB or sAB shows adverse effects on the sensitivity and specificity of the immunoassay.49 Henceforth, the advantages and disadvantages of the various immunoassays are briefly discussed.
2.1 Two dimensional gel electrophoresis
Gel electrophoresis is usually used for separation of proteins based on their molecular weights.50 In 1975, O'Farrel used two unrelated properties of protein for its separation i.e. molar mass and the isoelectric point. The proteins can be separated from the sample by one dimensional (1D) gel electrophoresis or two dimensional (2D) gel electrophoresis based on the isoelectric point and molar mass of respective proteins.51,52 Keeping in mind the advantage of the fPSA/tPSA ratio for diagnosis of PCa, 2D gel electrophoresis was developed which could separate 15 different sub-forms of fPSA. It is known that the decrease in the fPSA/tPSA ratio is closely associated with the chances of increase in PCa. Using this technique the fPSA concentration is measurable up to 100 pg mL−1. The disadvantages of 2D gel electrophoresis are the requirement of a large amount of samples, small dynamic range of detection, and a tedious multistep protocol.53,54 The reproducibility of the results is also questionable and highly dependent on the quality of the buffer used.2.2 Enzyme-linked immunosorbent assay (ELISA)
ELISA typically employs antibodies that are raised in animals directed against specific biomarkers. As shown in Fig. 2 and 3, a specific epitope of antigens bind to the pABs immobilized on the solid surface. The enzyme linked sAB binds to the other epitopes to form a sandwich like complex. The binding of the antigen and pAB is detected using an activity of enzyme which changes the substrate into a coloured product. ELISAs are useful methods in detecting and quantifying biomarker proteins in serum and biological fluids.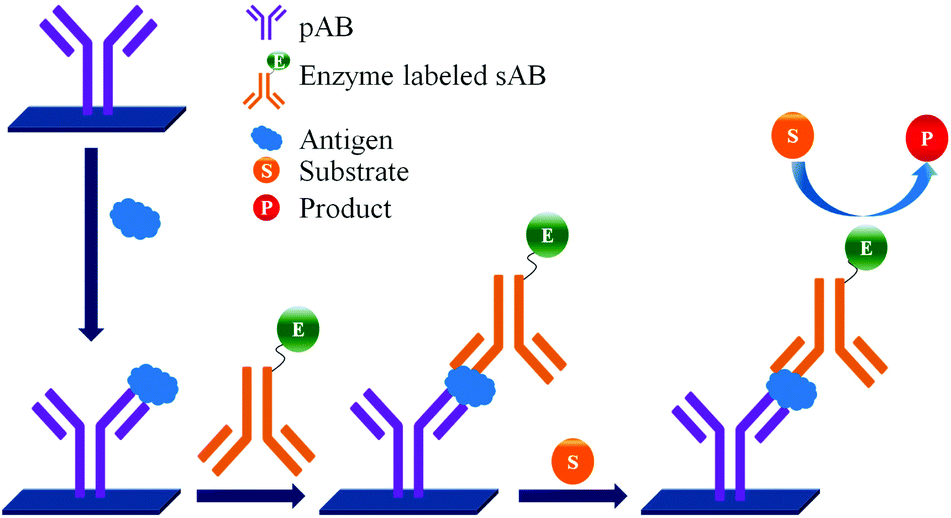 | ||
| Fig. 2 Detection of biomarkers by using ELISA. | ||
 | ||
| Fig. 3 PSA detection by ELISA (use of biotin-streptavidin). | ||
The intensity of the colour is directly proportional to the amount of enzyme linked antibody and so the amount of antigen bound to the immobilized pABs. The 100 pg mL−1 of PSA detection by using an ELISA assay has been reported.59 However, there are reports which elaborate the limitations of ELISA for the detection of biomarkers with concentrations as low as 1 pg mL−1.60
There are several enzyme–substrate pairs which have been effectively used in the ELISA assays as shown in Table 1. Even though various enzyme–substrate pairs have been used in the ELISA assays, the sensitivity of the assays is directly correlated to the highly sensitive and specific binding of the immobilized pAB, concerned antigen, and sAB.
| Enzyme | Substrate | Description | Ref. |
|---|---|---|---|
| PNPP: p-nitrophenyl phosphate disodium salt; NBT: nitro-blue tetrazolium chloride; BCIP: 5-bromo-4-chloro-3′-indolyphosphate p-toluidine salt; ABTS: 2,2′-azinobis-[3-ethylbenzothiazoline-6-sulfonicacid-diammonium salt; TMB: 3,3′,5,5′-tetramethylbenzidine; 5AS: 5-aminosalicylic acid; OPD: O-phenylenediamine. | |||
| Alkaline phosphatase | PNPP | PNPP substrate produces a linear response in paper based ELISA | 55 |
| Alkaline phosphatase | NBT | More sensitive colour generation when NBT/BCIP used in combination than BCIP alone | 56 |
| Horseradish peroxidase | ABTS | Colour development is slow (20 min) | 57 |
| More sensitive than 5AS and OPD | |||
| Horseradish peroxidase | TMB | Produce high background signal in samples containing high protein concentrations. | 58 |
Concerns over the binding capacity of sAB for antigen due to its direct conjugation with the large enzyme (Fig. 2) have led to the development of a new approach. Wherein, a streptavidin–biotin complex was used as a bridge between the enzyme and the sAB. Biotin is a small molecule, thus labelling of the sAB with the biotin does not show any significant change in the shape of sAB. Thus, sAB can retain its specificity for the antigen.61 As shown in Fig. 3 the streptavidin and biotin combination is commonly used in the ELISA assays for highly sensitive biomarker detection.62
The specificity of the ELISA based methods is a big concern because the specificity of the assay depends on the immobilization chemistry used to attach the pABs to the surface.63,64Table 2 lists a few methods used for immobilization of pABs. The disadvantages of covalent linkage include reduced activity of proteins, need of toxic reagents for immobilization, and complicated chemistry.65,66 As shown in Fig. 4, the main problem of direct immobilization of proteins on the surface is the loss of activity of pABs over a period of time leading to non-specific interactions.
 | ||
| Fig. 4 Direct immobilization of pABs on the solid support. | ||
| Immobilization methods | Advantages/disadvantages | Ref. |
|---|---|---|
| Hydrophobic interactions | Low binding capacities | 72 and 73 |
| Can bind with only large and hydrophobic molecules | ||
| Biomolecule denaturing effect | ||
| Small peptides are washed away during ELISA procedures | ||
| Ionic or covalent interaction (aminated polystyrene) | Lacks hydrophobic character and is strictly ionic in nature | 74 |
| Need to be used with bi-functional cross linking polymer | ||
| Need a stringent blocking agent for effective blocking of the aminated surface | ||
| Covalent interaction (N-oxysuccinimide) | Highly specific for their coupling partner | 75 and 76 |
| Makes very stable covalent bonding with the surface | ||
| Covalent interaction (maleimide) | Highly specific for their coupling partner | 77 |
| Can be used for small peptides | ||
| Covalent interaction (hydrazide) | Highly specific for their coupling partner | 78 |
| Forms hydrazine unstable Schiff's base, which needs further treatment |
2.3 Mass-sensing BioCD protein array
Absorbance based ELISA technique suffers from variations in the result with respect to the change in pH, buffer, and the presence of alkali.67 To overcome these drawbacks a novel technique called mass-sensing BioCD protein array was developed.68 As depicted in Fig. 5, the mass-sensing BioCD instrument converts the mass of a protein on SiO2/Si wafer into the reflectance variation via the local interferometry which finally calculates the protein concentration. The reported PSA detection limit using this method is 4 ng mL−1.69 A special instrument like a spinning disk has been used to decrease the background noise. | ||
| Fig. 5 PSA detection by mass-sensing the BioCD protein array. | ||
Matrix-assisted laser desorption/ionization (MALDI) and electrospray ionization (ESI) are the common methods of ionization. Protein identification by tandem mass spectroscopy is a valuable part of bioinformatics and can play an important role in clinical applications if the instrument is miniaturized.70 BioCD technology was applied to sandwich ELISA using capture and detection antibodies. Therefore, the mass of the whole complex is correlated to the amount of PSA antigen present in the sample. The SiO2 is very economical and well known for its use in immobilization techniques. However, the use of butaraldehyde based silanol improves the PSA detectability of the device.71
In this modified method, the aldehyde group of the butaraldehyde moiety reacts with the antibodies and the hydroxyl group of silanol reacts with the silica surface to form Si–O–Si in the process of immobilization of pABs on the surface. The major disadvantage of the BioCD technology is its low specificity to detect target proteins in the presence of other proteins such as in serum samples.
The use of mass spectroscopy for biomarker detection by using biotin labeled antibodies has been reported.79 However, the disadvantage of this method is its inability to differentiate between unlabeled and labeled proteins. To overcome the disadvantage of non-specificity, the streptavidin labeled magnetic beads are also used.80,81 Mass based protein detection is complicated for routine analysis and it is an expensive technique for regular clinical diagnosis.82
2.4 Electrochemical immunoassay
In general the serum samples are turbid and viscous in nature. Purification of serum samples is a tedious process and it also obstructs the superior detection of proteins.83 Electrochemical immunoassay works well in the detection of opaque and optically dense material.84 In an electrochemical immunoassay, the detection of free PSA (fPSA) is performed by measuring the electric current with the help of a three electrode sensor,85 which measures the amount of electrons needed to re-reduce the TMB substrate, as shown in Fig. 6. The basic PSA detection experimental procedure follows the sandwich ELISA protocol, in which the pABs are immobilized on the magnetic beads. As depicted in Fig. 6, the magnetic bead coated anti-PSA antibodies are allowed to react with PSA followed by horseradish peroxidase (HRP) conjugated sAB to form a bio-conjugate complex of magnetic bead–pAB–antigen–HRP labeled sAB. The complex is then separated with the help of a neodymium magnet. Once the excess of antigen and antibodies are washed, TMB (enzyme substrate) in the presence of H2O2 is added. HRP oxidizes the substrate and transfers electrons to H2O2. The oxidized TMB substrate is reduced with the help of a suitably poised electrode and the amount of current generated is used to determine the concentration of PSA. | ||
| Fig. 6 PSA detection by electrochemical immunoassay. | ||
The reported detection limit of this method is below 100 pg mL−1 and no cross linking polymer is required as compared to the standard ELISA procedure. The drawback of this method is the nonlinearity in the results.86,87 The signal intensity increases with the increase in the TMB concentration, however it reaches a plateau for 50% and higher concentrations of TMB in solution.88,89
Recently, a method for label-free electrochemical detection of PSA based on the nucleic acid aptamer has been reported.90 As shown in Fig. 7, the binding of PSA with the immobilized aptamer results in the decrease in current (signal-off), which is measured by square wave voltammetry. Using this technique the PSA with the concentration in the dynamic range of 1 ng mL−1 to 1 μg mL−1 can be easily detected. The advantage of this method is that it uses a reagentless and label-free electrochemical biosensor based on a DNA aptamer. The DNA aptamer can detect PSA with very high specificity. The detection limit of this method is 1 ng mL−1. This detection limit is enough for the diagnosis of PCa but it is not suitable for the direct clinical application of this method in the prognosis and follow-up of treatment.
 | ||
| Fig. 7 Working principle for the “off–on” detection of PSA using an aptamer capture probe, followed by hybridization with a complementary sequence (adapted from Biosens. Bioelectron., 2015, 15, 68, 49–54). | ||
Gold nanoparticles (AuNPs) are reported to have distinct physical and chemical properties that make them excellent platforms for various biological and chemical applications.91 AuNPs have been successfully used as the surfaces for the immobilization of proteins in the development of the electrochemical biosensors.92 However, other surfaces which have electrochemical properties are also used to obtain electrochemical biosensors.
As shown in Fig. 8, an AuNP platform combined with a multiple-enzyme labeled sAB-magnetic bead bioconjugate was used for the ultrasensitive detection of PSA in serum samples.93 The signal amplification was achieved by using synthesized magnetic bioconjugate particles containing 7500 HRP labels along with the sAB attached to 1 μm magnetic beads. This method allowed the detection of PSA with the detection limit of 0.5 pg mL−1 in only 10 μL of an undiluted serum sample.
 | ||
| Fig. 8 AuNP based electrochemical immunosensor (adapted with permission from ACS Nano, 2009, 3, 585–594. Copyright (2009) American Chemical Society). | ||
In another method, an organic electrochemical transistor based on poly(styrenesulfonate) doped poly(3,4-ethylenedioxythiophene) (PEDOT-PSS) and AuNP labeled with pAb allowed the detection of PSA at concentrations of 1 pg mL−1.94 However, it has been reported that the use of platinum nanoparticles labeled with Ab and the hydrogen evolution reaction in an electrochemiluminescence technique allows an incredibly low detection limit for PSA of 1 fg mL−1.95 The detection limits of 2.5 fg mL−1 and 1.2 fg mL−1 using electrochemiluminescence techniques have been reported independently.96,97
2.5 Surface enhanced Raman spectroscopy (SERS)
SERS is an ultrasensitive vibrational spectroscopic technique, which can be used to detect biomarker proteins on or near the surface of plasmonic nanostructures.98 In SERS the scattering cross-sections for molecules immobilized on the metallic nanostructure are very important for its effective applications in biochemical studies, clinical diagnoses, and environmental monitoring.99Therefore, the success of SERS depends on the metallic nanostructures and the immobilization of antibodies on the metallic nanostructures. Recent advances in SERS have led to the design of novel nanoprobes which are called as SERS tags.
The SERS tags are the combination of metallic nanoparticles and highly specific organic Raman reporter molecules. The SERS-active nanoprobes produce strong, characteristic Raman signals and can be used to detect biomarkers using laser Raman spectrometry or SERS microscopy.
A sandwich immunoassay format, as shown in Fig. 9, was further developed for the quantitative detection of biomarkers by using Raman labelled nanoparticles.100,101 A substrate coated with pAB is consecutively exposed to a solution containing different concentrations of biomarkers and sAB labelled nanoparticles. The amount of captured biomarkers is reflected in the SERS signals. The reported detection limit for fPSA by this technique is 1 pg mL−1 in human serum.102–104
 | ||
| Fig. 9 PSA detection by surface enhanced Raman spectroscopy. | ||
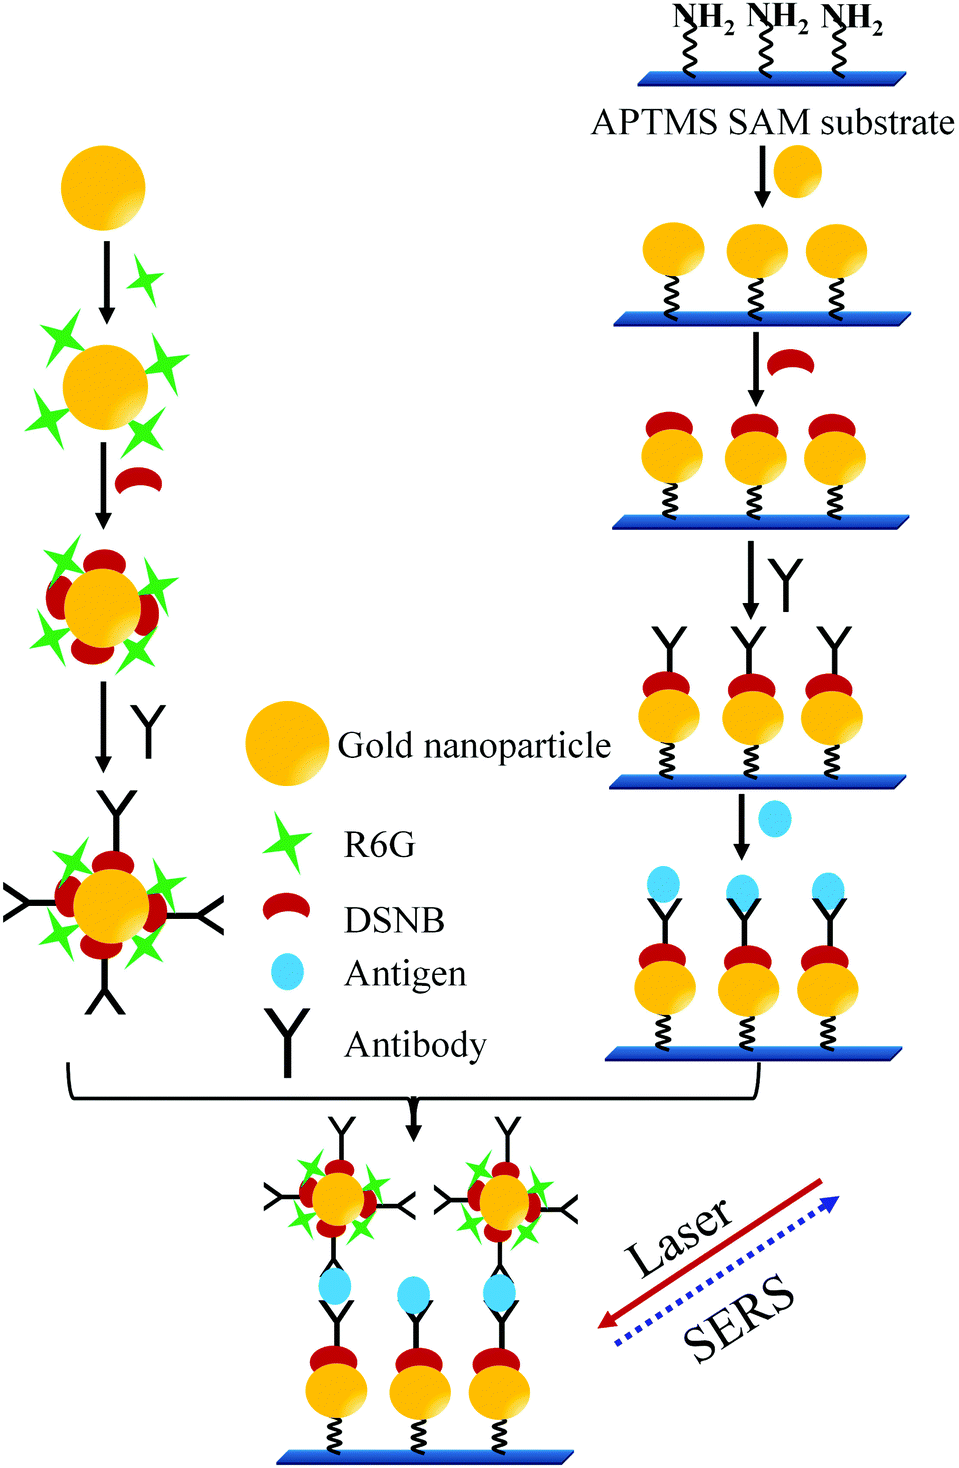
In another sandwich type SERS immunoassay105 used for the detection of PSA as depicted in Fig. 10, pABs were immobilized on the gold substrates prepared by making the monolayer of AuNPs on the 3-aminopropyltrimethoxysilane (APTMS) derivatized surface of a glass slide. In this immunoassay a sandwich type complex between the immobilized pAB, PSA, and sABs conjugated with the Raman reporter (5,5′-dithiobis(succinimidyl-2-nitrobenzoate coated AuNPs with rhodamine 6G)) is allowed to form. A strong SERS spectrum of the Raman reporter can be observed only in the presence of PSA. Thereby, PSA at varying concentrations was successfully detected. The reported detection limit of this method is 1 pg mL−1.
 | ||
| Fig. 10 Sandwich type SERS immunoassay process (adopted from Bull. Korean Chem. Soc., 2010, 31, 1215–1218). | ||
Despite tremendous interest in developing SERS tags, research in this area has fallen behind that of other nanoprobes such as QDs and dye-doped nanobeads.106 The reported developments in SERS so far have attempted to demonstrate a proof-of concept about SERS tags. However, in the near future, advances in SERS should be made such that it could be applicable for routine clinical detection of biomarkers in clinical samples. For the direct clinical applicability of SERS it is necessary to overcome the drawbacks such as the need of expensive instrumentation, lack of deeper understanding of mechanisms and fundamental principles of SERS.
2.6 Fluorescence based detection
Among the optical detection methods, fluorescence detection has been most widely used in biological applications. The fluorescence based detection of biomarker proteins uses a simple quantification process, easy detection of large-scale samples, and comparatively easy labelling of biomolecules with fluorescent tags.107,108 The fluorescent labelled sAB's are used for the quantification of the antigens in the samples. Moreover, the signal amplification is performed by using fluorescent nanobeads instead of fluorescent molecules. The fluorescent nanobeads are prepared by entrapping fluorescent dyes inside the microbeads composed polystyrene. Then these fluorescent beads are conjugated with the sABs, which can form a sandwich type biomolecular complex with the antigen and immobilized pAB. There are several methods in use for the fluorescence based detection of the PSA.109,110As shown in Fig. 11 the Luminex assay uses two different anti-PSA monoclonal antibodies 5G6 and 8A6 as pABs for fPSA and tPSA, respectively. Another anti-PSA monoclonal antibody (5A6) is used as a sAB in the same assay. However, both of the 5G6 and 8A6 can bind to 5A6. The antibodies (5G6 and 8A6) are covalently coupled to two different types of beads for the analysis of fPSA and tPSA, respectively. The capture of any kind of PSA is detected by using a phycoerythrin labelled 5A6, which is a sAB. The detection tPSA is based on its capture by the 5G6 antibody and simultaneous formation of a bio-conjugate complex with the reporter 5A6 antibody. Similarly the detection of fPSA is performed by formation of its bioconjugate complex with the 8A6 antibody and reporter antibody. After incubation, the samples are analysed by using a BioPlex reader. Hence, by this method both tPSA and fPSA can be simultaneously detected in one sample. The reported detection limits for tPSA and fPSA are 2.3 pg mL−1 and 1.3 pg mL−1, respectively.113
 | ||
| Fig. 11 Simultaneous detection of fPSA and tPSA by flow cytometry. | ||
There are several reports on the use of a smartphone as a measurement device in the microfluidic diagnostic tests based on colorimetric immunoassays with a lower limit of detection of 3.2 ng ml−1 PSA in serum samples.114 It is well accepted that the colorimetric detection is usually more cost-effective, easy-to-use, and rapid.115 However, the fluorescence detection actually presents the higher sensitivity required for detection of biomarkers at ultralow concentrations.
More recently, a flexible smartphone based colorimetric and fluorescence detection system was reported for the detection of the PSA from whole blood. It is reported that the colorimetric detection takes only 13 min and the fluorescence detection takes about 22 min.116 As depicted in Fig. 12, a technology called as MCFPhone can detect PSA in the range of 0.9 to 60 ng ml−1 in a colorimetric assay and by using the fluorescence substrate the lower limit of detection was further improved from 0.4 to 0.08 ng mL−1 in whole blood samples.
 | ||
| Fig. 12 Portable smartphone quantitation of prostate specific antigen (PSA) in a fluoropolymer microfluidic device (adopted from Biosens. Bioelectron., 2015, 70, 5–14). | ||
The gap between the absorbance and emission spectra of europium nanoparticles (EuNPs) allow them to compete with the traditional protein detection technologies. Europium shows the absorption maxima at 290 nm and emission from 610 to 620 nm with the emission maxima at 615 nm. Even though europium has a very narrow bandwidth of 10 nm, it has a very long luminescence lifetime of 600 to 1000 μs. Furthermore, it is relatively non-toxic in comparison with other heavy metals.120 The EuNPs containing a chelated Eu3+ by 4,7-bis(chlorosulfophenyl)-1,10-phenanthroline-2,9-dicarboxylic acid (BCPDA) have been reported for the detection of PSA.
It is well accepted that the sensitivity of fluorescence based assays can be improved by attaching many fluorescent groups to the labelled reagents. As shown in Fig. 13 the biotinylated 50–100 BCPDA molecules conjugated to polyvinylamine (PVA) can be used in the detection of PSA. This assay is based on the formation of a biomolecular complex between the immobilized pAB, PSA, biotinylated sAB, streptavidin and the biotinylated BCPDA–PVA adduct.
 | ||
| Fig. 13 Signal amplification for the detection of PSA. | ||
This technique allowed us to obtain the linear standard curve for PSA concentrations of 0.001–1 pg mL−1.121 Europium based time resolved fluorescence spectroscopy has attracted many researchers yielding the 0.38 pg mL−1 detection limit for PSA. Europium has the highest quantum yield and a narrow band. The only drawback of the direct europium based detection is the fluorescence quenching of europium in the presence of the water molecules. This drawback was easily solved by using the EuNP coated polystyrene which acts as a barrier to water molecules. Hence, as shown in Fig. 14 the use of streptavidin labelled EuNPs allow the detection of PSA with the detection limit of 1.6 pg mL−1.122 The major disadvantage of this method is non-specific binding leading to low clinical specificity of the assay.
 | ||
| Fig. 14 Use of europium nanoparticles for the detection of PSA. | ||
 | ||
| Fig. 15 Detection of PSA by using AuNP on membrane. | ||
When the sample solution is loaded on the sample loading port it flows toward the other end by the capillary action. During this process the PSA antigen from the sample forms a complex with the sABs coated on the AuNPs. Then this complex binds to the respective pABs immobilized on the membrane allowing the detection of antigens. The quantification of the respective PSA (fPSA or TPSA) is performed by analysing the signal intensities. This technology is useful for simultaneous detection of fPSA and tPSA. The 1 ng mL−1 of the PSA is reported as a detection limit for this technology.130 The major disadvantage of this method is the variation in the results with the variation in the ionic strength of the solution. The AuNPs also tend to aggregate in the solution containing a high concentration of ions.
 | ||
| Fig. 16 Detection of PSA on the protein microarray. | ||
The detection of biomarkers is based on the formation of the biomolecular complex between the immobilized pAB, respective antigen and the sAB labelled with the fluorescent dye. The quantification of the antigen in the sample is performed by analysing the fluorescence signal intensity. The protein microarray is advantageous in the sense that it requires a very small amount of the sample and reagents.132,133 Similar to ELISA, the issue of a non-specific interaction of the immobilized antibodies with other proteins remains a major drawback of the reported protein microarrays.134 Though protein microarrays use a very simple experimental protocol, the sensitivity of such a method depends on the use of the particular chemistry for the immobilization of proteins on the surface.135 The immobilization of the pAB self-assembled monolayer (SAM) of calix[4]crown-5 derivatives on the amine modified the glass slides allowed the detection of PSA with the detection limit of 1–10 fg mL−1.136,137
The PSA screening tests are reported to have a significant correlation with 20% reduction in cancer mortality. However, due to the low specificity of the PSA assays, they lead to unnecessary and painful biopsies.138,139 Therefore, the requirement for additional PCa biomarkers is increasingly high. Recently, the protein microarray based immunoassay platform for sensitive and selective duplex detection of PSA and hK2 has been reported. The assay showed a detection limit less than 10 pg mL−1 and a dynamic range of 104–105 orders of magnitude for each biomarker.140
 | ||
| Fig. 17 Detection of PSA by quantum dot technology. | ||
The only disadvantage of the use of QD is that the surface defect of quantum dots can lead to a blinking effect and decrease the quantum yield resulting in the low sensitivity of the QD based assay.144 Though the initial size of the QD is in nanometre, after bio-conjugation the QDs are found to form the aggregates of larger sizes.145 The detection limit of a method which uses QD for the detection of PSA was reported to be 10 pg mL−1.146
As shown in Fig. 18, a novel quantum dot conjugated immunosensor has been reported recently for the detection of PSA in seminal fluids. The displacement of quencher-labelled peptide analogues bound to antibodies labelled on the QD by PSA generate the fluorescence signal. This method can overcome many practical disadvantages associated with traditional lateral flow cartridge testing. The PSA solution employed in the analysis corresponds to dilution of about forty times the concentration of PSA found in human semen.
 | ||
| Fig. 18 PSA nanosensor assembly: (a) Ab–QDot (antibody–quantum dots) complexes are prepared using amine–thiol crosslinking, (b) conjugates are incubated with a quencher-labelled epitope peptide; binding brings the QD and quencher into FRET (Forster resonance energy transfer) proximity and decreases emission, (c) the binding of higher affinity PSA (Prostate Specific Antigen) displaces the peptide and restores fluorescence (adopted from RSC Adv., 2015, 5, 6595–6598). | ||
The DNA directed immobilization (DDI) method as depicted in Fig. 19 is one of the well-known protein immobilization methods used for immobilization of proteins and thereby detection of biomarkers. In DDI, DNA conjugated proteins are immobilized on the chip through DNA–DNA hybridization to reduce the non-specific interactions which exist between proteins upon direct immobilization. Thus, the methods like DDI improve the stability of proteins, but the lengthy process limits the sensitivity of the method to 100 pg mL−1.150,151 The only disadvantage of this method is that the immobilized proteins lose their activity over a period of time.
 | ||
| Fig. 19 DNA directed immobilization of antibodies (pAB). | ||
Recently, a DNA guided detection (DAGON) method based on 9G DNA technology152–156 has been reported for highly sensitive detection of biomarkers such as PSA and C-reactive protein (CRP).157
The major difference between the DAGON and other methods is that the antigen–antibody biomolecular complexes of pAB–DNA, antigen, and Cy5–sAB are allowed to form in the solution. As shown in Fig. 20, the biomolecular complex of the Cy5-labeled sAB, PSA, and the pAB–DNA conjugate formed in the solution is site-specifically guided to the predestined area on the chip surface to hybridize with the oligonucleotide probes at room temperature. Therefore, the DAGON method can detect multiple antigens in the mixture of the proteins with concentrations of 1 pg mL−1 and 0.1 pg mL−1 without any signal amplification technique. The DAGON method shows 1000-fold improvement in the sensitivity as compared to the DDI.158
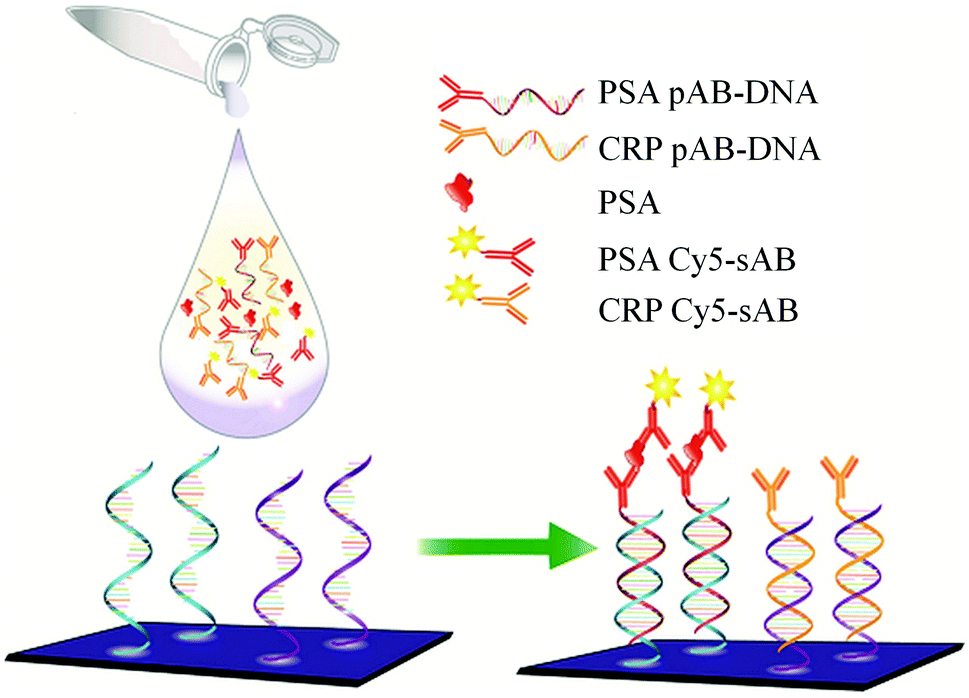 | ||
| Fig. 20 Detection of PSA by the DAGON method on 9G DNAChips. | ||
A brief comparison of the methods used for the detection of PSA is summarized in Table 3. As shown in Table 3 it is clear that each method has its own advantages and limitations. However, it is important to notice that in the current scenario the detection of PSA alone for the diagnosis of PCa is not enough. Therefore, a technology which can allow for simultaneous detection of PSA and other biomarkers will be of prime importance.
| Method | Advantages | Limitations |
|---|---|---|
ELISA  |
Well known method | Lower detection limit |
| Absorbance is proportional to the antigen concentration | Non-specific interactions | |
| pH, buffer solution, presence of water affect the result | ||
Mass-sensing BioCD protein array  |
Sensitive technique | Sensitive to the presence of other proteins e.g. blood sample |
| Lower detection limit | ||
Electrochemical immunoassay  |
Work well with opaque sample | Not linear above 50% TMB solution |
| Presence of an oxidizing/reducing agent may vary the result | ||
2D gel electrophoresis  |
fPSA/tPSA are separated | Require large amount of sample |
| Small dynamic rage | ||
| No. of steps are more | ||
| Buffer dependable | ||
Surface enhanced Raman spectroscopy  |
No photo-bleaching | Decay of SERS-active Ag NP in the laboratory environment |
| Change in size and shape of SERS-active molecule changes the properties of emission | ||
| Need of advance microscopic techniques for better detection | ||
Flow cytometry  |
100–500 samples at the same time | Multipurpose diluents in the case of high no. of analytes can vary the result |
EuNP based detection  |
Narrow bandwidth, long fluorescence time | Fabrication of EuNP is crucial |
| Results are dependent on size and selection of the chelating agent | ||
| Non-specific binding | ||
| Aggregation of EuNP as ionic conc. changes | ||
| Single molecule detection is not possible in each case | ||
AuNP/membrane based detection  |
Short time | It is qualitative test not quantitative |
| Aggregation of AuNP as the ionic strength of solution changes | ||
Protein microarray  |
Large no. of sample on the single chip | Instability of protein on the solid surface |
| Non-specific interactions due to the hydrophobic surface | ||
| Attaching the protein to the chip surface is a critical step | ||
| Native structure of protein can be changed in the case of attachment process | ||
| Possibility of protein aggregation is more | ||
| Quantum dots based detection | Highly sensitive detection | Surface problem can change the quantum yield of dots |

|
Aggregation problem | |
9G DNA technology  |
Stability of antigen is maintained | Conjugation of pAB and sAB is essential |
| No non-specific interaction | ||
| Ultrasensitive detection | ||
| Large no. of samples at a time |
3. Future directions for detection of PCa
There are three major methods adopted for treatment of PCa, the radical prostatectomy, radiation therapy, and chemotherapy.159,160 It is well known that the half-life of serum PSA is three days. Therefore, PSA levels are most useful for monitoring patients with an established PCa or a residual disease after radical prostatectomy.161,162 Generally after 30 days of curative radical prostatectomy, the serum PSA level should decrease to less than 0.05 ng mL−1 as depicted in Fig. 21A. | ||
| Fig. 21 Serum PSA levels after (A) radical prostatectomy (1) <0.05 ng mL−1, (2) >0.4 ng mL−1, (3) 0.2 ng mL−1; (B) radiation therapy (1) <0.05 ng mL−1, (2) <0.2 ng mL−1, (3) consistently higher than 2.0 ng mL−1; (C) chemotherapy (1) very low (<50 pg mL−1), (2) 2–4 ng mL−1, (3) >4.0 ng mL−1. | ||
It is reported that if the PSA values fall to less than 0.05 ng mL−1, 92% of patients remain disease free for up to 70 months. However, a residual PCa is suspected if post-operative PSA levels remain greater than 0.4 ng mL−1. PSA is a very sensitive indicator of recurrence after radical prostatectomy. The levels begin to rise in 6 to 23 months (mean lead-time of 12 months) before there is any clinical evidence of the recurrence. The American Urological Association defines biochemical recurrence after prostatectomy as a PSA value of 0.2 ng mL−1. It is recommended that this value should be confirmed by at least two different PSA measurements before concluding the recurrence of PCa.
The patients with PCa can be treated with radiation therapy for clinically localized cancer. It is important to notice that the PSA levels usually increase (1.2 times the baseline) immediately after beginning the radiation therapy as depicted in Fig. 21B. Following radiation therapy, the PSA level should sharply decrease to an undetectable level. The PSA values higher than 0.2 ng mL−1 are uncommon after external beam radiotherapy. A consistent rise in the PSA level above 0.2 ng mL−1 after radiation therapy usually indicates the cancer recurrence.163,164
A serial detection of PSA levels after chemotherapy, which includes luteinizing hormone releasing the hormone (LHRH) agonist, or the 5 alpha reductase inhibitor, is helpful in monitoring the treatment.165,166 As shown in Fig. 21C, nearly all patients have a dramatic initial response to therapy with PSA levels decreasing rapidly in the first six months of treatment. It is important to note that a failure to achieve a PSA nadir less than 4.0 ng mL−1 in patients undergoing chemotherapy has a median survival of one year. The patients with a PSA nadir of less than 0.2 ng mL−1 have a much longer median survival of 6 years. Therefore, the accurate detection of PSA at low levels is not only the key for the early diagnosis and treatment of PCa but also for monitoring the curing process. Though there is enormous technological improvement in the field of PSA detection, a fast and low-cost analytical method which can be employed at the bedside of patients is still of the highest interest for clinicians.
Therefore, the development of technologies which can detect the PSA at very low concentrations (fg mL−1 ∼ pg mL−1) in a very short time are crucial for the monitoring of PCa treatment. The current reports suggest that the emerging biomarkers may be useful for the screening and prognosis of PCa. Therefore, new biomarkers should be evaluated for more accurate and reliable detection of PCa. The identification and development of novel biomarkers for PCa depends on the development of novel techniques which can detect the biomarker proteins with ultra-low concentrations. Therefore, considering the available biomarker detection technologies and their advantages and disadvantages there is huge scope for the development of novel technologies.
Trends in the clinical diagnostics indicate the necessity of a diagnostic test to be performed near the patient sites.167 The biomarker detection platforms must therefore be adapted for a point-of-care testing, which requires the ability to design affordable, portable, and user-friendly immunoassay systems. The point-of-care testing immunoassay systems should be capable of rapid and sensitive detection of biomarkers.168
4. Conclusions
The use of PSA as a biomarker has resulted in the early detection of PCa, thus it helps in reducing the mortality due to PCa. However, PCa screening remains controversial, due to over diagnosis, over treatment, and the inability to detect significantly dangerous tumours. Clinicians strongly believe that combining multiple independent biomarkers into a panel would improve the accuracy for detection and staging of PCa. The approach of multiple biomarker detection for PCa would benefit patients by avoiding unnecessary invasive biopsies and staging information will allow decision making for accurate treatment. Therefore, it is necessary to evaluate other biomarkers for diagnosis, prognosis, and treatment follow-up of PCa. Significant progress has been made in technologies for the detection of PCa related biomarkers in recent years. Though, the accuracy and the limit of detection of technologies are well suited for the detection of PSA, they are not directly applicable in the detection of other biomarkers. The ideal diagnostic tool should make it possible for physicians to check a panel of biomarkers when patients get regular check-ups, so that the early detection of disease can allow effective treatment. Moreover, the diagnostic platform should be flexible in the sense that it should be readily applicable for the detection of biomarkers with ultra-low concentrations. Thus a diagnostic platform which will allow the detection of biomarkers at ultra-low concentrations can be used for the dual purposes, (i) the development and evaluation of novel biomarkers, and (ii) early detection of cancer and treatment follow-up.Acknowledgements
This work was supported by the Technological Innovation R&D Program (S2130946) funded by the Small and Medium Business Administration (SMBA), Korea. This research was also supported by the Hallym University Research Fund (HRF-201504-018).Notes and references
- O. Golubnitschaja and J. Flammer, Surv. Ophthalmol., 2007, 52, S155–S161 CrossRef PubMed.
- C. L. Sawyers, Nature, 2008, 452, 548–552 CrossRef CAS PubMed.
- X. Filella and L. Foj, Clin. Chem. Lab. Med., 2015, 53, 963 CrossRef CAS PubMed.
- V. Kulasingamand and E. P. Diamandis, Nat. Clin. Pract. Oncol., 2008, 5, 588 CrossRef PubMed.
- A. M. Hawkridge and D. C. Muddiman, Annu. Rev. Anal. Chem., 2009, 2, 265 CrossRef CAS PubMed.
- R. de la Rica and M. M. Stevens, Nat. Nanotechnol., 2012, 7, 821–824 CrossRef CAS PubMed.
- D. Alberti, M. V. T. Erve, R. Stefania, M. R. Ruggiero, M. Tapparo, S. Geninatti Crich and S. Aime, Angew. Chem., Int. Ed., 2014, 53, 3488–3491 CrossRef CAS PubMed.
- H. Lee, J.-E. Park and J.-M. Nam, Nat. Commun., 2014, 5, 3367 Search PubMed.
- G. Garcia-Schwarz and J. G. Santiago, Angew. Chem., Int. Ed., 2013, 52, 11534–11537 CrossRef CAS PubMed.
- W.-C. Law, K.-T. Yong, A. Baev and P. N. Prasad, ACS Nano, 2011, 5, 4858–4864 CrossRef CAS PubMed.
- S. Krishnan, V. Mani, D. Wasalathanthri, C. V. Kumar and J. F. Rusling, Angew. Chem., Int. Ed., 2011, 50, 1175–1178 CrossRef CAS PubMed.
- M. M. Varma, H. D. Inerowicz, F. E. Regnier and D. D. Nolte, Biosens. Bioelectron., 2004, 19, 1371 CrossRef CAS PubMed.
- S. R. Panikkanvalappil, M. A. Mackey and M. A. El-Sayed, J. Am. Chem. Soc., 2013, 135, 4815–4821 CrossRef CAS PubMed.
- M. Li, S. K. Cushing, J. Zhang, S. Suri, R. Evans, W. P. Petros, L. F. Gibson, D. Ma, Y. Liu and N. Wu, ACS Nano, 2013, 7, 4967–4976 CrossRef CAS PubMed.
- J. Wang, L. Wu, J. Ren and X. Qu, Small, 2012, 8, 259–264 CrossRef CAS.
- Y. Song, W. Wei and X. Qu, Adv. Mater., 2011, 23, 4215–4236 CrossRef CAS PubMed.
- M. Labib, N. Khan, S. M. Ghobadloo, J. Cheng, J. P. Pezacki and M. V. Berezovski, J. Am. Chem. Soc., 2013, 135, 3027–3038 CrossRef CAS PubMed.
- B. V. Chikkaveeraiah, A. A. Bhirde, N. Y. Morgan, H. S. Eden and X. Chen, ACS Nano, 2012, 6, 6546–6561 CrossRef CAS PubMed.
- S. Rana, A. K. Singla, A. Bajaj, S. G. Elci, O. R. Miranda, R. Mout, B. Yan, F. R. Jirik and V. M. Rotello, ACS Nano, 2012, 6, 8233–8240 CrossRef CAS PubMed.
- K. Mizusawa, Y. Takaoka and I. Hamachi, J. Am. Chem. Soc., 2012, 134, 13386–13395 CrossRef CAS PubMed.
- B. T. Houseman and M. Mrksich, Trends Biotechnol., 2002, 20, 279–281 CrossRef CAS PubMed.
- M. Bolla, et al. , Lancet, 2012, 380, 2018 CrossRef.
- D. L. Ouyang, J. J. Chen, R. H. Getzenberg and R. E. Schoen, Am. J. Gastroenterol., 2005, 100, 1393 CrossRef CAS PubMed.
- K. Jian, Curr. Opin. Mol. Ther., 2007, 9, 563 Search PubMed.
- M. Duffy, Clin. Chem., 2006, 52, 345 CAS.
- J. Groskopf, S. Aubin, I. Deras, A. Blase, S. Bodrug, C. Clark, S. Brentano, J. Mathis, J. Pham, T. Meyer, M. Cass, P. Hodge, M. L. Macairan, L. S. Marks and H. Rittenhouse, Clin. Chem., 2006, 52, 1089 CAS.
- A. Haese, A. de la Taille and H. van Poppel, Eur. Urol., 2008, 54, 1081 CrossRef PubMed.
- C. Kumar-Sinha, S. Tomlins and A. Chinnaiyan, Nat. Rev. Cancer, 2008, 8, 497 CrossRef CAS PubMed.
- F. H. Schroder, et al. , N. Engl. J. Med., 2009, 360, 1320 CrossRef PubMed.
- M. Bussemakers, et al. , Cancer Res., 1999, 59, 5975 CAS.
- L. Marks, et al. , Urology, 2007, 69, 532–535 CrossRef PubMed.
- D. Ankerst, et al. , J. Urol., 2008, 180, 1303 CrossRef PubMed.
- A. Wu, A. Reese, M. Cooperberg, N. Sadetsky and K. Shinohara, Prostate Cancer Prostatic Dis., 2012, 15, 100 CrossRef CAS PubMed.
- S. A. Tomlins, et al. , Science, 2005, 310, 644 CrossRef CAS PubMed.
- M. Van Gils, D. Hessels, O. van Hooij, S. Jannink, W. Peelen and S. Hanssen, Clin. Cancer Res., 2007, 13, 939 CrossRef CAS PubMed.
- R. Nam, L. Sugar, W. Yang, S. Srivastava, L. Klotz and L. Yang, Br. J. Cancer., 2007, 97, 1690 CrossRef CAS PubMed.
- J. Wang, Y. Cai, C. Ren and M. Ittmann, Cancer Res., 2006, 66, 8347 CrossRef CAS PubMed.
- H. Uetsuki, H. Tsunemori, R. Taoka, R. Haba, M. Ishikawa and Y. Kakehi, J. Urol., 2005, 174, 514 CrossRef PubMed.
- S. R. Potter and A. W. Partin, Rev Urol., 2000, 2, 221 Search PubMed; L. Schedlich, B. Bennetts and B. Morris, DNA, 1987, 6, 429 CrossRef CAS.
- B. J. Martin, J. A. Finlay, K. Sterling, M. Ward, D. Lifsey, D. Mercante, J. M. Jainto, L. Martin and W. Rayford, Prostate Cancer Prostatic Dis., 2004, 7, 132 CrossRef CAS PubMed.
- Z. D. Han, et al. , Pathol. Oncol. Res., 2009, 15, 369 CrossRef CAS PubMed.
- W. D. Zhong, et al. , Int. J. Cancer., 2012, 130, 300 CrossRef CAS PubMed.
- F. Lowe and S. Trauzzi, Urol. Clin. North Am., 1993, 20, 589 CAS.
- W. J. Catalona, D. S. Smith and D. K. Ornstein, JAMA, 1997, 277, 1452 CrossRef CAS.
- G. Andriole, et al. , N. Engl. J. Med., 2009, 360, 1310 CrossRef CAS PubMed.
- F. Schroder, et al. , N. Engl. J. Med., 2009, 360, 1320 CrossRef PubMed.
- V. Moyer, Ann. Intern. Med., 2012, 157, 120 CrossRef PubMed.
- K. C. Cary and M. R. Cooperberg, Ther. Adv. Urol., 2013, 5, 318 CrossRef CAS PubMed.
- F. Secundo, Chem. Soc. Rev., 2013, 42, 6250 RSC.
- T. Rabilloud and C. Lelong, J. Proteomics, 2011, 74, 1829 CrossRef CAS PubMed.
- J. P. Charrier, C. Tournel, S. Michel, P. Dalbon and M. Jolivet, Electrophoresis., 1999, 20, 1075 CrossRef CAS PubMed.
- V. Kumar, M. I. Hassan, A. K. Singh, S. Dey, T. P. Singh and S. Yadav, Clin. Chim. Acta, 2009, 403, 17 CrossRef CAS PubMed.
- K. Jung, J. Reiche, A. Boehme, C. Stephan, S. A. Loening, D. Schnorr, W. Hoesel and P. Sinha, Clin. Chem., 2004, 50, 2292 CAS.
- T. Rabilloud and C. Lelong, J. Proteomics, 2011, 6, 1829 CrossRef PubMed.
- R. C. Murdock, L. Shen, D. K. Griffin, N. Kelley-Loughnane, I. Papautsky and J. A. Hagen, Anal. Chem., 2013, 85, 11634 CrossRef CAS PubMed.
- Y. Okamoto, H. Murakami and M. Nishida, Endocrinol. J., 1997, 44, 349 CAS.
- H. Matsuda, H. Tanaka, B. L. Blas, J. S. Noseñas, T. Tokawa and S. Ohsawa, Jpn. J. Exp. Med., 1984, 54, 131 CAS.
- E. S. Bos, A. A. van der Doelen, N. van Rooy and A. H. Schuurs, J. Immunoassay, 1981, 2, 187 CrossRef CAS PubMed.
- B. Acevedo, Y. Perera, M. Ruiz, G. Rojas, J. Benítez, M. Ayala and J. Gavilondo, Clin. Chim. Acta, 2002, 317, 55 CrossRef CAS.
- H. Lee, M. A. Dineva, Y. L. Chua, A. V. Ritchie, I. Ushiro-Lumb and C. A. Wisniewski, J. Infect. Dis., 2010, 201(Suppl 1), S65 CrossRef CAS PubMed.
- M. Wilchek and E. A. Bayer, Anal. Biochem., 1988, 171, 1 CrossRef CAS PubMed.
- J. D. Hirsch, L. Eslamizar, B. J. Filanoski, N. Malekzadeh, R. P. Haugland, J. M. Beechem and R. P. Haugland, Anal. Biochem., 2002, 308, 343 CrossRef CAS PubMed.
- D. Kim and A. E. Herr, Biomicrofluidics, 2013, 7, 041501 CrossRef PubMed.
- J. E. Lee, J. H. Seo, C. S. Kim, Y. Kwon, J. H. Ha, S. S. Choi and H. J. Cha, Korean J. Chem. Eng., 2013, 30, 1934 CrossRef CAS.
- F. Rusmini, Z. Zhong and J. Feijen, Biomacromoles, 2007, 8, 1775 CrossRef CAS PubMed.
- G. T. Hermansson, Bioconjugate Techniques, Academic Press, San Diego, 2nd edn, 2008 Search PubMed.
- Q. Gu, T. M. Sivanandan and C. A. Kim, Proteome Sci., 2006, 4, 21 CrossRef PubMed.
- X. F. Wang, M. Zhao and D. D. Nolte, Anal. Bioanal. Chem., 2009, 393, 1151 CrossRef CAS PubMed.
- X. Wang, M. Zhao, D. D. Nolte and T. L. Ratliff, Biosens. Bioelectron., 2011, 26, 1871 CrossRef CAS PubMed.
- P. Hernandez, M. Müller and R. D. Appel, Mass Spectrom. Rev., 2006, 25, 235 CrossRef CAS PubMed.
- D. Kumar, M. Sonawane, B. Pujala, V. K. Jain, S. Bhagat and A. K. Chakraborti, Green Chem., 2013, 15, 2872 RSC.
- J. C. Pyun, M. Y. Cheong, S. H. Park, H. Y. Kim and J. S. Park, J. Immunol. Methods, 1997, 208, 141 CrossRef CAS PubMed.
- N. Suzuki, M. S. Quesenberry, J. K. Wang, R. T. Lee, K. Kobayashi and Y. C. Lee, Anal. Biochem., 1997, 247, 412 CrossRef CAS PubMed.
- C. K. Dixit, S. K. Vashist, F. T. O'Neill, B. O'Reilly, B. D. MacCraith and R. O'Kennedy, Anal. Chem., 2010, 82, 7049 CrossRef CAS PubMed.
- A. Aviñó, M. J. Gómara, M. Malakoutikhah, I. Haro and R. Eritja, Molecules, 2012, 17, 13825 CrossRef PubMed.
- J. Wang, M. L. Li, D. Hua and Q. Chen, BioTechniques, 2006, 41, 79 CrossRef CAS PubMed.
- M. A. Cuccuru, D. Dessì, P. Rappelli and P. L. Fiori, J. Immunol. Methods, 2012, 382, 216 CrossRef CAS PubMed.
- A. Bosnjakovic, M. K. Mishra, H. J. Han, R. Romero and R. M. Kannan, Anal. Chim. Acta, 2012, 720, 118 CrossRef CAS PubMed.
- K. L. Simpson, A. D. Whetton and C. J. Dive, J. Chromatogr. B, 2009, 877, 1240 CrossRef CAS PubMed.
- J. Blonder, H. J. Issaq and T. D. Veenstra, Electrophoresis, 2011, 32, 1541 CAS.
- L. M. Schiapparelli, D. B. McClatchy, H. H. Liu, P. Sharma, J. R. Yates and H. T. Cline, J. Proteome Res., 2014, 13, 3966 CrossRef CAS.
- A. M. Hawkridge and D. C. Muddiman, Annu. Rev. Anal. Chem., 2009, 2, 265–277 CrossRef CAS PubMed.
- Z. Liu, W. Qiab and G. Xu, Chem. Soc. Rev., 2015, 44, 3117 RSC.
- A. Warsinke, A. Benkert and F. W. Scheller, Fresenius’ J. Anal. Chem., 2000, 366, 622 CrossRef CAS PubMed.
- D. G. Rackus, M. H. Shamsiab and A. R. Wheeler, Chem. Soc. Rev., 2015, 44, 5320–5340 RSC.
- P. Sarkar, D. Ghosh, D. Bhattacharyay, S. J. Setford and A. F. P. Turner, Electroanalysis, 2008, 20, 1414 CrossRef CAS.
- Y. B. Choi, N. H. Kim, S. H. Kim, G. S. Tae and H. H. Kim, Sensors, 2014, 14, 18886 CrossRef CAS PubMed.
- P. Chandra, P. Suman, H. Airon, M. Mukherjee and P. Kumar, World J. Methodol., 2014, 4, 1 CrossRef PubMed.
- T. A. Freitas, A. B. Mattos, B. V. Silva and R. F. Dutra, Biomed. Res. Int., 2014, 2014, 929786 Search PubMed.
- M. Souada, B. Piro, S. Reisberg, G. Anquetin, V. Noël and M. C. Pham, Biosens. Bioelectron., 2015, 68, 49 CrossRef CAS PubMed.
- E. Boisselier and D. Astruc, Chem. Soc. Rev., 2009, 38, 1759 RSC.
- K. Saha, S. S. Agasti, C. Kim, X. Li and V. M. Rotello, Chem. Rev., 2012, 112, 2739 CrossRef CAS PubMed.
- V. Mani, B. V. Chikkaveeraiah, V. Patel, J. S. Gutkind and J. F. Rusling, ACS Nano, 2009, 3, 585 CrossRef CAS PubMed.
- D. J. Kim, N. E. Lee, J. S. Park, I. J. Park, J. G. Kim and H. J. Cho, Biosens. Bioelectron., 2010, 25, 2477 CrossRef CAS PubMed.
- J. Zhang, B. P. Ting, M. Khan, M. C. Pearce, Y. Yang, Z. Gao and J. Y. Ying, Biosens. Bioelectron., 2010, 26, 418 CrossRef CAS PubMed.
- M. Su, Y. Zhang, X. R. Song, S. G. Ge, M. Yan, J. H. Yu and J. D. Huang, Electrochim. Acta, 2013, 97, 333 CrossRef CAS.
- L. Li, J. Xu, X. Zheng, C. Ma, X. Song, S. Ge, J. Yu and M. Yan, Biosens. Bioelectron., 2014, 61, 76 CrossRef CAS PubMed.
- S. Schlücker, ChemPhysChem, 2009, 10, 1344 CrossRef PubMed.
- Y. C. Cao, R. Jin and C. A. Mirkin, Science, 2002, 297, 1536 CrossRef CAS PubMed.
- A. Shen, L. Chen, W. Xie, J. Hu, A. Zeng, R. Richards and J. Hu, Triplex Au–Ag–C core–shell nanoparticles as a novel raman label, Adv. Funct. Mater., 2010, 20, 969–975 CrossRef CAS.
- C. Wang, Y. Chen, T. Wang, Z. Ma and Z. Su, Adv. Funct. Mater., 2008, 18, 355 CrossRef CAS.
- D. S. Grubisha, R. J. Lipert, H. Y. Park, J. Driskell and M. D. Porter, Anal Chem., 2003, 75, 5936 CrossRef CAS PubMed.
- Y. S. Huh, A. J. Chung and D. Erickson, Microfluid. Nanofluid., 2009, 6, 285 CrossRef CAS.
- K. V. Kong, W. K. Leong, Z. Lam, T. Gong, D. Goh, W. K. Lau and M. Olivo, Small, 2014, 10, 5180 CrossRef.
- K. J. Yoon, H. K. Seo, H. Hwang, D. Pyo, I. Eom, J. H. Hahn and Y. M. Jung, Bull. Korean Chem. Soc., 2010, 31, 1215 CrossRef CAS.
- Y. Wang, B. Yan and L. Chen, Chem. Rev., 2013, 113, 1391 CrossRef CAS PubMed.
- T. B. Martins, R. Burlingame, C. A. von Muhlen, T. D. Jaskowski, C. M. Litwin and H. R. Hill, Clin. Diagn. Lab. Immun., 2004, 11, 1054 CAS.
- J. W. Pickering, T. B. Martins, M. C. Schroder and H. R. Hill, Clin. Diagn. Lab. Immun., 2002, 9, 872 CAS.
- H. J. Lee, A. W. Wark and R. M. Corn, Analyst, 2008, 133, 975 RSC.
- M. S. T. Gonçalves, Chem. Rev., 2009, 109, 190 CrossRef PubMed.
- R. S. Rao, S. R. Visuri, M. T. McBride, J. S. Albala, D. L. Matthews and M. A. Coleman, J. Proteome Res., 2004, 3, 736 CrossRef CAS PubMed.
- C. Gao, S. Mao, C. H. Lo, P. Wirsching, R. A. Lerner and K. D. Janda, Proc. Natl. Acad. Sci. U. S. A., 1999, 96, 6025 CrossRef CAS.
- C. Xie and G. Wang, J. Clin. Lab. Anal., 2011, 25, 37 CrossRef CAS PubMed.
- H. Adel Ahmed and H. M. E. Azzazy, Biosens. Bioelectron., 2013, 49, 478 CrossRef CAS PubMed.
- C. C. Lin, J. H. Wang, H. W. Wu and G. B. Lee, J. Assoc. Lab. Autom., 2010, 15, 253 CrossRef CAS.
- A. I. Barbosa, P. Gehlot, K. Sidapra, A. D. Edwards and N. M. Reis, Biosens. Bioelectron., 2015, 70, 5 CrossRef CAS PubMed.
- K. Hanaoka, Chem. Pharm. Bull., 2010, 58, 1283 CrossRef CAS PubMed.
- I. Hemmilä and V. Laitala, J. Fluoresc., 2005, 15, 529 CrossRef PubMed.
- A. K. Hagan and T. Zuchner, Anal. Bioanal. Chem., 2011, 400, 2847 CrossRef CAS PubMed.
- P. J. O'Sullivan, M. Burke, A. E. Soini and D. B. Papkovsky, Nucleic Acids Res., 2002, 30, e114 CrossRef.
- A. Scorilas, A. Bjartell, H. Lilja, C. Moller and E. P. Diamandis, Clin. Chem., 2000, 46, 1450 CAS.
- H. Härmä, T. Soukka and T. Lövgren, Clin. Chem., 2001, 47, 561 Search PubMed.
- Q. Zhu, Y. Chai, Y. Zhuo and R. Yuan, Biosens. Bioelectron., 2015, 68, 42 CrossRef CAS PubMed.
- M. Ferrari, Nat. Rev. Cancer, 2005, 5, 161 CrossRef CAS PubMed.
- S. Hede and N. Huilgol, J. Cancer Res. Ther., 2006, 2, 186 CrossRef CAS.
- M. G. Weller, Fresenius’ J. Anal. Chem., 2000, 366, 635 CrossRef CAS PubMed.
- A. J. Cuzzubbo, T. P. Endy, A. Nisalak, S. Kalayanarooj, D. W. Vaughn, S. A. Ogata, D. E. Clements and P. L. Devine, Clin. Diagn. Lab. Immunol., 2001, 8, 1150 CAS.
- G. Liu, Y. Y. Lin, J. Wang, H. Wu, C. M. Wai and Y. Lin, Anal. Chem., 2007, 79, 7644 CrossRef CAS PubMed.
- M. N. Hochmeister, B. Budowle, O. Rudin, C. Gehrig, U. Borer, M. Thali and R. Dirnhofer, J. Forensic Sci., 1999, 44, 1057 CAS.
- C. Fernández-Sánchez, C. J. McNeil, K. Rawson, O. Nilsson, H. Y. Leung and V. Gnanapragasam, J. Immunol. Methods, 2005, 307, 1 CrossRef PubMed.
- T. W. Chang, J. Immunol. Methods, 1983, 65, 217 CrossRef CAS.
- E. J. Cho, J. R. Collett, A. E. Szafranska and A. D. Ellington, Anal. Chim. Acta, 2006, 564, 82 CrossRef CAS PubMed.
- C. Lin, E. Katilius, Y. Liu, J. Zhang and H. Yan, Angew Chem., Int. Ed., 2006, 45, 5296 CrossRef CAS PubMed.
- S. Lee, S. Kim, J. Malm, O. C. Jeong, H. Lilja and T. Laurell, Anal. Chim. Acta, 2013, 796, 108 CrossRef CAS PubMed.
- T. Kodadek, Chem. Biol., 2001, 8, 105 CrossRef CAS PubMed.
- Y. Lee, E. K. Lee, Y. W. Cho, T. Matsui, I.-C. Kang, T. Kim and M. H. Han, Proteomics, 2003, 3, 2289 CrossRef CAS PubMed.
- S. W. Oh, J. D. Moon, H. J. Lim, S. Y. Park, T. Kim, J. B. Park, M. H. Han, M. Snyder and E. Y. Choi, FASEB J., 2005, 19, 1335 CAS.
- A. Vickers, A. Cronin, M. Roobol, C. Savage, M. Peltola, K. Pettersson, P. T. Scardino, F. Schroder and H. Lilja, J. Clin. Oncol., 2010, 28, 2493 CrossRef PubMed.
- S. A. Strope and G. L. Andriole, J. Clin. Oncol., 2010, 28, 2491 CrossRef PubMed.
- S. W. Lee, K. Hosokawa, S. Kim, T. Laurell and M. Maeda, Sens. Biosens. Res., 2015, 3, 105 Search PubMed.
- M. Zhou and I. Ghosh, Biopolymers, 2007, 88, 325 CrossRef CAS PubMed.
- B. Sun, W. Xie, G. Yi, D. Chen, Y. Zhou and J. Cheng, J. Immunol. Methods, 2001, 249, 85 CrossRef CAS PubMed.
- Y. G. Qu, Q. Zhang, Q. Pan, X. D. Zhao, Y. H. Huang, F. C. Chen and H. L. Chen, Int. J. Nanomed., 2014, 9, 5771 CAS.
- X. Michalet, et al. , Science, 2005, 307, 538 CrossRef CAS PubMed.
- J. Weng and J. Ren, Curr. Med. Chem., 2006, 13, 897 CrossRef CAS PubMed.
- H. Y. Song, et al. , Lab Chip, 2014, 15, 253 RSC.
- E. Phizicky, P. I. H. Bastiaens, H. Zhu, M. Snyder and S. Fields, Nature, 2003, 422, 208 CrossRef CAS PubMed.
- J. L. Richens, E. A. M. Lunt, D. Sanger, G. McKenzie and P. O'Shea, J. Proteome Res., 2009, 8, 5103 CrossRef CAS PubMed.
- S. B. Nimse, K. S. Song, M. D. Sonawane, D. R. Sayyed and T. Kim, Sensors, 2014, 14, 22208 CrossRef PubMed.
- C. Boozer, J. Ladd, S. Chen, Q. Yu, J. Homola and S. Jiang, Anal. Chem., 2004, 76, 6967 CrossRef CAS PubMed.
- R. Wacker and C. M. Niemeyer, ChemBioChem, 2004, 5, 453 CrossRef CAS PubMed.
- K. Song, et al. , Chem. Commun., 2011, 47, 7101 RSC.
- S. B. Nimse, et al. , Bull. Korean Chem. Soc., 2009, 30, 1247 CrossRef CAS.
- S. B. Nimse, et al. , Bull. Korean Chem. Soc., 2011, 32, 1143 CrossRef CAS.
- S. B. Nimse, et al. , Tetrahedron Lett., 2010, 51, 2840 CrossRef CAS.
- S. B. Nimse, et al. , Tetrahedron Lett., 2010, 51, 6156 CrossRef CAS.
- K. Song, et al. , Chem. Commun., 2011, 47, 7716 RSC.
- S. B. Nimse, K. Song, J. Kim, D. R. Sayyed and T. Kim, Int. J. Mol. Sci., 2013, 14, 5723 CrossRef CAS PubMed.
- M. E. Nielsen and A. W. Partin, Rev. Urol., 2007, 9, 57 Search PubMed.
- C. J. Paller and E. S. Antonarakis, Clin. Adv. Hematol. Oncol., 2013, 11, 14 Search PubMed.
- T. E. Ahlering and D. W. Skarecky, Prostate Cancer Prostatic Dis., 2005, 8, 163 CrossRef CAS PubMed.
- D. Minardi, A. B. Galosi, L. dell'atti, M. Yehia and G. Muzzonigro, Anticancer Res., 2004, 24, 1179 CAS.
- M. McLean, T. Panzarella, P. R. Warde, M. Gospodarowicz, W. Duncan, C. Catton and R. Bissett, Clin. Oncol., 1997, 9, 226 CrossRef CAS.
- K. Michael and M. D. Brawer, Rev. Urol., 2002, 4, S2 Search PubMed.
- D. K. Lee, et al. , Korean J. Urol., 2010, 51, 358 CrossRef PubMed.
- R. Thuret, et al. , Ann. Oncol., 2008, 19, 1308 CrossRef CAS.
- D. Quesada-González and A. Merkoçi, Biosens. Bioelectron., 2015, 73, 47 CrossRef PubMed.
- P. von Lode, Clin. Biochem., 2005, 38, 591 CrossRef CAS PubMed.
| This journal is © The Royal Society of Chemistry 2016 |