
Characterization and biodegradation behavior of micro-arc oxidation coatings formed on Mg–Zn–Ca alloys in two different electrolytes
Jinhe Dou,
Guochao Gu*,
Chuanzhong Chen* and
Yaokun Pan
Key Laboratory for Liquid-Solid Structural Evolution & Processing of Materials, Ministry of Education, School of Materials Science and Engineering, Shandong University, Jing Shi Road # 17923, Jinan 250061, Shandong, PR China. E-mail: guochaogu@sdu.edu.cn; czchen@sdu.edu.cn; Fax: +86-531-88395991; Tel: +86-531-88395991
First published on 28th October 2016
Abstract
MAO coatings were obtained on self-designed Mg alloy by micro-arc oxidation process in calcium phosphate and silicate based electrolytes. Scanning electron microscopy (SEM), energy dispersive spectrometry (EDS) and X-ray diffraction (XRD) were used to analyze the microstructure, cross sectional morphology, elemental distribution and composition of the MAO coatings. The corrosion resistance of the MAO coatings was evaluated using potentiodynamic polarization tests and electrochemical impedance spectroscopy (EIS) in SBF solution. It was found that the electrolyte composition has a significant effect on the resulting coating characteristics, such as microstructure, composition, coating thickness, thus on the corrosion behavior. The corrosion resistance of the MAO coating formed in silicate electrolyte is superior at the initial immersion time while the CaP-containing coating demonstrates better corrosion behavior at the long-term time.
1. Introduction
Magnesium (Mg) and its alloys as temporary bone implants are receiving increasing attention1,2 not only because of their similar mechanical properties to natural bones and excellent biocompatibility, but also because of their biodegradability in orthopedic applications which helps the patients avoid subsequent operations.3 However, the high degradation rate of Mg alloys in physiological environments reduces the mechanical integrity of implants prematurely and produces magnesium hydroxide and hydrogen gas.4,5 These corrosion products can induce local inflammation and limit the potential biomedical applications of Mg alloys.In order to control the rapid degradation rate of Mg alloys, proper surface treatments have been carried out.6–8 Among these surface treatments, micro-arc oxidation (MAO) is one of the most prospective surface treatments to improve the corrosion resistance of Mg alloys.9,10 The properties of the coatings obtained by MAO treatment are influenced by many factors, such as the composition of Mg alloy, electrical parameter, electrolyte characteristics and etc. Among these factors, many investigations address the effects of the electrolyte characteristics on the MAO coatings. Liang et al.11 reported that MAO coating formed on AM50 alloy in Na2SiO3 electrolyte had a better corrosion resistance than those in Na3PO4 electrolyte. Cai et al.12 also reported that MAO coating deposited from phosphate based electrolytes (P coating) and silicate based electrolytes (Si coating) consisted of different phase composition and the corrosion behavior of the two coatings were quite different. However, containing calcium phosphate (CaP) MAO coatings have been previously used for biomaterials. Rare report contrasts the Si with CaP-containing MAO coating on the structure and properties.
This work addresses the characteristics of MAO coatings formed from silicate and calcium phosphate based electrolytes. A correlation of composition and microstructure was performed. The long-term electrochemical corrosion behavior of the coatings was characterized in SBF solution, and an attempt has been made to understand the degradation process of coatings with exposure to SBF solution.
2. Materials and methods
2.1. Material preparation
Alloy ingot of Mg-1.74Zn-0.55Ca was prepared by melting down high purity Mg (99.99 wt% Feixian Yinguang Magnesium Co., Ltd. Shandong, China), Zn (99.9 wt% Beijing Cuibolin Non-ferrous Technology Developing Co., Ltd. Beijing, China) and Mg–20Ca master alloys (Hunan Research and Institute of Rare Earth and Material, China), in an electric resistant furnace. CO2 with 0.5% SF6 was used as a protective gas to prevent burning during melting and casting. The melt was held at 750 °C for 30 min to ensure the complete dissolution of all the required alloying elements. The melt was stirred for 15 min and after cooled down to 680–700 °C. Then, it was cast into a graphite mold which was preheated up to 200 °C. The ingot was subjected to homogenization for 14 h at 400 °C.Samples used in the experiment were cut into cuboid shape with dimension of 8 × 8 × 6 mm3 by electric spark machining and were polished down to 1000 grit with silicon-carbide paper. Afterward, the samples underwent sonication in distilled water for 10 min and then dried in warm air.
2.2. MAO coatings preparation
The micro-arc oxidation process was carried out using a WHD-30 high-power pulsed bi-polar electrical source in an alkaline silicate electrolyte and an alkaline phosphate electrolyte. The silicate (Si) electrolyte was prepared using Na2SiO3·9H2O (15.0 g L−1) in distilled water, and the calcium-phosphate (CaP) electrolyte was prepared using (C3H7O6P)Ca (calcium glycerophosphate) (7.5 g L−1) and (NaPO3)6 (7.5 g L−1) in distilled water with the addition of KOH (5 g L−1), NH4HF2 (7 g L−1), C3H8O3 (7.5 mL L−1), respectively. The MAO process was carried out for 10 min, below 30 °C in a 3-l cylindrical water-cooled stainless steel tank which served as the counter electrode. The magnesium substrate which was immersed in the electrolyte was used as the anode. During the MAO process, the positive constant voltage, duty cycles, negative duty cycles and the pulse frequency were 400 V, 30%, 20% and 600 Hz, respectively. All coated samples were rinsed in distilled water and dried at room temperature after the MAO treatment.2.3. Characterization
Microstructural observations of the Mg-1.74Zn-0.55Ca were performed on an optical microscope (Leica MeF3A, Germany). The surface and cross-sectional morphologies were observed by field-emission scanning electron microscopy (FEI, Nova NanoSEM 450, Netherlands). An energy dispersive X-ray (EDX) attachment was used to evaluate relative contents of chemical elements present in the surface. The chemical structure characteristic was detected by Fourier transform infrared spectroscopy (Bruker Tensor-37, Germany) in the scanning range of 4000–400 cm−1 at a resolution of 4 cm−1 using the KBr pellet method. The phase structure of samples was characterized by X-ray diffraction (Shimadzu XRD-6100, Japan) with Cu-Kα radiation at a scanning speed of 2° min−1.2.4. Electrochemical corrosion test
Electrochemical tests were carried out on an electrochemical workstation (IM6, Zahner, Germany) to evaluate the corrosion behavior of the MAO coatings. A typical three electrode cell was employed, namely the sample as a working electrode, a saturated calomel electrode (SCE) as reference electrode and a platinum foil as counter electrode. Aluminium wires were connected to all the tested samples which were sealed with epoxy resign, exposing 0.64 cm2 area of research surface. The electrolyte was simulated body fluid (SBF) solution (Table 1), which has the ion concentration closed to the blood plasma in the human body. Prior to the potentiodynamic polarization measurement, all the samples were stabilized in SBF solution at 36.5 °C for 30 min. Potentiodynamic polarization curves were recorded ranging from −3000 mV to 1000 mV relative to the SCE at a scan rate of 1 mV s−1 electrochemical impedance spectroscopy (EIS) measurements were performed at the open circuit potential with a 10 mV of sinusoidal perturbing signal over a frequency range of 10 mHz to 100 kHz. ZView 3.10 software was used for the data fitting of impedance spectra.| Components | Concentration |
|---|---|
| NaCl | 7.996 g L−1 |
| NaHCO3 | 0.350 g L−1 |
| KCl | 0.224 g L−1 |
| K2HPO4·3H2O | 0.228 g L−1 |
| MgCl2·6H2O | 0.305 g L−1 |
| HCl (1 mol L−1) | 40 mL L−1 |
| CaCl2 | 0.278 g L−1 |
| Na2SO4 | 0.071 g L−1 |
| (CH2OH)2CNH2 | 6.051 g L−1 |
2.5. Immersion degradation test
The degradation behavior of the specimens was investigated by immersion test in SBF. Each sample was socked in a sealed polyethylene bottle with an immersion ratio of 0.08 cm2 mL−1 and thermostatted at 36.5 °C. The immersion solutions were refreshed every day to simulate the real in vivo condition. Samples were collected from the solution after 1, 3, 6, 12 and 18 days immersion respectively, and washed with distilled water and dried in an oven at 60 °C for 4 h. Then the samples were weighed and the corrosion rate was calculated using weight loss percentage according to the following equation: weight loss (%) = (Wt − W0)/(W0) × 100%, where Wt is the dry weight at time and W0 is the initial dry weight. The pH variation of the soaking solutions was determined with a pH meter during the immersion test. The results represent the mean ± standard deviation (SD) of three samples for each time point.3. Results and discussion
3.1. Surface and cross sectional morphologies of coatings
The microstructure of the Mg-1.74Zn-0.55Ca after etching was performed on an optical microscope (Fig. 1(a)). It can be seen that the Mg-1.74Zn-0.55Ca alloy is mainly consisted of the α-Mg phase and the intermetallic compounds Mg2Ca dispersed in the grain interiors and at the grain boundaries, in which the Zn atoms are solid-soluted. | ||
| Fig. 1 Optical morphology of the microstructure of Mg-1.74Zn-0.55Ca (a); surface morphology and EDS results of the MAO coatings: (b) CaP-containing coating and (c) Si-containing coating. | ||
Fig. 1 reveals the surface morphology of the CaP-containing and Si-containing coatings, with corresponding EDS spectrum. A typical crater-like porous surface morphology with micro-pores distributed on the MAO coating can be observed in Fig. 1(b) and (c). This configuration could be explained by the gas liberation and discharge events during the MAO process.13 It should be noted that the number and size of the pores on the surface of the two MAO coatings seem to be distinctly different. The CaP-containing coating has a few large-size (7 to 21 μm in diameter) but small-number pores on the surface, whereas the Si-containing coating exhibits relatively small-size (5 to 10 μm in diameter) but large-number pores on the surface. There are numerous fine (<2 μm) on the surface of the two different MAO coatings pores. This phenomenon was also observed by other researchers.11,14 It has been demonstrated that the larger pores appear to represent traces of discharge channels and the smaller pores could be formed as a result of gas release from the deposited products during post-discharge cooling. In addition, some cracks are also observed on the edges of pores on the two MAO coatings, which are possibly caused by the thermal stresses during coating growth. It is evident that the cracks on the CaP-containing coating are more and longer in the range than that on the Si-containing coating.
The elemental surface distribution of MAO coatings were analyzed by EDS. According to the results, the CaP-containing coating is mainly composed of O, Mg, P, F and Ca. For the Si-containing coating, the main elements on the coating contain O, F, Mg, Si, and Zn. The elements of Mg, Zn come from substrate and the elements of O, Si, P, F and Ca come from electrolyte.
The cross-sectional morphologies and EDS line-scan of CaP-containing and Si-containing coatings are shown in Fig. 2. It is obvious that CaP-containing coating (29 ± 3 μm) has lower thickness than Si-containing coating (36 ± 3 μm). Both MAO coatings prepared in the present study contain two layers, an outer porous layer and an inner compact layer. Furthermore, the inner layer of Si-containing coating is relatively more even and thicker compared to that of CaP-containing coating. It should be noted that there are not fracture sites in the inner layer for both coatings, suggesting that the adhesion between the coating and substrate will be good. The EDS line-scan of the coating reveals that the inner layer of CaP-containing coating mainly contains Mg, P and O while that of Si-containing coating mainly contains Mg and F. The different element distribution of inner layer may be due to different reactivity of Mg2+ with ions of electrolyte. On the other hand, the relative amount of element in the outer layer is consistent with the elemental surface distribution in Fig. 1.
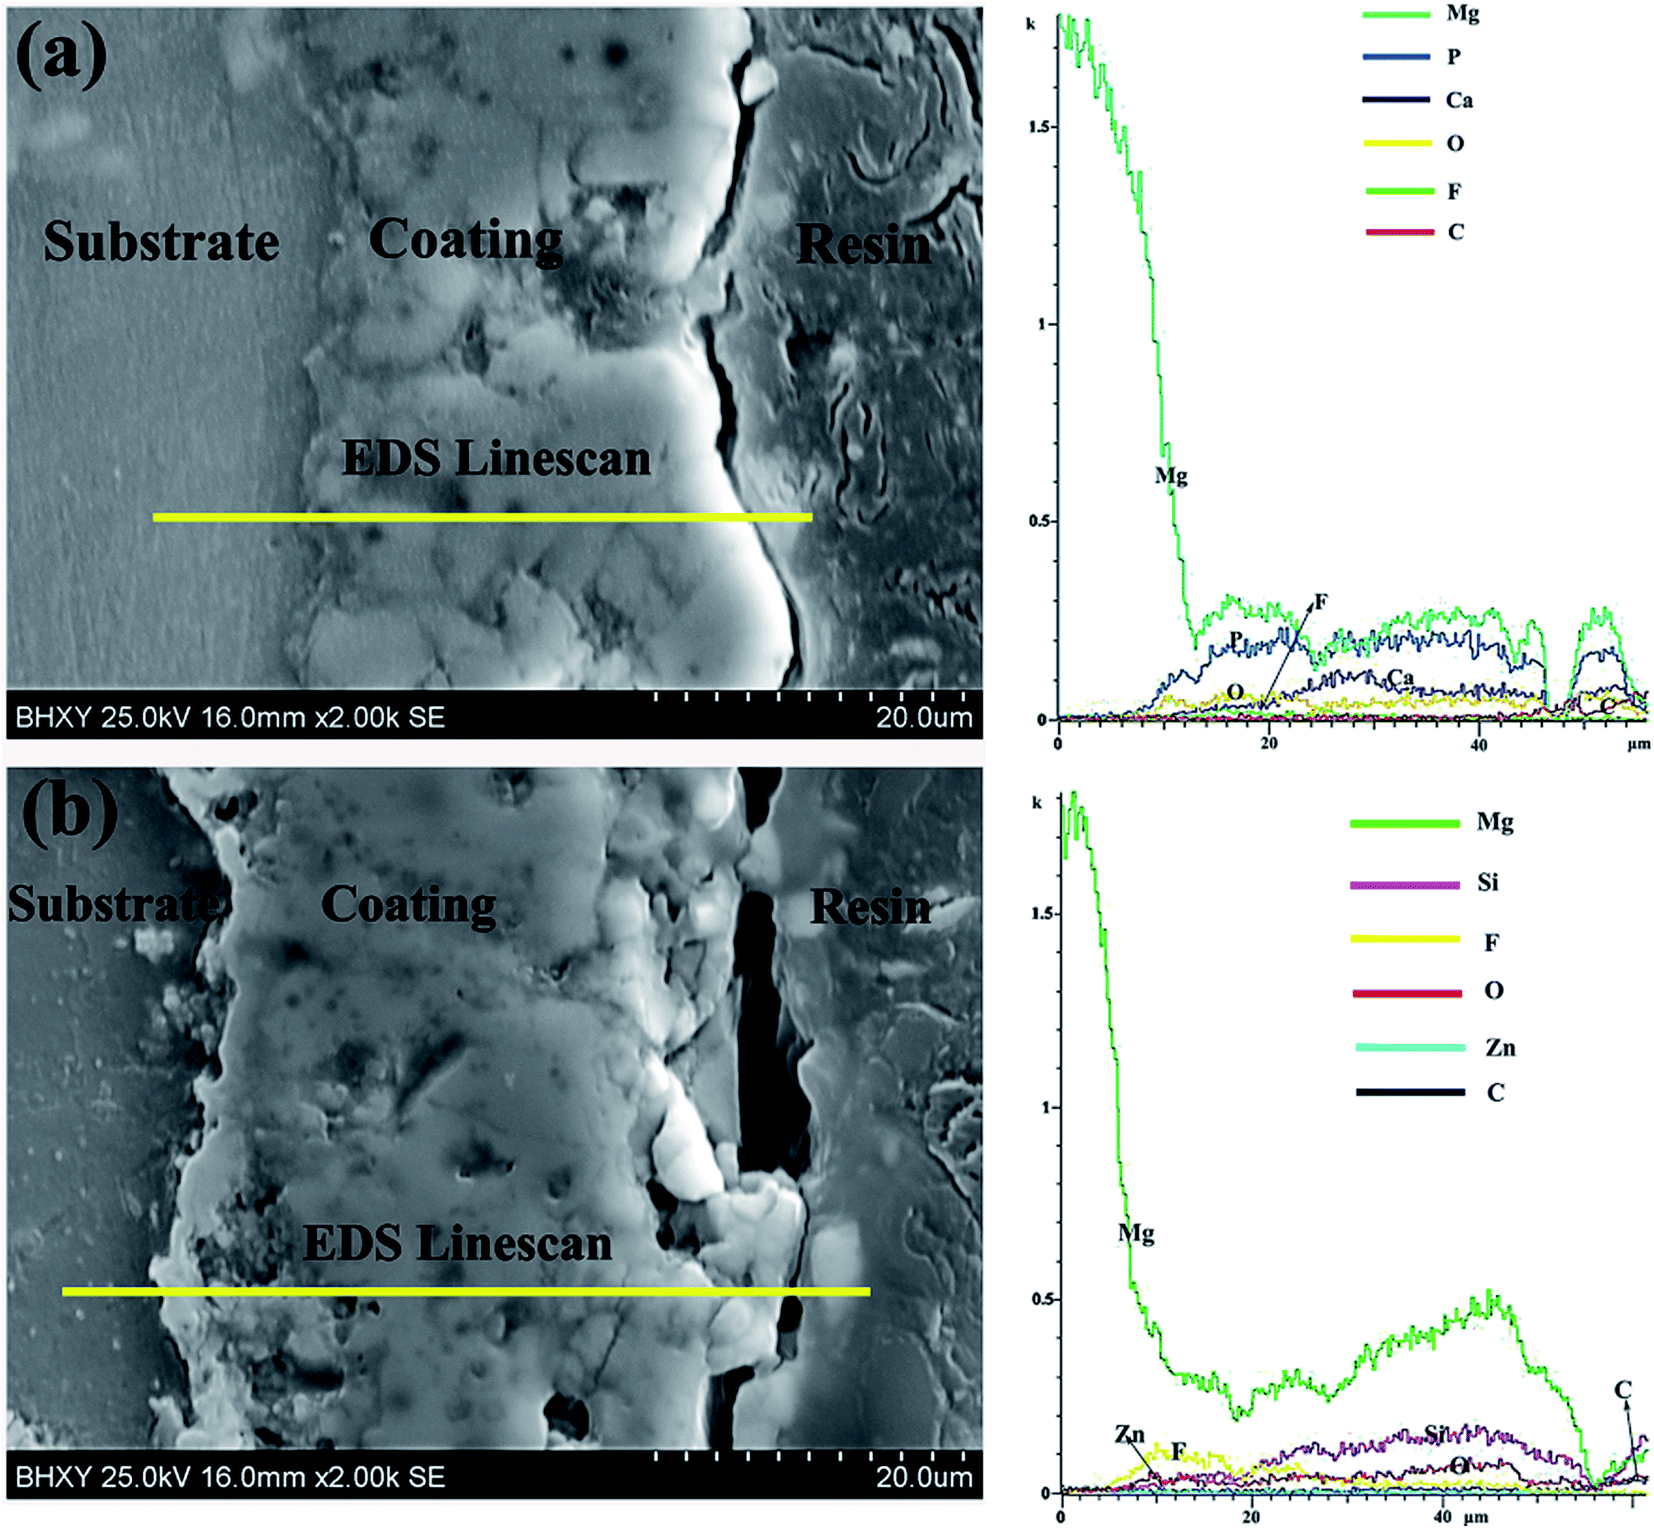 | ||
| Fig. 2 Cross-sectional morphologies and EDS line-scan of coatings produced in the CaP-containing electrolyte (a) and in the Si electrolyte (b). | ||
3.2. Phase composition
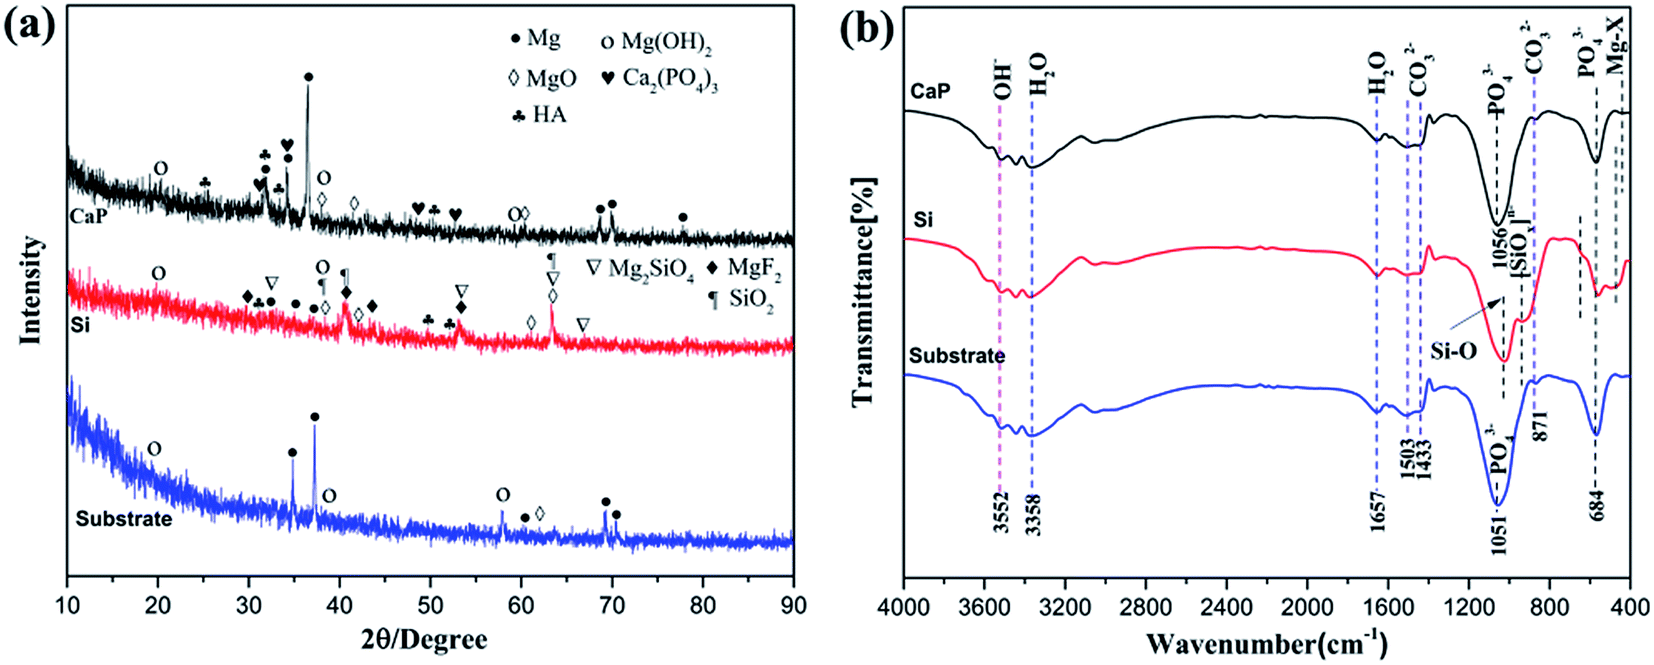
Fig. 3(a) illustrates X-ray diffraction results of Mg alloys before and after micro-arc oxided in the silicate and calcium phosphate electrolyte. For coatings produced in the silicate electrolyte, major phases are found to be Mg2SiO4, SiO2, MgF2 and MgO while the coatings produced in the calcium phosphate solution consists of Ca3(PO4)2, Ca2P2O7, MgF2 and MgO, respectively. Moreover, the intensities of Mg peaks at 2 theta values of 47.8 and 67.9 are much lower in the CaP-containing coating than Si-containing coating, which is attributed to the bigger pore diameter (Fig. 1) and the higher thickness (Fig. 2) of the coating. | ||
| Fig. 3 XRD patterns of the CaP-containing coating, Si-containing coating and the substrate (a) and FT-IR spectra of the CaP-containing and Si-containing coating (b). | ||
To ascertain the phases of the coatings, the FT-IR spectra of the samples were obtained for chemical composition. The FT-IR spectra represent a similar characterization at some place, suggesting that the two MAO coatings contain some same functional groups. The band at 467 cm−1 are attributed to the presence of Mg–X (X = O or F)15 and the band at 1630 cm−1 can be ascribed to the H–O–H bending mode of crystal water.16,17 The major difference between the CaP-containing and Si-containing coating is the absence of PO43− and SiO42−. For the CaP-containing coating, absorption bands at 1062 and 573 cm−1 are responsible for PO43− group.18 For the Si-containing coating, the wide absorption band at 908 cm−1 are indexed to the O–Si–O stretching mode.17,19 In addition, sharp band at 1004 cm−1 are indexed to the Si–O asym-metric stretching mode and absorption band at 621 cm−1 are assigned to Si–O bending vibration mode.19 The FTIR spectra show the peak, which agrees well with the results obtained by XRD.
3.3. Corrosion behavior
 | ||
| Fig. 4 Potentiodynamic polarization curves (a) and electrochemical impedance behavior (Nyquist (b) and Bode plots (c)) of the two MAO coatings and Mg substrate in SBF solution at 36.5 ± 0.5 °C. | ||
The impedance plots and the fitting results are shown in Fig. 4(c). The corrosion resistance of the samples is qualitatively comparable through the value of impedance modulus (|Z|) in the Bode plots considering that a higher value of |Z| usually indicates a higher corrosion resistance.22,28 According to the Bode plot of |Z| vs. frequency, it is observed that the value of |Z|f → 0 for the substrate is the lowest impedance magnitude (less than 100 Ω cm2), indicating the worst corrosion resistance. Whereas, the highest value of the impedance magnitude (∼6 × 10³ Ω cm2) can be seen on the Si-containing coating, which means it has the best anti-corrosion performance. Furthermore, the value of |Z|f → 0 for the CaP-containing coating (∼5 × 10³ Ω cm2) is close to that for Si-containing coating and far larger than that for the substrate. These results are in good agreement with the potentiodynamic polarization curves.
In order to understand the corrosion processes of MAO coating, EIS were measured at hourly intervals for MAO coatings at open circuit potential in SBF solution. The Nyquist plots for the CaP-containing and Si coating for various hours are shown in Fig. 4(a) and 5(b), respectively. After immersion, the EIS plots of MAO coatings change, an low frequency capacitive loop is appeared. Usually, the low frequency region in EIS contains important information on the electrode controlled process together with the contribution from localized defects to the overall impedance.29 The low frequencies in this study is probably attributed to a diffusion process across the corrosion layer on the surface.
 | ||
| Fig. 5 Nyquist plots of (a) CaP-containing coating and (b) Si-containing coating in SBF solution at 36.5 ± 0.5 °C for various hours; equivalent circuit employed to fit the impedance data (c) and (d). | ||
A common equivalent circuits (ECs)30–32 for fitting the EIS plots of MAO coating are shown in Fig. 5(c) and (d). The corresponding EIS data based on these equivalent circuits are listed in Tables 2 and 3. In the ECs, Rs is the resistance of the solution between the reference and working electrode. Rp and Rf represent the outer porous layer and inner resistance of the MAO coating, respectively. Qc, one of the constant phase element (CPE) components, is used to describe the capacitive behaviour of the outer porous layer of MAO coatings. Qf represent CPE corresponding to inner layer of MAO coating. Qdl, another CPE component, illustrates imperfect capacitance of the double layer between alloy and the electrolyte solution. Rct is the resistance of the coating-substrate interface, which is a key parameter to analyse the impedance of the corrosion reaction.32 It could be seen from Tables 2 and 3 that the value of Rct for all the coatings was higher than the corresponding value of Rp and Rf, irrespective of the immersion time. This indicates that the interface layer between the inner layer and the substrate is primarily responsible for protecting the Mg alloy from corrosion during the immersion. For the CaP-containing coating, the Rct value decreases a lot after 12 h immersion time compared with that of MAO coating without immersion. The steep decrease of the Rct value suggests that the corrosive SBF penetrates the outer porous layer through the pores, reaches the inner layer and reacts with the substrate, thus causing the MAO coating to degrade rapidly. A steep increase in the Rct value after 24 h immersion time suggests that the formation of partially covered corrosion products layer on sample surface. Then the Rct value shows a tiny drop after 5 h immersion time. For the Si-containing coating, it can be observed that the Rct value decreases at the beginning immersion of 24 h and then increases after 48 h immersion time.
| Time (h) | Rs (Ω cm2) | Rp (Ω cm2) | Qc (Ω−1 cm−2 Sn) | Rf (Ω cm2) | Qf (Ω−1 cm−2 Sn) | Rct (Ω cm2) | Qdl (Ω−1 cm−2 Sn) |
|---|---|---|---|---|---|---|---|
| 0 | 22.21 | 177.0 | 1.745 × 10⁻⁶ | 4914.0 | 1.427 × 10⁻⁶ | — | — |
| 12 | 18.90 | 14.76 | 4.838 × 10⁻⁵ | 114.20 | 2.621 × 10⁻⁵ | 140.4 | 1.344 × 10⁻³ |
| 24 | 20.50 | 39.35 | 3.140 × 10⁻⁶ | 121.40 | 3.156 × 10⁻⁵ | 551.7 | 3.577 × 10⁻³ |
| 48 | 21.24 | 13.46 | 4.859 × 10⁻⁵ | 39.28 | 2.440 × 10⁻⁵ | 352.4 | 1.876 × 10⁻³ |
| Time (h) | Rs (Ω cm2) | Rp (Ω cm2) | Qc (Ω−1 cm−2 Sn) | Rf (Ω cm2) | Qf (Ω−1 cm−2 Sn) | Rct (Ω cm2) | Qdl (Ω−1 cm−2 Sn) |
|---|---|---|---|---|---|---|---|
| 0 | 25.28 | 516.60 | 4.734 × 10⁻⁶ | 6596.0 | 2.962 × 10⁻⁶ | — | — |
| 12 | 20.21 | 61.59 | 1.761 × 10⁻⁵ | 324.50 | 4.183 × 10⁻⁵ | 445.6 | 2.335 × 10⁻³ |
| 24 | 24.90 | 40.35 | 1.008 × 10⁻⁵ | 32.70 | 3.156 × 10⁻⁵ | 326.1 | 1.567 × 10⁻³ |
| 48 | 22.32 | 13.46 | 4.859 × 10⁻⁵ | 33.16 | 2.476 × 10⁻⁵ | 332.9 | 1.946 × 10⁻³ |
3.4. Immersion degradation behavior
For an orthopedic biomaterial, the CaP-containing precipitation on the surface is an important factor for evaluation of the bone implant's bioactivity.33,34 Hence, in vitro immersion test was chosen to judge the bone growth activity of the samples.Fig. 6 shows SEM morphology and EDS of the CaP-containing coating (a), Si-containing coating (b) and Mg substrate (c) samples after 18 days immersion in the SBF solution. It can be seen from Fig. 6(a) that white particle precipitations in cauliflower-like structure are found deposited on the CaP-containing coating surface. As shown in Fig. 6(b), large spherical structures which combine with each other are observed on the Si-containing coating. It is also found that the pore characteristics can still be seen on the CaP-containing and Si-containing coating surface after immersed in SBF solution for 18 days, but the pore number has obviously decreased when compared with that on the MAO surface (Fig. 1). In addition, there are some cracks on the precipitation coatings, which are caused by dehydration after removing from SBF solution.35,36 According to Fig. 6(c), block precipitations seem to be localized around cracks at the surface of the Mg substrate. The observed cracks attribute to corrosion of the Mg substrate.37 According to the EDS analysis, the precipitated white particles mainly contain of O, C, Ca and P elements. This indicates that the white particles will be the apatite deposition. Additionally, as shown in Fig. 6, the amount of apatite formed on the surface of the MAO coating after SBF immersion for 18 days appears to be greater than that of Mg alloy. These results indicate that the surface produced by MAO treatment have higher potential to induce apatite formation than that of Mg alloy.
 | ||
| Fig. 6 Surface morphology and EDS results of the samples after 18 days immersion in SBF solution at 36.5 ± 0.5 °C: (a) CaP-containing coating, (b) Si-containing coating and (c) Mg substrate. | ||
X-ray diffraction (XRD) and FTIR measurement are employed to identify the phase constituents and chemical structure in corrosion product layer and the results are shown in Fig. 7. For CaP-containing coating (Fig. 7(a)), the initial MgO, MgF2, and Ca3(PO4)2 content is reduced, the initial phase Ca2P2O7 disappears. In addition, new phases Mg(OH)2 and HA appear. For Si-containing coating, the peak intensity of MgO, MgF2, Mg2SiO4 and SiO2 is rather lower while the new phases Mg(OH)2 and HA are identified. For the substrate, the new phases Mg(OH)2 appear and the peaks of HA are not fount. It is noteworthy that amorphous phases corrosion products appear below 20° (2θ) for all samples.
 | ||
| Fig. 7 XRD patterns (a) and FT-IR spectra (b) of the CaP-containing coating, Si-containing coating and the substrate after immersion in SBF for 18 days. | ||
FT-IR spectra of the CaP-containing and Si-containing coating after 18 days of immersion in SBF are depicted in Fig. 7(b). The band at 3552 cm−1 is corresponding to Mg(OH)2 as the corrosion product.38 The broad absorption band at 3358 cm−1 is attributed to the stretching absorption mode of the hydroxyl group and the band at 1657 cm−1 is due to the H–O–H bending mode of crystal water. Absorption bands at 1503, 1433 and 871 cm−1 correspond to carbonates. The peak at 1056, 1501 and 684 cm−1 corresponding to the stretching vibration peak of P–O appears.39 It is noted that the 684 cm−1 which corresponds the P–O group is discovered for the CaP-containing and Si-containing coating. Thus, based on all the results of the presence of Ca and P (according to EDS analysis) and PO43−(according to FTIR analysis) may confirm that the precipitated particles contain of calcium phosphate compositions.31,36 This apatite formation indicates the good bioactivity and osteoconductivity of the MAO coatings due to the excellent biocompatibility and bioactivity of apatite.40,41
In order to evaluate the biodegradability of the MAO coatings and the substrate samples, in vitro tests were carried out in SBF solution at 36.5 °C for 18 days. Fig. 8(a) shows the weight loss of each sample immersed in SBF solution. For all the samples, the weight loss increases with increasing of immersion time. In addition, the weight loss of the substrate is significantly higher than that of the MAO coatings and the CaP-containing coating presents the lowest weight loss percentage in almost the selected immersion times. It is noted that the weight loss ratio of Si-containing coating reached 0.71 wt% after immersed for 1 day, compared with 0.80 wt% for CaP-containing coating.
 | ||
| Fig. 8 Immersion test results of the different samples at different intervals: weight loss (a) and pH value (b). | ||
Fig. 8(b) shows the pH variation of MAO coating and substrate in the SBF solutions as a function of immersion time. A same trend is observed in the pH value for all samples. The pH value increases rapidly at initial immersion stage, then decreases slowly and reaches a stable value in further immersion time. The initial increase of pH value for substrate is due to the corrosion reaction of magnesium: Mg + 2H2O → Mg2+ + 2OH− + H2(g) and the produced OH− increases the pH value of the local ambient.30 Later on, the precipitation of corrosion products leads to a decrease in pH value. It is interesting that the pH value of CaP-containing coating is higher than that of Si-containing coating at initial 48 h immersion while is lower than that of Si-containing coating at following immersion time. This indicates that the corrosion rate agrees with the results of the weight loss, potentiodynamic polarization curves (Fig. 4) and EIS plots (Fig. 5). These results imply that CaP-containing coating degrades faster than Si-containing coating at initial immersion time while degrades lower with longer immersion time.
Previous studies have demonstrated the degradation process of the CaP-containing42,43 and Si17,44 coating, respectively. The contrast between the two coatings has rarely been reported. Recently, Liang11 compared the degradation process between Si-containing coating and P coating 0.1 M NaCl solution. However, the composition of SBF is much more sophisticated than NaCl solution and the degradation processes is influenced by the synergetic effect of the thickness, structures and phase composition of the coatings.17,44–46 Based on the examination of surface and cross-section morphologies, characteristics of the corroded surface and the electrochemical corrosion results, the degradation processes of CaP-containing and Si-containing coatings in SBF solution could be explained as follows.
A degradation mechanism of the porous MAO coating on Mg alloys in SBF is schematically illustrated in Fig. 9. Analysis shows that the degradation process of MAO coatings in SBF solution could be divided into four stages: (1) the corrosive fluids penetrate through the micropores and microdefects in the outer porous layer to reach the inner dense layer, leading to the degradation of the inner compact layer (Fig. 9(a)). (2) Phases in the coating degrade progressively and react with ions in the fluids (Fig. 9(b)). (3) The corrosive SBF solution reaches the interface layer between the inner layer and the substrate, then the substrate is corroded (Fig. 9(b)). (4) The corrosion products, e.g. magnesium hydroxide and apatite, suppress the further degradation by inhibiting the diffusion and the transport of the SBF to the substrate (Fig. 9(c) and (d)). These four processes could occur almost simultaneously and interact with each other to influence the performance of the coatings.
 | ||
| Fig. 9 Schematic illustrations of degradation mechanism of the porous MAO coating on Mg alloys in SBF. | ||
For CaP-containing coating, the bigger micropores and more microdefects (Fig. 1(a)) lead to the corrosive fluids reaching the inner layer more easier compared with Si-containing coating. The corrosion rate of the sample at this time mostly depends on the morphology of the coating, which is verified by the different corrosion resistances and weight loss. Consequently, the CaP-containing coating is vulnerable to get destroyed. The MgO phase in the coating first degrades to generate Mg(OH)2 which increases of pH value at this immersion stage.44 Meanwhile, an increasing number of precipitates are gradually deposited on the coating. At this time, the corrosion rate of the sample will accelerate or decelerate, not only depends on the primary morphology but also the coating composition. For CaP-containing coating, Ca3(PO4)2 and Ca2P2O7 phases in the coating will react with H+ ions to release Ca2+ and PO43− ions into the SBF solution which is a supersaturated solution with Ca2+ and PO43− ions. The consumption of H+ ions causes an increase of pH value. Thus, Ca2+, PO43−, OH− and the other ions concentrate in the pitting/solution interfaces. Meantime, rough areas with large specific surface areas are beneficial overall for the nucleation of apatite in SBF solution. Once the nucleation formed, apatite grew gradually at the expense of Ca2+, PO43− and OH− ions absorbed in apatites/solution interface. In the case of Si-containing coating, the coating contains Mg2SiO4 and SiO2 which cannot provide the extra ions of Ca2+ and PO43− in the later immersion period. The apatite comes only from the deposition of Ca2+ and PO43− in the SBF solution. This lead to the less corrosion products and higher corrosion rate compared with CaP-containing coating in the later immersion period.
4. Conclusion
Different MAO coatings were produced on self-design Mg alloy in calcium phosphate and silicate electrolytes, respectively. Several conclusions were obtained:(1) MAO coatings obtained from silicate electrolyte have relatively lower thickness with smaller pores and less cracks compared to the calcium phosphate based coatings.
(2) After immersion test in SBF for 18 days, the formation of apatite suggests MAO coatings have bioactivity for orthopedic applications.
(3) The corrosion resistance of the Si-containing MAO coatings was superior at the initial immersion time. The smaller pores and less cracks are the plausible reasons for the superior corrosion resistance in the short-term immersion.
(4) The corrosion resistance of the CaP-containing MAO coatings was superior at the long-term time. The phase composition of the CaP-containing coating is a critical factor controlling the long-term protective ability of the coating.
Acknowledgements
This work is financed by Development Project of Science and Technology of Shandong Province (Grant No. 2010GSF10627) and Provincial Natural Science Foundation of Shandong (Grant No. 2015ZRE27487).References
- F. Witte, V. Kaese, H. Haferkamp, E. Switzer, A. Meyer-Lindenberg, C. J. Wirth and H. Windhagen, Biomaterials, 2005, 26, 3557–3563 CrossRef CAS PubMed.
- F. Witte, J. Fischer, J. Nellesen, H. Crostack, V. Kaese, A. Pisch, F. Beckmann and H. Windhagen, Biomaterials, 2006, 27, 1013–1018 CrossRef CAS PubMed.
- J. Nagels, M. Stokdijk and P. M. Rozing, J. Shoulder. Elbow. Surg., 2003, 12, 35–39 CrossRef PubMed.
- S. E. Henderson, K. Verdelis, S. Maiti, S. Pal, W. L. Chung, D. Chou, P. N. Kumta and A. J. Almarza, Acta Biomater., 2014, 10, 2323–2332 CrossRef CAS PubMed.
- G. Song, Adv. Eng. Mater., 2005, 7, 563–586 CrossRef CAS.
- H. Hornberger, S. Virtanen and A. R. Boccaccini, Acta Biomater., 2012, 8, 2442–2455 CrossRef CAS PubMed.
- W. Sun, G. Zhang, L. Tan, K. Yang and H. Ai, Mater. Sci. Eng. C, 2016, 63, 506–511 CrossRef CAS PubMed.
- J. Zhang, Z. Wen, M. Zhao, G. Li and C. Dai, Mater. Sci. Eng. C, 2016, 58, 992–1000 CrossRef CAS PubMed.
- X. Wu, P. Su, Z. Jiang and S. Meng, ACS Appl. Mater. Interfaces, 2010, 2, 808–812 CAS.
- T. Sankara Narayanan, I. S. Park and M. H. Lee, Prog. Mater. Sci., 2014, 60, 1–71 CrossRef CAS.
- J. Liang, P. B. Srinivasan, C. Blawert, M. Störmer and W. Dietzel, Electrochim. Acta, 2009, 54, 3842–3850 CrossRef CAS.
- Q. Cai, L. Wang, B. Wei and Q. Liu, Surf. Coat. Technol., 2006, 200, 3727–3733 CrossRef CAS.
- Y. M. Wang, F. H. Wang, M. J. Xu, B. Zhao, L. X. Guo and J. H. Ouyang, Appl. Surf. Sci., 2009, 255, 9124–9131 CrossRef CAS.
- A. Yerokhin, E. V. Parfenov and A. Matthews, Surf. Coat. Technol., 2016, 301, 54–62 CrossRef CAS.
- G. Y. Liu, J. Hu, Z. K. Ding and C. Wang, Appl. Surf. Sci., 2011, 257, 2051–2057 CrossRef CAS.
- Q. You, H. Yu, H. Wang, Y. Pan and C. Chen, Biointerphases, 2014, 9, 31009 CrossRef PubMed.
- Y. Pan, C. Chen, D. Wang and D. Huang, Colloids Surf., B, 2014, 122, 746–751 CrossRef CAS PubMed.
- J. Dou, H. Yu, C. Chen, Y. Pan, D. Gao and X. Zhang, Mater. Lett., 2016, 164, 575–578 CrossRef CAS.
- R. A. Nyquist and R. O. Kagel, Handbook of infrared and raman spectra of inorganic compounds and organic salts: infrared spectra of inorganic compounds, Academic press, 2012 Search PubMed.
- M. Sun, A. Yerokhin, A. Matthews, M. Thomas, A. Laukart, M. von Hausen and C. Klages, Plasma Processes Polym., 2016, 13, 266–278 CrossRef CAS.
- S. Yagi, A. Sengoku, K. Kubota and E. Matsubara, Corros. Sci., 2012, 57, 74–80 CrossRef CAS.
- X. Cui, X. Lin, C. Liu, R. Yang, X. Zheng and M. Gong, Corros. Sci., 2015, 90, 402–412 CrossRef CAS.
- Z. Li, G. Song and S. Song, Electrochim. Acta, 2014, 115, 56–65 CrossRef CAS.
- M. Sun, A. Yerokhin, A. Matthews, M. Thomas, A. Laukart, M. von Hausen and C. P. Klages, Plasma Processes Polym., 2016, 13, 266–278 CrossRef CAS.
- T. S. Lim, H. S. Ryu and S. Hong, Corros. Sci., 2012, 62, 104–111 CrossRef CAS.
- X. Cui, C. Liu, R. Yang, M. Li and X. Lin, Surf. Coat. Technol., 2015, 269, 228–237 CrossRef CAS.
- F. Liu, D. Shan, Y. Song, E. Han and W. Ke, Corros. Sci., 2011, 53, 3845–3852 CrossRef CAS.
- Y. Liu, X. Yin, J. Zhang, S. Yu, Z. Han and L. Ren, Electrochim. Acta, 2014, 125, 395–403 CrossRef CAS.
- Y. Xin, T. Hu and P. K. Chu, Corros. Sci., 2011, 53, 1522–1528 CrossRef CAS.
- Y. Chen, S. Zhao, B. Liu, M. Chen, J. Mao, H. He, Y. Zhao, N. Huang and G. Wan, ACS Appl. Mater. Interfaces, 2014, 6, 19531–19543 CAS.
- Y. Pan, S. He, D. Wang, D. Huang, T. Zheng, S. Wang, P. Dong and C. Chen, Mater. Sci. Eng. C, 2015, 47, 85–96 CrossRef CAS PubMed.
- Y. Gu, S. Bandopadhyay, C. Chen, Y. Guo and C. Ning, J. Alloys Compd., 2012, 543, 109–117 CrossRef CAS.
- S. Shadanbaz and G. J. Dias, Acta Biomater., 2012, 8, 20–30 CrossRef CAS PubMed.
- M. Razavi, M. Fathi, O. Savabi, D. Vashaee and L. Tayebi, Mater. Sci. Eng. C, 2014, 41, 168–177 CrossRef CAS PubMed.
- L. Xu, F. Pan, G. Yu, L. Yang, E. Zhang and K. Yang, Biomaterials, 2009, 30, 1512–1523 CrossRef CAS PubMed.
- G. Liu, S. Tang, D. Li and J. Hu, Corros. Sci., 2014, 79, 206–214 CrossRef CAS.
- M. Alvarez-Lopez, M. D. Pereda, J. A. Del Valle, M. Fernandez-Lorenzo, M. C. Garcia-Alonso, O. A. Ruano and M. L. Escudero, Acta Biomater., 2010, 6, 1763–1771 CrossRef CAS PubMed.
- H. R. Bakhsheshi-Rad, E. Hamzah, M. Daroonparvar, M. A. M. Yajid and M. Medraj, Surf. Coat. Technol., 2014, 258, 1090–1099 CrossRef CAS.
- M. Razavi, M. Fathi, O. Savabi, D. Vashaee and L. Tayebi, Mater. Sci. Eng. C, 2014, 41, 168–177 CrossRef CAS PubMed.
- T. Kokubo and H. Takadama, Biomaterials, 2006, 27, 2907–2915 CrossRef CAS PubMed.
- F. Tavangarian and R. Emadi, Ceram. Int., 2011, 37, 2275–2280 CrossRef CAS.
- Y. K. Pan, C. Z. Chen, D. G. Wang and T. G. Zhao, Colloids Surf., B, 2014, 113, 421–428 CrossRef CAS PubMed.
- Y. Gu, C. Chen, S. Bandopadhyay, C. Ning, Y. Zhang and Y. Guo, Appl. Surf. Sci., 2012, 258, 6116–6126 CrossRef CAS.
- X. Lin, L. Tan, Q. Zhang, K. Yang, Z. Hu, J. Qiu and Y. Cai, Acta Biomater., 2013, 9, 8631–8642 CrossRef CAS PubMed.
- Y. K. Pan, C. Z. Chen, D. G. Wang and X. Yu, J. Biomed. Mater. Res., Part B, 2012, 100, 1574–1586 CrossRef CAS PubMed.
- R. F. Zhang, S. F. Zhang, J. H. Xiang, L. H. Zhang, Y. Q. Zhang and S. B. Guo, Surf. Coat. Technol., 2012, 206, 5072–5079 CrossRef CAS.
| This journal is © The Royal Society of Chemistry 2016 |