The seed stimulant effect of nano iron pyrite is compromised by nano cerium oxide: regulation by the trace ionic species generated in the aqueous suspension of iron pyrite
Chinmaya Kumar Das†
a,
Gaurav Srivastava†b,
Amarish Dubey†c,
Shourya Vermac,
Manav Saxenad,
Manas Royd,
Niroj Kumar Sethye,
Kalpana Bhargavae,
Sushil Kumar Singhf,
Sabyasachi Sarkard,
Deepu Philipg and
Mainak Das*bc
aPlant Breeding & Genetics, Regional Research & Technology Transfer Station (Ranital) Bhadrak, Orissa University of Agriculture & Technology, District Bhadrak, Orissa 756111, India
bBiological Sciences & Bioengineering, Indian Institute of Technology Kanpur, Kanpur, Uttar Pradesh 208016, India. E-mail: mainakd@iitk.ac.in
cDesign Program, Indian Institute of Technology Kanpur, Kanpur, Uttar Pradesh 208016, India
dDepartment of Chemistry, Indian Institute of Engineering Science and Technology, Shibpur, Howrah, West Bengal 711103, India
ePeptide & Proteomics Division, Defense Institute of Physiology & Allied Sciences, Defense Research Development Organization, Delhi, 110054, India
fFunctional Materials Group, Solid State Physics Laboratory, Defense Research Development Organization, Delhi, 110054, India
gIndustrial & Management Engineering, Indian Institute of Technology Kanpur, Kanpur, Uttar Pradesh 208016, India
First published on 8th July 2016
Abstract
A brief seed pretreatment of 12 hours, in an aqueous suspension of synthesized nano iron pyrite (FeS2), significantly increases the yield of spinach and other crops. The effector mechanism is not clear. An aqueous suspension of FeS2, produces very trace amounts of H2O2, Fe2O3, FeS, FeSO4, Fe(SO4)3, SO2, S and H+ ionic species. Thus for 12 hours, seeds are exposed to this complex aqueous suspension. Among these trace species, H2O2 and Fe2O3 are known seed stimulants and plant growth promoters respectively. In this work, an attempt has been made to quench one of these trace compounds generated in the aqueous suspension of FeS2, viz., H2O2; and the long-term effect on the mature plant was monitored. To test this, along with FeS2, an agriculturally relevant inorganic peroxide scavenger viz., nano cerium oxide (CeO2) was introduced into this system. Four seed pretreatment regimens were followed for the spinach viz., (i) control (water), (ii) FeS2 + water, (iii) CeO2 + water, (iv) FeS2 + CeO2 + water; and growth was monitored for the next 80 days. It was found that, at maturity, CeO2 and FeS2 + CeO2, resulted in significantly smaller leaves, as compared to the control and FeS2; furthermore, FeS2 resulted in leaves with increased chlorophyll and carbohydrate. Thus, the data indicates that by quenching the H2O2, the seed-stimulant effect of FeS2 is compromised. So, while the FeS2 + water suspension functions as a seed vigor enhancer, CeO2 + water on the contrary, functions as a ‘seed vigor reducer’. It is noteworthy, that CeO2 is used by Chinese farmers, as a micro-nutrient to increase crop production. Current data indicates that, it delays germination of seeds, whereas FeS2 hastens germination. Thus such an approach could be used for hastening or delaying germination, manipulating weed population, seed storage in critical conditions, timing the life-cycle of a plant and developing more energy-efficient plants, especially in regions, where there is limited sunlight during significant parts of the year.
1. Introduction
Nano iron pyrite (FeS2) is a seed biostimulant. Pyrite treated seeds raise the yields of spinach, sesame and fenugreek in field trials and chickpea in laboratory trials.1–4 The mechanism of action of FeS2 is not clear. In this work, the possible chemical mechanism of action of FeS2 was explored.The current practice of nano FeS2 seed pre-treatment is the following: nano FeS2 is prepared by a low temperature route.1–5 Before sowing, the seeds are pretreated in an aqueous suspension of FeS2 (80–100 μg mL−1) for 12 hours. The key question is ‘how FeS2 + H2O is acting on the seeds, during this brief 12 hour exposure?’. There are two possibilities; the first possibility is, FeS2 is acting directly on the surface of the seeds through certain un-explored receptors or pathways; the second possibility is, FeS2 in the presence of water, is generating a certain effector molecule/molecules in very trace amounts viz., H2O2, Fe2O3, FeS, FeSO4, Fe(SO4)3, SO2, S and H+ ionic species;2,4,6 which is/are influencing the seed metabolism positively. The second possibility seems more probable, since among these trace ionic species, H2O2 (ref. 7–16) and nano Fe2O3 (ref. 17) are known seed stimulant and plant growth promoter respectively. Based on this available knowledge about the aqueous chemistry of FeS2, an attempt was made to dissect out the action of trace amounts of H2O2 generated in an aqueous suspension of FeS2, by quenching it using another agriculturally relevant inorganic compound viz., CeO2.18–26
In the following paragraph, the existing literature on peroxide and seed germination have been discussed. Peroxide has two modes of action during seed germination; an endogenous and an exogenous mode. In the endogenous mode, seeds are equipped with an inbuilt molecular machinery to produce trace amounts of peroxide during the time of germination, which subsequently helps in the emergence process.7–9 In addition, if the germinating seeds are incubated in an inhibitor of catalase, the antioxidant enzyme responsible for the breakdown of the peroxide, then germination rate can be accelerated.10 Thus the corollary is that ‘if the germinating seeds are incubated in the presence of exogenous catalase, the seed germinating vigor will be low and germination rate will fall’. Moreover, in the exogenous mode, if the seeds are pretreated in peroxide, it helps in breaking dormancy and promotes germination.10–16 So based on the current understanding of seed physiology, peroxide is emerging as a critical switch during the time of germination and by tweaking this switch, it is possible to modulate the fate of the plant at the very onset of germination.
With this background information, the mechanism of action of synthetic FeS2 on seed germination and subsequent growth was explored in the current study. To test the role of peroxide, an agriculturally relevant nano-peroxide scavenger cum anti-oxidant viz., cerium oxide (CeO2) was introduced into the system. Cerium is used for increasing paddy production in China and other parts of the world.20 It is noteworthy that recent findings have shown that CeO2 helps the leaves to reduce oxidative damage in the chloroplast and further increasing the rate of photosynthesis. The central idea behind introducing another plant friendly nanomaterial is the following: could the fate of a germinating seed be modulated externally, with a nanomaterial having peroxide generating (FeS2) and another with peroxide scavenging (CeO2) properties. One has to also keep in mind that, both these nano-materials are agriculturally relevant and have showed growth stimulatory effects at different phases of plant development. But whether both of them have the same effect on seed germination and subsequent growth is yet to be addressed systematically.
2. Experimental
2.1. Synthesis and characterization of pyrite and ceria nano particles
FeS2 nanoparticles was synthesized by following formerly reported method. It follows a nucleophilic reaction between the aqueous solution of 0.8 M sodium polysulfide and 0.4 M aqueous solution of FeCl3·6H2O in argon atmosphere, at a temperature around 100 °C for 8 hours. Tri-sodium-citrate was used as a capping agent to prevent agglomeration of the nano particles in an aqueous medium. Acetic acid–sodium acetate buffer solution was used to maintain a pH around 6. The obtained greyish black precipitate was centrifuged and thoroughly washed with 2 M of HCl to remove other iron sulfur impurity (as FeS2 is not soluble in 2 M HCl). Following this, the particles are washed with water, toluene and acetone to remove non-reacted sulphur. The purified FeS2 precipitate was dried under vacuum and used for further experiment.1–5Nano ceria was synthesized by reacting 0.025 M aqueous solution of Ce(NO3)3·6H2O with 0.025 M aqueous solution hexamethylene-tetra-amine (HMTA) at a temperature of 75–80 °C for 4 hours, as reported in earlier work. The white turbid solution obtained, was centrifuged at 12![[thin space (1/6-em)]](https://www.rsc.org/images/entities/char_2009.gif) 000 rpm for 2 minutes and washed with water and acetone for 3 times and stored in vacuum desiccator for drying and further use.18
000 rpm for 2 minutes and washed with water and acetone for 3 times and stored in vacuum desiccator for drying and further use.18
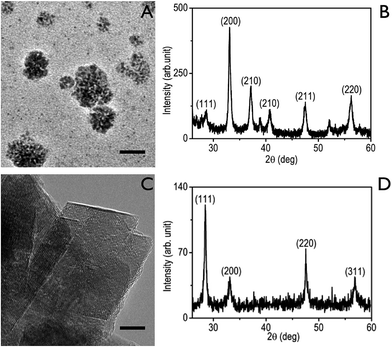
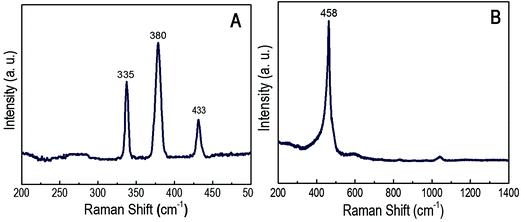
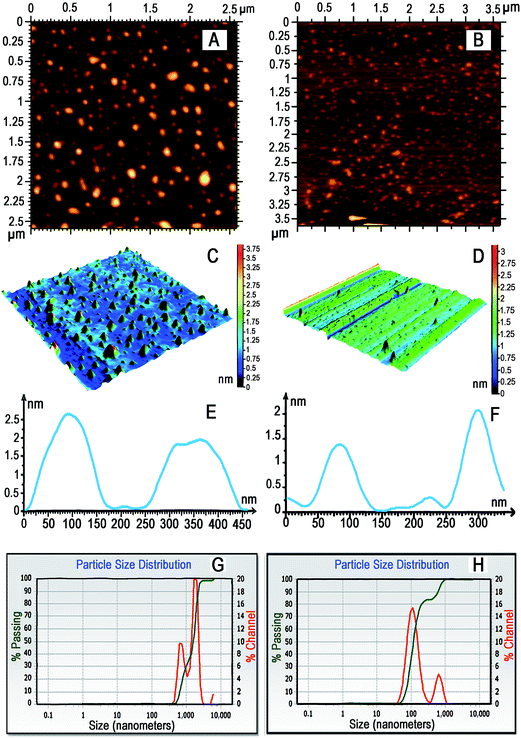
The particles are characterized by HRTEM (JEOL Transmission JEM2000FX with STM equipped with a Quantum detector), XRD (PANanalytical XRD), Raman spectroscopy, atomic force microscopy (Agilent 5500), zeta potential analyzer (Microtrac) and X-ray photoelectron spectroscopy (XPS).
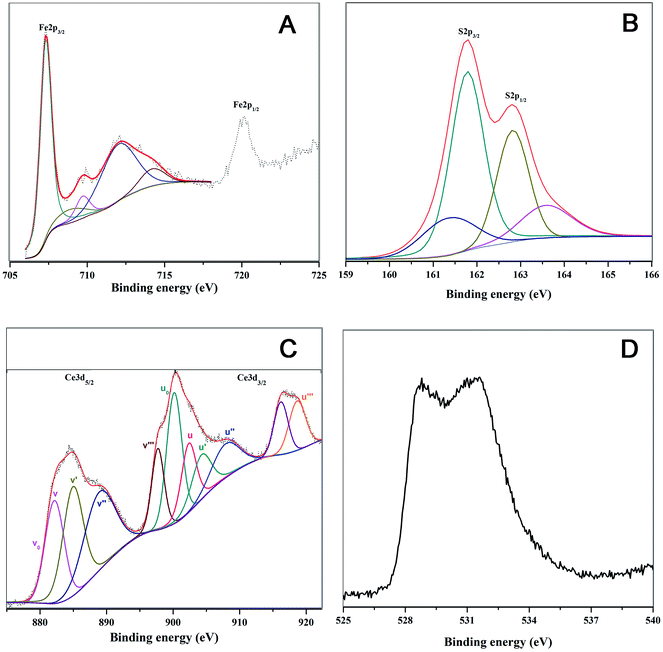
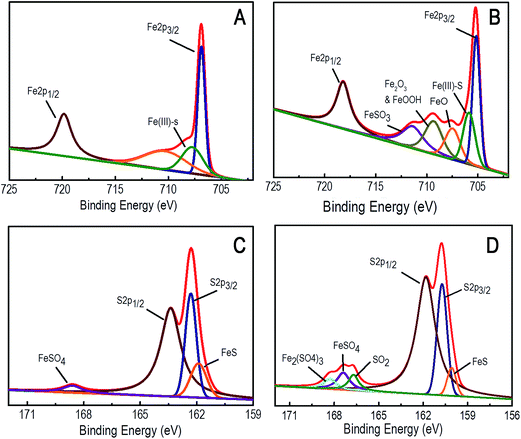
XPS characterization was done using PHI 5000 Versa Prob II, FEI Inc. equipped with AlK-alpha monochromatic source. All peaks were fitted using a Lorentzian: Gaussian line shape and with a Shirley background.
Atomic force microscopy (AFM) was performed using an Agilent Technologies Atomic Force Microscope (Model 5500) operating in ACAFM mode. The scanner model N9520A-USO8380185.xml was calibrated and used for the imaging. Micro fabricated silicon nitride cantilevers with resonant frequency [f] of 181 kHz and 349 kHz were used. The images were taken at room temperature with a scan speed of 2.0 lines per s. Data acquisition and analysis was done using Pico View® 1.8 and Pico Image® Basic software respectively. Sparingly soluble solution of FeS2 (1 mg mL−1) was sonicated for about 2 minutes and was heated at 65 °C in water-bath for 2 minutes. Further, it was centrifuged using Spin-wine-microcentrifuge at 13![[thin space (1/6-em)]](https://www.rsc.org/images/entities/char_2009.gif) 500 rpm for 1 minute. 15 μL of clear supernatant was drop casted over freshly cleaved mica surface and it was dried at room temperature followed by AFM imaging. Sparingly soluble solution of CeO2 HMTA (1 mg mL−1) was sonicated about 2 minutes and it was heated at 65 °C in waterbath for 2 min. Further, it was centrifuged using Spinwine-microcentrifuge at 13
500 rpm for 1 minute. 15 μL of clear supernatant was drop casted over freshly cleaved mica surface and it was dried at room temperature followed by AFM imaging. Sparingly soluble solution of CeO2 HMTA (1 mg mL−1) was sonicated about 2 minutes and it was heated at 65 °C in waterbath for 2 min. Further, it was centrifuged using Spinwine-microcentrifuge at 13![[thin space (1/6-em)]](https://www.rsc.org/images/entities/char_2009.gif) 500 rpm for 1 minutes. 15 μL of clear supernatant was drop casted over freshly cleaved mica surface and it was dried at room temperature followed by AFM imaging.
500 rpm for 1 minutes. 15 μL of clear supernatant was drop casted over freshly cleaved mica surface and it was dried at room temperature followed by AFM imaging.
2.2. Peroxide detection in an aqueous suspension of synthesized pyrite
The spectroscopic method which has been followed in this study is based on the instant reaction between H2O2 and V2O5 (vanadium pentoxide) in the presence of sulfuric acid, thus resulting in the formation of a peroxovanadate complex, which has an absorption maximum at 454 nm.27 Synthesized FeS2 particles were used for this experiments. 100 mg FeS2 was suspended in 10 mL distilled water, sonicated for 30 seconds and left undisturbed for 2 hours. In order to avoid any contamination and loss of generated H2O2, the tubes were sealed with parafilm. A coloring agent was prepared by dissolving 0.2 g V2O5 in 100 mL 0.5 M H2SO4. FeS2 suspension was centrifuged for 10 minutes at 5000 rpm and supernatant was collected. Equal volumes (5 mL) of coloring agent and the supernatant were mixed in separate tubes. Absorbance was recorded at 454 nm. The control samples consisted of coloring agent and distilled water taken in equal volumes (5 mL each). Control was done at auto-zero mode and comparative test readings were taken. In another set of experiment, along with 100 mg FeS2, an additional 100 mg CeO2 was added, to verify whether CeO2 quenches the peroxide generated by the pyrite.2.3. Spectroscopic detection of the peroxide quenching ability of nano ceria
Peroxide quenching ability of ceria was spectroscopically verified by the above method, as described in the previous section. In the control experiment, pure H2O2 was reacted with 0.2 g V2O5 in 100 mL 0.5 M H2SO4, and the absorbance was recorded at 454 nm. In the test sample, 100 mg cerium was incubated along with H2O2 and to this mixture 0.2 g V2O5 in 100 mL 0.5 M H2SO4 was added.2.4. Studying the quenching of peroxide by ceria using cyclic voltammetry (CV)
Peroxide quenching ability of ceria was further verified with CV. The cerium working electrode was prepared by spraying 30 mg of CeO2 (prepared by mixing and sonicating in 3 mL isopropyl alcohol and 30 μL of 6× diluted Nafion solution for 3 hours, where Nafion functions as a binder) on one side of the ITO sheet. Phosphate buffer saline (adjusted at a pH of 7.4) was used as the electrolyte. The CV was carried out using Epsilon Basi C3 cell stand with conventional three electrode configuration, where Ag/AgCl was the reference electrode, and platinum as the counter electrode. CV was performed at different scan rate from 10 mV s−1 to 300 mV s−1 at −0.8 V to 0.8 V voltage window.2.5. Spinach seed pretreatment, field trial, sample collection and statistical analysis
Four seed pretreatments (12 hours) protocols were followed, viz. control (water), FeS2 (80 μg mL−1), CeO2 (80 μg mL−1), FeS2 + CeO2 (equal amounts of both the nanoparticles: 80 μg mL−1 + 80 μg mL−1 respectively); to evaluate how CeO2 alone, and CeO2 in combination with FeS2, influences the germination and long-term growth of the spinach plant. Germination analysis were performed on day 5, post seed pre-treatment. Long term analysis was performed on day 50, on the basis of average individual leaf area of spinach following different treatments. The total leaf area of spinach plants obtained from the experimentation was calculated. A random sample of 10 plants were chosen from each of the plots, viz., control, FeS2, CeO2, and FeS2 + CeO2 plots. While the control plot represents the plants germinated from untreated seeds, the rest of the plots represented the different particle that was used for seed pretreatment. Since the sample size was 10 for each case, paired t-test for unequal variance was used to compare the average individual leaf area from each treatment level. The null hypothesis was that there is no significant difference between the average leaf areas among the treatment levels; whereas, the alternate hypothesis claimed that FeS2 pretreated seeds produced plants that have significantly larger leaf area. For chlorophyll and carbohydrate estimation, leaf samples were collected at two different time points, at day 50 and at day 80 following seed sowing.2.6. Chlorophyll and carbohydrate estimation
| Chl a (mg g−1) = [(12.7 × A663) − (2.6 × A645)] × mL acetone per mg leaf tissue |
| Chl b (mg g−1) = [(22.9 × A645) − (4.68 × A663)] × mL acetone per mg leaf tissue |
| Total Chl = Chl a + Chl b. |
3. Results and discussion
3.1. Characterization of the synthesized FeS2 and CeO2 particles
3.2. Detection of peroxide in an aqueous suspension of synthesized iron pyrite
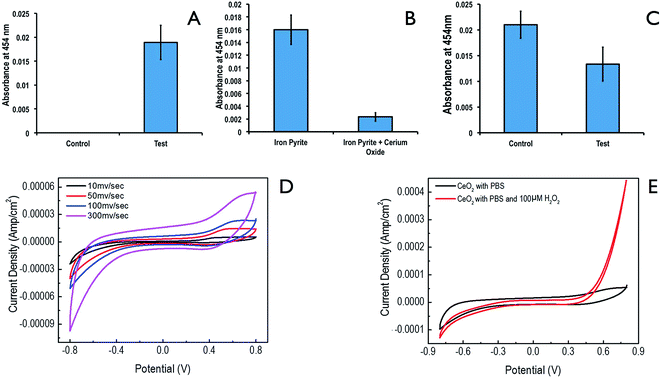
Formation of significant amount of peroxovanadate complex was detected,27 thus indicating the formation of H2O2 in an aqueous solution of FeS2 (Fig. 6A). In Fig. 6B, the concentration of the peroxo-vanadate complex reduces significantly, in the presence of CeO2 along with FeS2. Thus indicating that CeO2 is possibly quenching H2O2 in this system.3.3. Peroxide quenching by ceria
Next spectroscopically peroxide quenching ability of ceria was detected (Fig. 6C). In control experiments, pure H2O2 was allowed to react to form peroxovanadate complex. In the test, 100 mg of CeO2 was added along with same amount of H2O2, and the concentration of peroxovanadate complex was detected. There was a significant reduction in the concentration of the peroxovanadate complex, indicating that CeO2 is possibly quenching H2O2.3.4. Electro-catalytic activity of ceria in the presence of ceria
The electro-catalytic potential of the ceria was further studied for H2O2 redox reactions (Fig. 6D and E). Fig. 6D showed the CV of CeO2 electrode under optimal conditions. In Fig. 6E, CV was shown before and after injection of an aliquot of H2O2. As it could be seen in Fig. 6E, the peak current value for the redox couple at the CeO2 electrode increased significantly, following addition of H2O2. This clearly suggests that H2O2 oxidation is significantly facilitated by CeO2 nanoparticles.3.5. Effect of nano pyrite and ceria following seed pretreatment
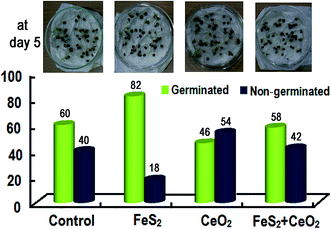
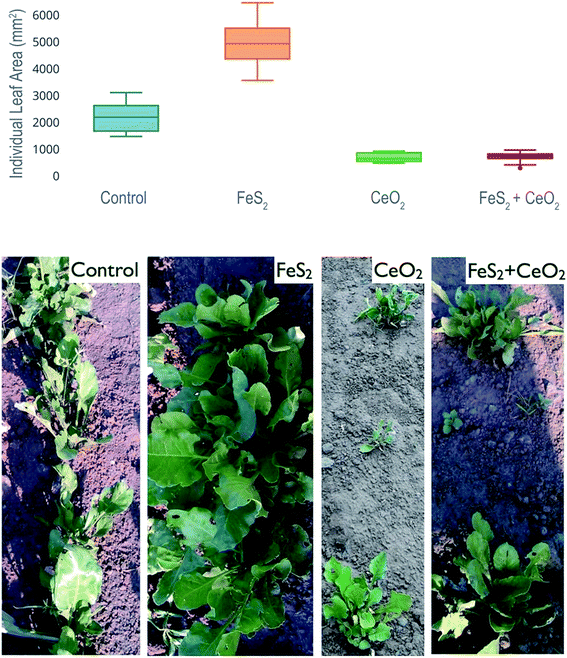
We used four seed pretreatments viz. control, FeS2, CeO2, FeS2 + CeO2. First, the germination test was performed. The data showed that maximum germination at day 5 was observed in following FeS2 seed pre-treatment and least in the case of CeO2 seed pre-treatment (Fig. 7).It is interesting to note that upon maturity, CeO2 and FeS2 + CeO2 seed pretreatment resulted in significantly smaller leaf as compared to the control and FeS2 (Fig. 8, Table 1). Why there is such a marked antagonistic effect of CeO2? One of the possible reasons could be that, CeO2 is scavenging the endogenous H2O2 produced by the seeds during the time of germination, as well as exogenous H2O2 (produced by FeS2) in FeS2 + CeO2 treatment. Thus CeO2 by its autocatalytic activity, is mimicking the activity of catalase and nullifying the effect of FeS2-induced peroxide formation.
| Sl. no | Pair-wise comparison | Average individual leaf area (mm2) | p-Value | t-Statistic |
|---|---|---|---|---|
| 1 | FeS2 vs. control | 4897.3 vs. 2143.3 | 0.000000720 | 7.96 |
| 3 | FeS2 vs. CeO2 | 4897.3 vs. 635 | 0.000000036 | 13.90 |
| 4 | FeS2 vs. (FeS2 + CeO2) | 4837.3 vs. 646.5 | 0.000000039 | 13.76 |
3.6. Chlorophyll and carbohydrate content in the mature spinach leaves
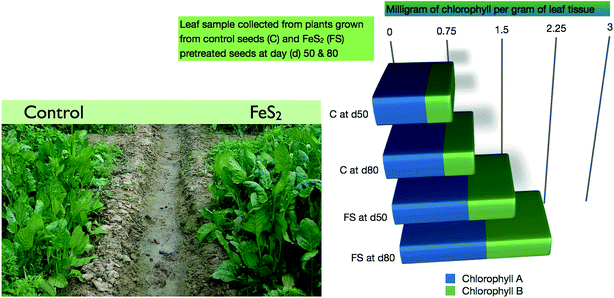
Since FeS2 seed pretreatment resulted in higher biomass, so we estimated the chlorophyll content of the spinach leaves. The data were collected from 6 different plants at two different time points (day 50 and 80) and the average value of total chlorophyll content (mg per g of tissue) is plotted (Fig. 9). We found that FeS2 pretreated seeds, resulted in plants having higher chlorophyll concentration in the leaves. Next we estimated the total carbohydrate in the spinach leaves at day 50. The control sample has an average total carbohydrate content of 1.5 g/100 g of plant tissue (n = 3), whereas the FeS2 pretreated samples has 1.8 g/100 g of plant tissue (n = 3). Thus an increase in chlorophyll and total carbohydrate upon seed pretreatment with FeS2 was observed. In Fig. 10, a proposed pictorial depiction of the interaction between pyrite and ceria in an aqueous medium is being shown.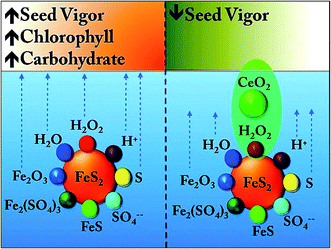 | ||
| Fig. 10 Proposed interaction between pyrite and ceria in an aqueous environment, which is eventually dictating the fate of the seed. | ||
3.7. Proposed mechanism of action of FeS2 and CeO2 (Fig. 10)
Based on the experimental findings, the following mechanism has been proposed: in an aqueous suspension of FeS2, the trace amounts of H2O2, Fe2O3 and S along with low pH due to H+ ions, is positively influencing the fate of the germinating seed. On the other hand, in the presence of CeO2, the trace H2O2 is scavenged. Thus not only the positive influence of H2O2 derived from FeS2 + H2O is compromised, but the ability of H2O2 to disturb the lattice geometry of FeS2 is ceased, and thereby generation of trace amounts of Fe2O3, S is also curtailed. Hence in the presence of CeO2, the positive impact of FeS2 is negated completely.3.8. Significance of higher chlorophyll content upon FeS2 seed pre-treatment
The exact pathway by which the chlorophyll is increasing needs further investigation. But more chlorophyll indicates the increased capability of plants to harvest more solar energy and subsequently more sugar turnover. Essentially this approach could have several economic ramifications viz., regions of the world, where sunlight is limited during significant part of the year, such a treatment could be a potential tool to obtain maximum growth and yield within a limited time window.3.9. Economic significance of the work from the perspective of agro-sustainability and translational potential
This is a sustainable approach to reduce the fertilizer consumption, thereby reducing the cost input for the marginal farmers in the under-developed and developing world. Further reduction of fertilizer would help in maintaining a healthy, symbiotic soil micro-flora and fauna. It is worth discussing that, though it is known that H2O2 is a seed stimulant, but it can not be economically exploited till this date. Since H2O2 stand alone is highly corrosive difficult to carry over large distances. Thus because of these drawbacks, translating such a technology for the farmers is a challenge. On the contrary, approach of using FeS2 + H2O, is a eco-friendly approach and easily translatable to the farming community. Recently aqueous suspension of nano FeS2 has also been used as a source of H2O2 to destroy organic waste and aqueous suspension of FeS2 is nicknamed as ‘Fenton like reagent’.2,4 Further FeS2 is a multifunctional material: a seed stimulant, a bi-functional electrode for charge storage devices and a organic waste disposal material.2,4,54. Conclusion
This study opens an unique peroxide-driven nano-window, to regulate the metabolic fate of a germinating seed, without manipulating the genes. It has been shown that by pre-treating the seeds with peroxide producing (iron pyrite) and peroxide scavenging (cerium oxide) nano particles, one could tune the future growth profile of a plant. Such an approach could be used for hastening or delaying germination, manipulating weed population, storing seeds and seedlings in critical conditions, timing the life-cycle of a plant and developing more energy-efficient plants, specially in the regions, where there is limited sunlight during significant parts of the year.Acknowledgements
This work is part of GS's and AD's doctoral thesis. MR is supported by SB/FT/CS-199/2013 (DST-SERB, GOI).References
- G. Srivastava, A. Das, T. S. Kusurkar, M. Roy, S. Airan, R. K. Sharma, S. K. Singh, S. Sarkar and M. Das, Mater. Express, 2014, 4, 23 CrossRef CAS.
- G. Srivastava, C. K. Das, A. Das, S. K. Singh, M. Roy, H. Kim, N. Sethy, A. Kumar, R. K. Sharma, S. K. Singh, D. Philip and M. Das, RSC Adv., 2014, 4, 58495 RSC.
- M. Das, G. Srivastava, C. Das, A. Dubey, N. Sethy, K. Bhargava, S. K. Singh and D. Philip, Iron pyrite as seed treatment biostimulant: The new revolution?, New AG International India, 2015, pp. 41–42 Search PubMed.
- G. Srivastava, Iron pyrite: A seed biostimulant, Doctoral thesis, Indian Institute of Technology Kanpur, India, 2016, Electronic Thesis and Dissertations (ETD) link http://172.28.64.70:8080/jspui/handle/123456789/15534.
- A. Dubey, S. K. Singh, B. Tulachan, M. Roy, G. Srivastava, D. Philip, S. Sarkar and M. Das, RSC Adv., 2016, 6, 16859 RSC.
- M. J. Borda, A. R. Elsetinow, M. A. Schoonen and D. R. Strongin, Astrobiology, 2001, 1, 283 CrossRef CAS PubMed.
- S. Puntarulo, M. Galleano, R. Sanchez and A. Boveris, Biochim. Biophys. Acta, 1991, 1074, 277 CrossRef CAS.
- C. Bailly, Seed Sci. Res., 2004, 14, 93 CAS.
- C. Bailly, H. El-Maarouf-Bouteau and F. Corbineau, C. R. Biol., 2008, 331, 806 CrossRef CAS PubMed.
- S. B. Hendricks and R. B. Taylorson, Proc. Natl. Acad. Sci. U. S. A., 1975, 72, 306 CrossRef CAS.
- D. R. Hite, C. Auh and J. G. Scandalios, Redox Rep., 1999, 4, 29 CrossRef CAS PubMed.
- H. El-Maarouf-Bouteau and C. Bailly, Plant Signaling Behav., 2008, 3, 175 CrossRef.
- G. Barba-Espín, J. A. Hernández and P. Diaz-Vivancos, Plant Signaling Behav., 2012, 7, 193 CrossRef PubMed.
- G. Barba-Espin, P. Diaz-Vivancos, M. J. Clemente-Moreno, A. Albacete, L. Faize, M. Faize, F. Pérez-Alfocea and J. A. Hernández, Plant, Cell Environ., 2010, 33, 981 CrossRef CAS PubMed.
- P. Schopfer, Plant J., 2001, 28, 679 CrossRef CAS PubMed.
- R. Shin and D. P. Schachtman, Proc. Natl. Acad. Sci. U. S. A., 2004, 101, 8827 CrossRef CAS PubMed.
- K. Jeyasubramanian, U. U. Gopalakrishnan Thoppey, G. S. Hikku, N. Selvakumar, A. Subramania and K. Krishnamoorthy, RSC Adv., 2016, 6, 15451 RSC.
- S. K. Ujjain, A. Das, G. Srivastava, P. Ahuja, M. Roy, A. Arya, K. Bhargava, N. Sethy, S. K. Singh, R. K. Sharma and M. Das, Biointerphases, 2014, 9, 031011 CrossRef PubMed.
- M. Das, S. Patil, N. Bhargava, J. F. Kang, L. M. Riedel, S. Seal and J. J. Hickman, Biomaterials, 2007, 28, 1918 CrossRef CAS PubMed.
- X. Pang, D. Li and A. Peng, J. Soils Sediments, 2001, 1, 124 CrossRef CAS.
- C. T. Campbell and C. H. F. Peden, Science, 2005, 309, 713 CrossRef CAS PubMed.
- F. Esch, S. Fabris, L. Zhou, T. Montini, C. Africh, P. Fornasiero, G. Comelli and R. Rosei, Science, 2005, 309, 752 CrossRef CAS PubMed.
- T. Pirmohamed, J. M. Dowding, S. Singh, B. Wasserman, E. Heckert, A. S. Karakoti, J. E. S. King, S. Seal and W. T. Self, Chem. Commun., 2010, 46, 2736 RSC.
- J. M. Dowding, T. Dosani, A. Kumar, S. Seal and W. T. Self, Chem. Commun., 2012, 48, 4896 RSC.
- A. A. Boghossian, F. Sen, B. M. Gibbons, S. Sen, S. M. Faltermeier, J. P. Giraldo, C. T. Zhang, J. Zhang, D. A. Heller and M. S. Strano, Adv. Energy Mater., 2013, 3, 881 CrossRef CAS.
- J. P. Giraldo, M. P. Landry, S. M. Faltermeier, T. P. McNicholas, N. M. Iverson, A. A. Boghossian, N. F. Reuel, A. J. Hilmer, F. Sen, J. A. Brew and M. S. Strano, Nat. Mater., 2014, 13, 400 CrossRef CAS PubMed.
- Q. Zhang, S. Fu, H. Li and Y. Liu, BioResources, 2013, 8, 3699 Search PubMed.
- N. Padmanathan and S. Selladurai, RSC Adv., 2014, 4, 6527 RSC.
Footnote |
| † CD, GS and AD are equal contribution first authors. |
| This journal is © The Royal Society of Chemistry 2016 |

