 Open Access Article
An optimized purification process for porcine gastric mucin with preservation of its native functional properties†
Veronika J. Schömiga,
Benjamin T. Käsdorfb,
Christoph Scholza,
Konstantinia Bidmonb,
Oliver Lielegb and
Sonja Berensmeier*a
aBioseparation Engineering Group, Department of Mechanical Engineering, Technical University of Munich, Boltzmannstr. 15, D-85748 Garching, Germany. E-mail: s.berensmeier@tum.de
bInstitute of Medical Engineering and Department of Mechanical Engineering, Technical University of Munich, Boltzmannstr. 11, D-85748 Garching, Germany
First published on 26th April 2016
Abstract
Purified gastric mucins are currently used for a wide range of applications e.g. as a model system for native mucus, as lubricants or antiviral/antibacterial supplements. However, commercially available porcine gastric mucins (PGM) do not exhibit gel-forming properties and show only greatly reduced anti-viral/anti-bacterial activity. Thus, we established a robust purification process for PGM, maintaining its desired properties such as lubricity, gel formation and the selective binding of molecules. We optimized the process in terms of yield and productivity and evaluated the influence of different buffer conditions on mucin quality. Cross-flow filtration using 100 kDa membranes was introduced and optimized to pre-concentrate the mucin solution prior to size exclusion chromatography. A conductivity of less than 100 μS cm−1 after diafiltration was found to be crucial for gel formation. The mucin yield of the optimized process was 66%. The scale-up resulted in a productivity of 0.15 mg purified mucin per mL crude mucus an hour. In total, approx. 65 mg mucin could be purified from one pig stomach. Tribological studies, rheological measurements and co-localization experiments confirmed the retained functionality of purified mucin in terms of lubricity, gel formation and binding interactions with charged molecules, respectively.
1. Introduction
Mucins, highly glycosylated proteins, are found in the mucous membranes of animals and humans. Mucus covers the inner surface of the body such as in the abdomen, stomach, nose, eye or female genital tract. In addition to mucins, native mucus contains water (∼95%), lipids, salts, growth factors and enzymes1 and serves as a barrier towards pathogens such as bacteria and viruses and thus protects the underlying tissue from infection.2,3 This is partly due to its physical properties, as mucin gelation is induced at acidic pH values by gel forming mucins such as Muc5AC (mainly found in the stomach) and Muc5B (present in the oral cavity). Moreover, the polyanionic nature of mucins at neutral pH4–6 can lead to electrostatic interactions with cationic groups, as they are present on the surface of many bacteria and viruses.In monomeric form, mucin has a molecular weight of about 640 kDa7 where the carbohydrates amount up to 80% of the whole mass, whereas the protein backbone only contributes 20% of the weight.8 These mainly O-linked glycans such as N-acetylgalactosamine, N-acetylglucosamine, fucose, galactose and sialic acid (N-acetylneuraminic acid) are attached to the hydroxyl side chains of threonine and serine. Mucins are rich in cysteines, which form inter- and intramolecular disulfide bonds resulting in oligomers and polymers of up to 40 MDa.8–10 Once the disulfide interactions are chemically reduced, mucin gel formation is disturbed.10 Additionally, the pH and ionic strength determine the conformation of native mucin.11 The mechanism of the gel formation of mucins like Muc5AC has been investigated in various studies but is not fully understood.5,11–15 It seems, in addition to the disulfide bonds, a complex interplay between hydrophobic and electrostatic interactions is responsible for the crosslinking of gel-forming mucins16 that is observed at acidic pH.
Native mucin has shown promising properties regarding the adsorption onto4 and lubrication of surfaces17–19 which could be very interesting for biomedical applications. Moreover, by investigating the bulk and surface properties of mucin layers and gels, a better understanding of native mucus and its permeability towards molecules,20,21 nanoparticles22 and pathogens2 can be achieved. Although porcine gastric mucins are commercially available e.g. from Sigma Aldrich, most commercial mucins do not form a hydrogel, are only partially purified and are inferior in inhibiting virus infection compared to natively purified mucins obtained in the lab.2 In cell culture experiments2 even cell toxic effects were observed when epithelial cells were treated with reconstituted solutions of commercial mucin. Commercial mucins are often further purified with anion exchange chromatography, size exclusion chromatography (SEC)21 or centrifugation and filtered through a dead end filter to remove aggregates and undesired proteins.23 Nevertheless, in our hands, gel formation of commercially obtained PGMs could not be reconstructed even after further purification (unpublished data). Also Kočevar-Nared and coworkers16 found that commercial mucins cannot reproduce the properties of native gastric mucus, which limits the usefulness of commercial mucins e.g. for experiments mimicking the barrier properties of native mucus towards pathogens. The origin of the missing gel formation abilities of commercial mucin is not completely understood, but the purification process itself or fragmentation with proteases are possible explanations.24
Several studies have been performed to purify enzymatically digested or chemically reduced mucins using SEC or CsCl density centrifugation.8,25–27 Also, the addition of protease inhibitors and stabilizers is widely used in the purification of mucins13,28,29 but can complicate the purification process. The purification of native mucin from pig colonic mucosa has been published.26 However, so far most purification attempts have been carried out with the aim to further process the glycoproteins or to characterize the purified mucins. To our knowledge, optimizing the yield and productivity of a mucin purification from pig stomachs has not been addressed yet. Such an optimization of the purification process is, however, crucial to meet the growing demand for functional PGM, be it for further academic studies or for biomedical applications.
Therefore, our aim was to establish a robust downstream process to purify native porcine gastric mucin while maintaining its unique properties. We addressed the following aspects that are crucial in downstream processing: (1) the requirement for additives, temperature and buffering conditions during purification, (2) volume reduction for increased product concentration and less process streams, (3) functionality of the protein, (4) improvement of the total yield and (5) higher productivity. First, we established a reproducible protocol in small scale before implementing the changes to an upscaled system. We introduced and optimized cross-flow filtration as a new process unit to achieve a reduction of the initial volume and depletion of small molecules before size exclusion chromatography. To our knowledge, this process unit has so far not been published as a concentration step of mucins, but has high potential in enhancing the protein yield. After further purification by subsequent SEC and diafiltration, functionality tests of PGM solutions and gels were used to verify the success of our optimized process.
2. Experimental
2.1. Materials
Commercial porcine gastric mucins (PGM) type II and III were obtained from Sigma Aldrich (St. Louis, United States), Schiff's stain and periodic acid 1% were purchased from Carl Roth (Karlsruhe, Germany), antibodies against Muc5AC (ABIN966608) and horse radish peroxidase HRP conjugated antibodies (ABIN237501) were obtained from antibodies-online.de (Aachen, Germany). Filter cassettes with a membrane area of 200 cm2 and MWCO of 100 kDa (Hydrosart®) and 300 kDa MWCO (polyethersulphone, PESU) were obtained from Sartorius Stedim (Goettingen, Germany), Xampler™ laboratory-scale hollow fiber cartridge with a length of 31.7 cm, an inner diameter of 0.1 mm and membrane area of 110 cm2 and 100 kDa MWCO (polysulfone) was from GE Healthcare Life Sciences (Freiburg, Germany).2.2. Methods
![[thin space (1/6-em)]](https://www.rsc.org/images/entities/char_2009.gif) 000 × g for 45 minutes at 4 °C. The supernatant was stored either at −20 °C, −80 °C or in liquid nitrogen. For further processing, the supernatant was thawed or used directly after the centrifugation steps. An ultracentrifugation step at 150
000 × g for 45 minutes at 4 °C. The supernatant was stored either at −20 °C, −80 °C or in liquid nitrogen. For further processing, the supernatant was thawed or used directly after the centrifugation steps. An ultracentrifugation step at 150![[thin space (1/6-em)]](https://www.rsc.org/images/entities/char_2009.gif) 000 × g (Beckman LE-70 Optima, rotor 70-Ti, Beckman Coulter, Krefeld, Germany) for 1 h at 4 °C was conducted before filtration. For the upscaled process, the centrifugation steps were identical.
000 × g (Beckman LE-70 Optima, rotor 70-Ti, Beckman Coulter, Krefeld, Germany) for 1 h at 4 °C was conducted before filtration. For the upscaled process, the centrifugation steps were identical.
 | (1) |
| Sh = 0.04Re3/4Sc1/3 | (2) |
Detailed information is provided in the ESI (Table S1†). Also, the permeate flux and fouling resistances during concentration were calculated as follows. Darcy's law (eqn (3)) describes the flow rate of a fluid phase through a porous medium:31
 | (3) |
The fouling resistance Rfouling is determined by combining eqn (3) and (4), with Rm being the membrane resistance of water:32
| Rtot = Rm + Rfouling | (4) |
2.3. Analytical methods
2.4. Characterization
![[thin space (1/6-em)]](https://www.rsc.org/images/entities/char_2009.gif) :
:![[thin space (1/6-em)]](https://www.rsc.org/images/entities/char_2009.gif) 1 ratio with the curing agent. Air bubbles were removed under vacuum and the PDMS was cured at 80 °C for 1 h. For each measurement, fresh cylinders were used that were cleaned with 80% (v/v) EtOH before usage. 600 μL of a 0.1% (w/v) mucin solution dissolved in 20 mM HEPES (pH 7.4) were added and the steel sphere was rotated on the PDMS cylinders at a normal force of 6 N. The friction behavior was evaluated by performing a speed ramp from 1000 to 0.01 mm s−1. The measurements were conducted at 21 °C, and three individual measurements with fresh PDMS cylinders were performed for each condition.
1 ratio with the curing agent. Air bubbles were removed under vacuum and the PDMS was cured at 80 °C for 1 h. For each measurement, fresh cylinders were used that were cleaned with 80% (v/v) EtOH before usage. 600 μL of a 0.1% (w/v) mucin solution dissolved in 20 mM HEPES (pH 7.4) were added and the steel sphere was rotated on the PDMS cylinders at a normal force of 6 N. The friction behavior was evaluated by performing a speed ramp from 1000 to 0.01 mm s−1. The measurements were conducted at 21 °C, and three individual measurements with fresh PDMS cylinders were performed for each condition.3. Results & discussion
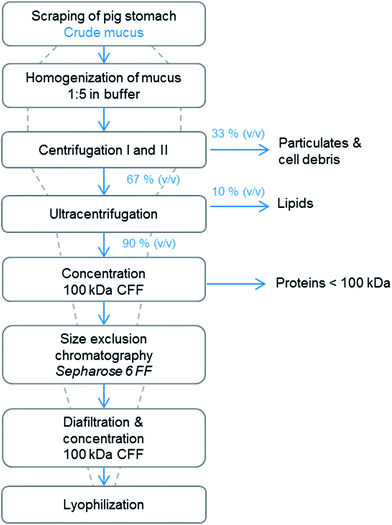
A schematic overview of the optimized process is shown in Fig. 1. Dashed lines qualitatively indicate the mucin concentration and dilution during downstream steps. After harvesting the mucus from pig stomachs by manual scraping, the mucus was homogenized in buffer in the ratio 1![[thin space (1/6-em)]](https://www.rsc.org/images/entities/char_2009.gif) :
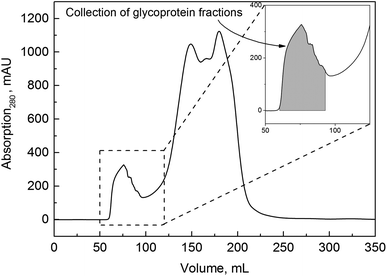
:![[thin space (1/6-em)]](https://www.rsc.org/images/entities/char_2009.gif) 5, and cells, cell debris and finally lipids were removed in centrifugation steps. After the centrifugation steps, the pellets accounting for 33% and 10% of the total volume, were discarded, and we assumed that no mucin was lost within these steps. Next, a concentration step using cross-flow ultrafiltration was introduced. To our knowledge, this novel process step has not yet been published regarding mucin purification. It not only led to depletion of smaller proteins but also entailed an important volume reduction and concentration of the target protein. An increase in productivity was expected because a highly concentrated protein solution was further processed and thereby more protein was loaded onto the SEC while keeping the volume constant. Process parameters such as membrane pore size and membrane system were investigated during cross-flow filtration and the yields of mucin compared. The following step, size exclusion chromatography, has already been used for the purification of mucins from animal or human sources.26,27,35 Because of the high molecular weight of mucin in its native form, SEC is suitable for the separation of glycoproteins, and the fractions can be analyzed to detect carbohydrates and mucins. Thereafter, removal of salts (and further concentration in the upscaled process) was conducted by the same cross-flow ultrafiltration system, and the target protein was lyophilized. Samples were taken after each step of the purification process and analyzed both for glycoprotein content in general and Muc5AC content in particular. We did not determine the exact purity of the purified mucin with conventional protein assays such as UV absorption, BCA or Bradford reagent since – due to the high glycosylation density of mucin – the mucin concentration would be underestimated and thereby falsified results would be obtained when referring to a standard curve of a model protein such as BSA.
5, and cells, cell debris and finally lipids were removed in centrifugation steps. After the centrifugation steps, the pellets accounting for 33% and 10% of the total volume, were discarded, and we assumed that no mucin was lost within these steps. Next, a concentration step using cross-flow ultrafiltration was introduced. To our knowledge, this novel process step has not yet been published regarding mucin purification. It not only led to depletion of smaller proteins but also entailed an important volume reduction and concentration of the target protein. An increase in productivity was expected because a highly concentrated protein solution was further processed and thereby more protein was loaded onto the SEC while keeping the volume constant. Process parameters such as membrane pore size and membrane system were investigated during cross-flow filtration and the yields of mucin compared. The following step, size exclusion chromatography, has already been used for the purification of mucins from animal or human sources.26,27,35 Because of the high molecular weight of mucin in its native form, SEC is suitable for the separation of glycoproteins, and the fractions can be analyzed to detect carbohydrates and mucins. Thereafter, removal of salts (and further concentration in the upscaled process) was conducted by the same cross-flow ultrafiltration system, and the target protein was lyophilized. Samples were taken after each step of the purification process and analyzed both for glycoprotein content in general and Muc5AC content in particular. We did not determine the exact purity of the purified mucin with conventional protein assays such as UV absorption, BCA or Bradford reagent since – due to the high glycosylation density of mucin – the mucin concentration would be underestimated and thereby falsified results would be obtained when referring to a standard curve of a model protein such as BSA.
3.1. Influence of buffer composition and storage temperature
As a first step for optimizing the purification process and improving the yield of functional mucin, the influence of buffer additives such as salts and protease inhibitors as well as the influence of different storage temperatures on mucin quality were evaluated.3.2. Process optimization of mucin purification
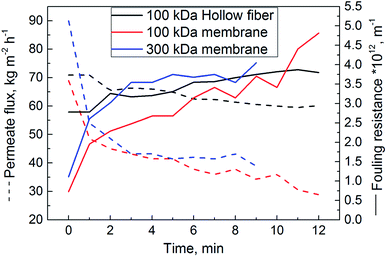
In general, the purification of proteins includes several steps until the desired purity is reached. In addition to obtaining a pure product, maintaining functionality of the molecule is a key goal. With every step, target protein is lost. Thus, the purification is usually a cost-intensive process making a high recovery of proteins and productivity essential. Early volume reduction is one step to increase the efficiency of the process. Thus, we first introduced cross-flow filtration as an essential measure during the purification process of mucins to achieve a concentration of mucin and, at the same time, depletion of undesired smaller proteins. Using the cross-flow configuration, the protein solution circulates tangentially to the membrane. By applying pressure, the solution permeates through the pores. With this process, less cake formation is observed on the membrane compared to dead-end filtration.42 In the following, the optimization of this cross-flow filtration is discussed in detail and subsequent size exclusion chromatography is presented.As presented in Fig. 2, the flux through the hollow fiber system decreased only weakly with time and reached a nearly constant value of 60 kg m−2 h−1 after 9 min. In contrast the flux through the membrane cassettes decreased much more strongly and reached final values of only 40 kg m−2 h−1 (300 kDa membrane) and 35 kg m−2 h−1 (100 kDa membrane) respectively, after the same time. For both membrane systems, the fouling resistance reached 4 × 10¹² m−1 after 9 min, and there seemed to be a tendency towards even higher values. Conversely, the hollow fiber system reached a nearly constant fouling resistance just below 4 × 10¹² m−1.
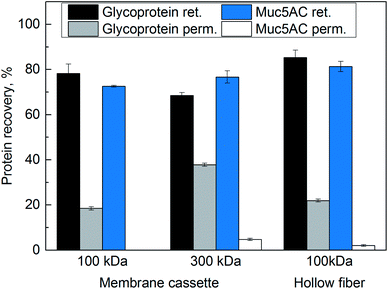
The three membrane systems were also characterized in terms of their capability to retain glycoproteins in general and our target protein Muc5AC in particular. Fig. 3 displays the recovery of glycoproteins and Muc5AC in the retentate and permeate, respectively, after 4.9 fold volume concentration. The amount of protein collected in the washing steps of the membrane was included in the retentate.
For the 100 kDa membrane cassette, 78% of the glycoproteins were retrieved in the retentate, whereas 19% glycoproteins were found in the permeate. The Muc5AC content in the retentate was 73%, the permeate was free of Muc5AC. Similar results were obtained with the hollow fiber module: with this cross-flow system, the recovery of glycoproteins in the retentate and permeate was 85% and 22% respectively. 81% of Muc5AC were retrieved in the retentate, and only 2% in the permeate. For the 300 kDa membrane, the glycoprotein content in the permeate was twice as high as for the 100 kDa membrane cassette, and 5% of Muc5AC was found in the permeate.
Glycoproteins as well as glycosylated peptides smaller than the nominal MWCO can pass the membranes. Typically, it is suggested to use a pore size three to six times smaller than the molecular weight of the target protein for successful retention. As Muc5AC has a monomer size of approximately 640 kDa,7 the MWCO of 300 kDa may not be ideal. Indeed, the highest mucin concentration was detected in the permeate of this cross-flow variant. Both 100 kDa membranes showed a better retention of the target protein Muc5AC in contrast to the 300 kDa membrane as is shown in Fig. 3.
Despite the MWCO, the differences in filtration- and retention behavior might also be explained by the different geometries of the filtration setups. For the ultrafiltration systems used here, diffusion dominates over hydrodynamic effects.30 Filtration through a membrane creates a concentration polarization of the protein solution towards the surface which can, in laminar flow conditions, lead to irreversible gel layer formation. To decide which flow conditions apply in our three setups, we estimated the flow within the different modules by calculating the Reynolds number (ESI Table S1†). For these calculations, we approximated the mucin solution with the viscosity and density of water (0.89 mPa s and 1000 kg m−3, respectively) and assumed a mean diffusion coefficient for mucins of 4 × 10⁻⁸ cm2 s−1.43 For all configurations, the boundary layer was calculated using the Sherwood and Schmidt number (see Experimental). The calculated boundary layer thickness was 0.01 μm for the hollow fiber system and 19 to 20 μm for the membrane cassettes (Table S1†). For the hollow fiber, the calculated Reynolds number suggested a turbulent flow through the filtration area (Re > 4 × 10⁴). Shear forces created by the turbulent flow drag the molecules away from the concentration polarization zone and membrane surface, creating a thinner and mostly reversible boundary layer. A steady state of flux and fouling resistance is reached after a certain time. In contrast, the flow through both membrane cassettes was laminar (Re < 104). Because laminar flow promotes the deposition of molecules on the membrane surface and thereby leads to a continuous decrease in flux and increase in fouling resistance, as was indeed observed for both membrane cassettes (Fig. 2), we concluded that an irreversible gel layer must have formed on the membranes. The layers built on the membrane cassettes might also explain a loss of product of up to 28%. For the hollow fiber the loss of protein was lower at 17%.
In addition, a difference in the adsorption behavior of mucin on the different membrane materials may have to be considered when it comes to protein loss. Mucins adsorb especially well on hydrophobic surfaces.4,44,45 However, regenerated cellulose as well as polyethersulfone are both hydrophilic materials and are supposed to exhibit only minimal protein binding (as claimed by the manufacturer Sartorius). Together with our observations above and the fact that the hollow fiber system reached a flux twice as high as the membrane cassettes although having a surface area of nearly half the membrane area of the membrane cassettes, we concluded that a hollow fiber system is advantageous, especially for upscaling of the process: our hollow fiber module can handle larger sample volumes at a constant flux and therefore was chosen as the cross-flow system in the up-scaled process we describe later. However, on a smaller scale, the membrane cassettes may be preferable since the minimal volume needed for the cassette system is at 20 mL significantly smaller than the approx. 80 mL that are required for running the hollow fiber system. For better comparability and because no target protein was lost in the permeate, the small purification process was conducted with the 100 kDa membrane cassette. The optimized parameters of ΔpTM = 1 bar and a pore size of 100 kDa were also transferred to the diafiltration step after chromatography. The results are discussed in the summary of the purification process.
| Downstream process step | Yield, % | cbefore, mg mL−1 | cafter, mg mL−1 | Vbefore, L | Vafter, L | mbefore, mg | mafter, mg | VCF | CF |
|---|---|---|---|---|---|---|---|---|---|
| a Weighed after lyophilization; purified mucin after purification of 20 mL concentrated mucus.b Before washing of membrane. | |||||||||
| Concentration | 73 ± 7 | 0.27 ± 0.02 | 0.42 ± 0.01 | 0.196 | 0.09 | 52.4 ± 3.4 | 38.1 ± 0.2 | 4.9b | 3.5b |
| Chromatography | 113 ± 6 | 0.42 ± 0.01 | 0.38 ± 0.03 | 0.02 | 0.025 | 8.5 ± 0.1 | 9.5 ± 0.6 | — | — |
| Diafiltration | 80 ± 7 | 0.38 ± 0.03 | 0.18 ± 0.01 | 0.025 | 0.042 | 9.5 ± 0.6 | 7.6 ± 0.3 | — | — |
| Lyophilization | — | 0.042 | 13.1a | — | — | ||||
| Total | 66% | 13.1a | |||||||
To satisfy the demand of purified native mucin a scale-up to the 10 fold column volume of size exclusion chromatography was aimed for. Optimized parameters were transferred to the large scale and the scale-up was analytically analyzed in terms of concentration and concentration factors, yield and productivity. Its results are summarized in Table 2. A total Muc5AC yield of 33% was achieved. During concentration with the hollow fiber membrane the volume was reduced by a factor of 4. Due to the high initial filtration volume, the washing volume has less impact compared to the small scale. The Muc5AC concentration was increased from 2.34 to 3.34 mg mL−1 resulting in a yield of 36%. During SEC, again a total recovery of the target protein was obtained, while diluting the protein by a factor of 0.6. During subsequent diafiltration with the 100 kDa hollow fiber membrane salts were removed and the sample further concentrated by a factor of two in terms of volume and a factor of 1.7 with regard to Muc5AC. 85% were yielded in the diafiltration step.
| Downstream process step | Yield, % | cbefore, mg mL−1 | cafter, mg mL−1 | Vbefore, L | Vafter, L | mbefore, mg | mafter, mg | VCF | CF |
|---|---|---|---|---|---|---|---|---|---|
| a Weighed after lyophilization; purified mucin after purification of 180 mL concentrated mucus.b Before washing of membrane.c Mean of n = 5 purifications. | |||||||||
| Concentration | 36 ± 32 | 2.34 ± 0.45 | 3.34 ± 0.86 | 0.72 | 0.18 | 1685 ± 324 | 601 ± 154 | 4.0 | 3.2b |
| Chromatography | 109 ± 27 | 3.34 ± 0.86 | 2.18 ± 0.22 | 0.18 | 0.3 | 601 ± 154 | 655 ± 66 | — | — |
| Diafiltration | 85 ± 23 | 2.18 ± 0.22 | 3.71 ± 0.79 | 0.3 | 0.15 | 655 ± 66 | 556 ± 118 | — | — |
| Lyophilization | 0.32 | 482a | — | — | |||||
| Total | 33% | 382c | |||||||
In total, 482 mg mucin was purified from 180 mL concentrated mucus before SEC, accounting for 236 mL crude scraped mucus. The upscaled purification process was reproduced four times with a mean mucin amount of 382 mg, resulting in 1.63 mg of purified mucin per mL crude mucus. We were able to purify 65 mg mucin per stomach with 40 mL mucus in one stomach (mean of 60 stomachs). During one purification process the content of up to six stomachs could be processed and their containing mucin purified. The productivity of the optimized upscaled process was 0.15 mg mLcrude mucus−1 h−1.
The yields are in accordance to the yields achieved in the small scale and only differ in the concentration step (36 ± 32% compared to 73 ± 7% in the small scale). The initial concentration of the target protein was 2.34 mg mL−1 and thus by factor 8.7 higher than the initial concentration of the small scale process (0.27 mg mL−1). These differences are most likely based on different batches, where mucin concentrations in the stomachs are not predictable. The tangential flow filtration of a highly concentrated solution, containing not only proteins but also rests of DNA, phospholipids and solutes causes a high concentration on the membrane surface, possibly triggering the buildup of a gel layer.48,49 Even after the washing of the membrane and collection of the washing solution, the recovery of Muc5AC did not increase. In our previous studies performed with initially 0.2–0.3 mg mL−1 concentrated mucin solutions, no such loss of Muc5AC occurred (see also Fig. 2). The Muc5AC concentrations during the concentration and diafiltration step are nearly the same at 2.34 and 2.18 mg mL−1, respectively. However, in the concentration process many contaminating proteins were present while in the protein solution to be diafiltered an already purified solution was applied. Thus, fewer solutes accumulate on the membrane interface leading to a lower decrease in flux and higher recovery.50 Additionally, the standard deviation of 32% might be the result of varieties in ELISA signal. It has been stated that high concentrations of contaminating proteins or lipids might lead to cross reactivity with the target protein.51 This phenomenon is apparent with the high amount of contaminations from crude mucus like phospholipids and (glyco-) proteins and variances in biological material in general. Considering that the diafiltration step which was performed under the same conditions as the concentration step resulted in a yield of 85%, underestimation of the Muc5AC concentration in the first filtration step is probable due to shielding of the antibody binding region. We observed that ELISA provided the most reliable results after the concentration step of mucus.
Although the time needed for filtration increased with the processed volume and the recovery of the concentration process was lower in the upscaled process, productivity was 2 fold compared to the small scale process due to the high load onto the size exclusion chromatography, being 0.15 mg mLcrude mucus−1 h−1.
3.3. Quality control of purified mucin
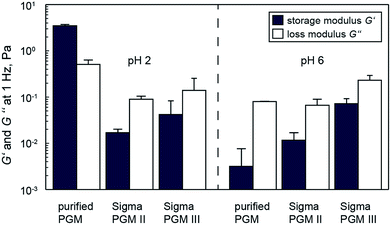
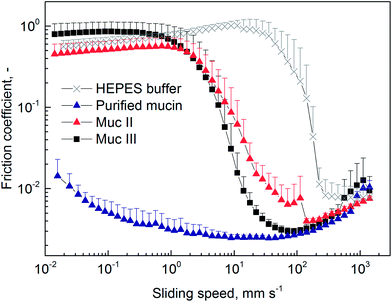
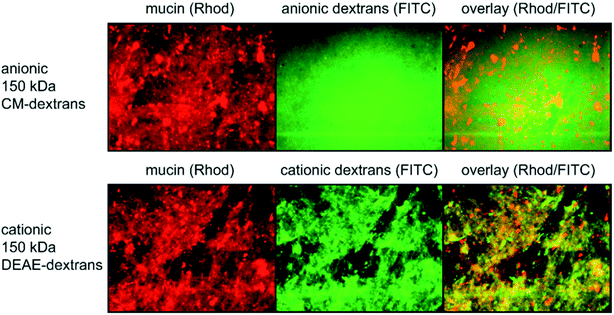
As described above, the optimized and upscaled process of PGM purification resulted in a considerable improvement of the overall mucin amount as well as in a 2 fold increase in productivity (i.e. purified mucin per mL crude mucus and time). The quality of the purified mucin obtained from the optimized process was assessed by testing if its unique properties were preserved. Only then would the purified mucin be suitable for academic or biomedical applications. We first analyzed the gel-forming abilities of mucin at pH 2 and then investigated the lubricity of mucin solutions. As a high density of sugar molecules is required for the superior lubricity of mucin solutions,4,18,19 such friction force measurement can indirectly demonstrate the intactness of mucin glycosylation. Additionally, we probed the selective binding properties of mucins with co-localization experiments.24. Conclusions
Mucins from porcine stomachs intended for lubrication studies or virus–mucin interaction studies19,53 have recently gained much attention. However, most commercially available PGMs lack crucial properties, in particular the ability to form gels at acidic pH and possessing sufficient lubricity. We have described a successful purification process for native mucin from pig stomachs that satisfies the demands of functional PGM for biomedical applications. Furthermore, we evaluated and improved important aspects of protein purification including buffer composition, volume reduction, efficiency, yield and functionality of the purified mucin. We were able to purify 65 mg mucin per pig stomach at a productivity of 0.15 mg mucin per mL crude mucus and hour. The process was successfully upscaled with the purified mucin retaining the desired key properties of gel formation at acidic pH, lubricity and preservation of binding interactions with charged molecules.The purification method discussed here can be applied to a wide range of diverse high molecular weight glycoproteins including mucins obtained from various sources such as those from human saliva. Because synthetic mucins with the identical properties of PGM are not available yet, efficient purification of endogenous mucins remains the only viable strategy for large-scale production of these glycoproteins. In future studies, we intend to introduce alternative capture steps such as liquid–liquid extraction to further optimize productivity to meet the increasing demand for these glycoproteins in research and biomedical applications.
Abbreviations
| BSA | Bovine serum albumin |
| CF | Concentration factor |
| CV | Column volume |
| FITC | Fluorescein isothiocyanate |
| GI | Gastrointestinal tract |
| Muc5AC | Mucin 5AC |
| MWCO | Molecular weight cut off |
| PDMS | Polydimethylsiloxane |
| PGM | Porcine gastric mucin |
| s.d. | Standard deviation |
| SEC | Size exclusion chromatography |
| VCF | Volume concentration factor |
Acknowledgements
We thank Franziska Hirschmann and Eda Isik for conducting pilot experiments and Sabine Günzkofer for technical assistance. The project has been funded by the Dean's Innovation Fond of the TUM Department of Mechanical Engineering of the Technical University of Munich. OL and BTK gratefully acknowledge the financial support of the Deutsche Forschungsgemeinschaft (DFG) through grant LI 1902/3-1.Notes and references
- A. Allen, The structure and function of gastrointestinal mucus, in Basic Mechanisms of Gastrointestinal Mucosal Cell Injury and Protection, Baltimore, 1981 Search PubMed.
- O. Lieleg, C. Lieleg, J. Bloom, C. B. Buck and K. Ribbeck, Biomacromolecules, 2012, 13, 1724–1732 CrossRef CAS PubMed.
- M. A. McGuckin, S. K. Lindén, P. Sutton and T. H. Florin, Nat. Rev. Microbiol., 2011, 9, 265–278 CrossRef CAS PubMed.
- S. Lee, M. Müller, K. Rezwan and N. D. Spencer, Langmuir, 2005, 21, 8344–8353 CrossRef CAS PubMed.
- X. Cao, R. Bansil, K. R. Bhaskar, B. S. Turner, J. T. LaMont, N. Niu and N. H. Afdhal, Biophys. J., 1999, 76, 1250–1258 CrossRef CAS PubMed.
- L. A. Sellers, A. Allen, E. R. Morris and S. B. Ross-Murphy, Carbohydr. Res., 1988, 178, 93–110 CrossRef CAS PubMed.
- R. Mejías-Luque, L. Cobler and C. de Bolós, Atlas of Genetics and Cytogenetics in Oncology and Haematology, 2011, vol. 14, pp. 566–569.
- A. J. Libao-Mercado and C. F. M. de Lange, Livest. Sci., 2007, 109, 141–144 CrossRef.
- B. Jan-Willem Van Klinken, A. W. C. Einerhand, H. A. Büller and J. Dekker, Anal. Biochem., 1998, 265, 103–116 CrossRef.
- G. J. Strous and J. Dekker, Crit. Rev. Biochem. Mol. Biol., 1992, 27(1/2), 57–92 CrossRef CAS PubMed.
- R. Bansil and B. S. Turner, Curr. Opin. Colloid Interface Sci., 2006, 11, 164–170 CrossRef CAS.
- K. Jumel, I. Fiebrig and S. E. Harding, Int. J. Biol. Macromol., 1996, 18, 133–139 CrossRef CAS PubMed.
- A. Maleki, G. Lafitte, A. L. Kjoniksen, K. Thuresson and B. Nystrom, Carbohydr. Res., 2008, 343, 328–340 CrossRef CAS PubMed.
- K. R. Bhaskar, D. H. Gong, R. Bansil, S. Pajevic, J. A. Hamilton, B. S. Turner and J. T. LaMont, Am. J. Physiol., 1991, 261, G827–G832 CAS.
- J. P. Celli, B. S. Turner, N. H. Afdhal, R. H. Ewoldt, G. H. McKinley, R. Bansil and S. Erramilli, Biomacromolecules, 2007, 8, 1580–1586 CrossRef CAS PubMed.
- J. Kočevar-Nared, J. Kristl and J. Šmid-Korbar, Biomaterials, 1997, 18, 677–681 CrossRef.
- I. C. Hahn Berg, L. Lindh and T. Arnebrant, Biofouling, 2004, 20, 65–70 CrossRef CAS PubMed.
- J. M. Coles, D. P. Chang and S. Zauscher, Curr. Opin. Colloid Interface Sci., 2010, 15, 406–416 CrossRef CAS.
- T. Crouzier, K. Boettcher, A. R. Geonnotti, N. L. Kavanaugh, J. B. Hirsch, K. Ribbeck and O. Lieleg, Adv. Mater. Interfaces, 2015, 2, 1500308 Search PubMed.
- L. D. Li, T. Crouzier, A. Sarkar, L. Dunphy, J. Han and K. Ribbeck, Biophys. J., 2013, 105, 1357–1365 CrossRef CAS PubMed.
- A. A. Feiler, A. Sahlholm, T. Sandberg and K. D. Caldwell, J. Colloid Interface Sci., 2007, 315, 475–481 CrossRef CAS PubMed.
- O. Lieleg, I. Vladescu and K. Ribbeck, Biophys. J., 2010, 98, 1782–1789 CrossRef CAS PubMed.
- N. V. Efremova, Y. Huang, N. A. Peppas and D. E. Leckband, Langmuir, 2002, 18, 836–845 CrossRef CAS.
- O. Svensson and T. Arnebrant, Curr. Opin. Colloid Interface Sci., 2010, 15, 395–405 CrossRef CAS.
- M. Faure, D. Moënnoz, F. Montigon, L. B. Fay, D. Breuillé, P. A. Finot, O. Ballèvre and J. Boza, Anal. Biochem., 2002, 307, 244–251 CrossRef CAS PubMed.
- M. Mantle and A. Allen, Biochem. J., 1981, 195, 267–275 CrossRef CAS PubMed.
- T. Marshall and A. Allen, Biochem. J., 1978, 173, 569–578 CrossRef CAS PubMed.
- R. Gupta, N. Jentoft, A. M. Jamieson and J. Blackwell, Biopolymers, 1990, 29, 347–355 CrossRef CAS PubMed.
- J. Dekker, W. Van Beurden-Lamers, A. Oprins and G. J. Strous, Biochem. J., 1989, 260, 717–723 CrossRef CAS PubMed.
- T. Melin and R. Rautenbach, Membranverfahren – Grundlagen der Modul- und Anlagenauslegung, Springer Verlag, 2007 Search PubMed.
- B. Espinasse, P. Bacchin and P. Aimar, Desalination, 2002, 146, 91–96 CrossRef CAS.
- S. Ripperger and T. Grein, Chem. Ing. Tech., 2007, 79, 1765–1776 CrossRef CAS.
- M. Kilcoyne, J. Q. Gerlach, M. P. Farrell, V. P. Bhavanandan and L. Joshi, Anal. Biochem., 2011, 416, 18–26 CrossRef CAS PubMed.
- K. Boettcher, S. Grumbein, U. Winkler, J. Nachtsheim and O. Lieleg, Rev. Sci. Instrum., 2014, 85, 093903 CrossRef CAS PubMed.
- I. Carlstedt, H. Lindgren, J. K. Sheehan, U. Ulmsten and L. Wingerup, Biochem. J., 1983, 211, 13–22 CrossRef CAS PubMed.
- J. P. Pearson, A. Allen and S. Parry, Biochem. J., 1981, 197, 155–162 CrossRef CAS PubMed.
- Z. Kučerová, H. Muselová, E. Miarková and M. Tichá, Prague Med. Rep., 2010, 111, 200–206 Search PubMed.
- M. Scawen and A. Allen, Biochem. J., 1977, 163, 363–368 CrossRef CAS PubMed.
- N. Jentoft, Trends Biochem. Sci., 1990, 15, 291–294 CrossRef CAS PubMed.
- A. Allen and A. Garner, Gut, 1980, 21, 249–262 CrossRef CAS PubMed.
- D. W. Piper and B. H. Fenton, Gut, 1965, 6, 506–508 CrossRef CAS PubMed.
- A. Saxena, B. P. Tripathi, M. Kumar and V. K. Shahi, Adv. Colloid Interface Sci., 2009, 145, 1–22 CrossRef CAS PubMed.
- R. Bansil, E. Stanley and J. T. Lamont, Annu. Rev. Physiol., 1995, 57, 635–657 CrossRef CAS PubMed.
- M. Malmsten, E. Blomberg, P. Claesson, I. Carlstedt and I. Ljusegren, J. Colloid Interface Sci., 1992, 151, 579–590 CrossRef CAS.
- L. Shi and K. D. Caldwell, J. Colloid Interface Sci., 2000, 224, 372–381 CrossRef CAS PubMed.
- H. Nordman, J. R. Davis, A. Herrmann, N. G. Karlsson, G. C. Hansson and I. Carlstedt, Biochem. J., 1997, 326, 903–910 CrossRef CAS PubMed.
- S. K. Linden, P. Sutton, N. G. Karlsson, V. Korolik and M. A. McGuckin, Mucosal Immunol., 2008, 1, 183–197 CrossRef CAS PubMed.
- L. G. Peeva, E. Gibbins, S. S. Luthra, L. S. White, R. P. Stateva and A. G. Livingston, J. Membr. Sci., 2004, 236, 121–136 CrossRef CAS.
- L. Song and M. Eiimelech, J. Chem. Soc., Faraday Trans., 1995, 91, 3389–3398 RSC.
- G. B. van den Berg and C. A. Smolders, Desalination, 1990, 77, 101–133 CrossRef CAS.
- J. Schiettecatte, E. Anckaert, J. Smitz, Adv. Immunoassay Technol., ed. N. H. Chiu, InTech, Croatia, 2012, ch. 3, pp. 45–62 Search PubMed.
- C. Nowald, A. Penk, H.-Y. Chiu, T. Bein, D. Huster and O. Lieleg, Macromol. Biosci., 2016, 16, 567–579 CrossRef CAS PubMed.
- B. A. Dancho, H. Chen and D. H. Kingsley, Int. J. Food Microbiol., 2012, 155, 222–226 CrossRef CAS PubMed.
Footnote |
| † Electronic supplementary information (ESI) available: Rheological measurements of different mucin concentrations (Fig. S1) and the influence of buffer and protease inhibitors on viscoelasticity (Fig. S2a and b, respectively); SDS-PAGE of enzymatically digested PGM (Fig. S3); temperature dependence before and after purification (Fig. S4); preliminary studies of cross-flow filtration with commercially available mucin type III (Sigma Aldrich) (Fig. S5a and b); calculations of the flow conditions within filtration modules (eqn (S1) and (S2) and Table S1); PAS assay analyses of purification processes using different filter modules (Tables S2–S4). See DOI: 10.1039/c6ra07424c |
| This journal is © The Royal Society of Chemistry 2016 |

