DOI:
10.1039/C5RA23731A
(Paper)
RSC Adv., 2016,
6, 22331-22340
Graphene oxide/vinyl ester resin nanocomposite: the effect of graphene oxide, curing kinetics, modeling, mechanical properties and thermal stability
Received
10th November 2015
, Accepted 12th February 2016
First published on 12th February 2016
Abstract
Graphene oxide (GO) was synthesized and nanocomposites were prepared using different contents of the GO and vinyl ester resin (VE). The suspension was sonicated in order to prevent agglomeration. The non-isothermal differential scanning calorimetry (DSC) technique was used to study the cure kinetics of neat VE and 0.3 wt% GO/VE nanocomposite. Kissinger and Ozawa equations were used to determine the activation energy (Ea). The Ea values of the cured GO/VE nanocomposite showed a decrease with respect to the neat VE. It is concluded that GO has a catalytic effect in the cure reaction. The dynamic curing process was modeled to predict the degree of curing and curing rate of resin. The modeling results showed a good agreement between the experimental data and model for different heating rates (5, 10, 15 and 20 °C min−1). The glass transition temperature (Tg) was obtained from the maximum peak temperature of the loss factor curve. The Tg was increased by nearly 10 °C by the addition of 0.4 wt% GO to VE. Tensile mechanical tests were studied and the nanocomposite of 0.3 wt% GO/VE showed higher elongation and tensile strength. This percent (0.3 wt% GO/VE) was selected for non-isothermal differential scanning calorimetry (DSC) to study the cure kinetics. Scanning electron microscopy (SEM) was studied to discern the surface features and dispersion of GO. The thermal stability of the cured VE and its nanocomposite was investigated with thermogravimetric analysis (TGA). The char yields increased with the addition of 0.3, 1.5, and 3 wt% of GO to the vinyl ester resin. The addition of GO improved the polymer flame retardancy and thermal resistance.
1. Introduction
Vinyl ester resins are thermoset matrices that are widely used in the composites industry.1,2 VE resin is produced by the esterification of epoxy resin with unsaturated monocarboxylic acid. The resins are widely used in environments that require high corrosion and chemical resistance, water barrier properties, low moisture absorption, low shrinkage and good dimensional stability.3,4 Generally, these resins have been used in a wide range of applications as a matrix material, coating, adhesive, electronic encapsulant, in the marine industry, pipelines and automotives.5–7 The thermoset epoxy polymers can be mixed with a second phase of nanofillers such as nanospheres, nanotubes, nanoplatelets, etc. These nanocomposites improve the toughness, stiffness, strength and thermal properties.8–10 A large number of studies have shown the properties of nanocomposites reinforced with carbon nanofibers (CNFs) and carbon nanotubes (CNTs).11 As a layered carbon nanomaterial, graphene with high aspect ratios is widely used to improve mechanical, thermal and electrical properties in polymer materials. However, the high cost and poor dispersion of the CNTs and CNFs in the polymers, limits the range of practical application.12–15 The interfacial interaction between the nanomaterials and the polymer matrix plays a very important role in the quality and properties of the nanocomposite. Poor linkage between the filler and the polymer matrix will introduce defects such as voids, which consequently have a bad effect on the mechanical properties of the nanocomposite. Introducing good bonds between the nanoparticles and the polymer matrix is still a challenge for the fabrication of a composite.16,17 Graphite flakes can be completely expanded to produce a colloidal suspension of graphene oxide (GO) sheets by simple sonication in aqueous and organic solvents in the field of homogeneous polymer nanocomposites.18
In this study, the improved method of Hummers was used to prepare GO. We also investigate a simple method for the preparation of GO/VE composite by dispersing GO in vinyl ester resin. The effect of GO (different contents) on thermal and mechanical properties of vinyl ester resin has been studied and compared. The composite of 0.3% GO/VE was selected for a DSC test to study the cure kinetics.
2. Experimental
2.1. Materials
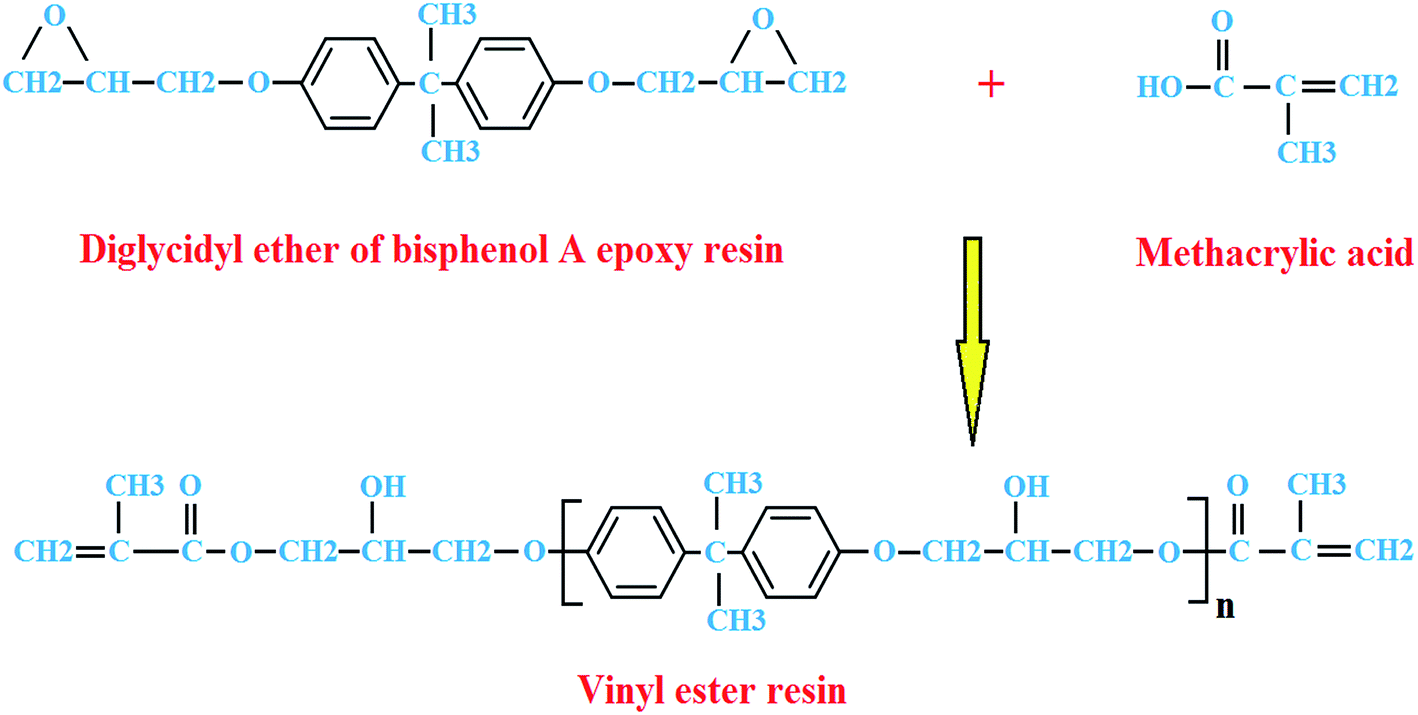
Natural graphite flakes (100 meshes, product number: 332461) were supplied by Sigma-Aldrich (Saint Louis, USA). Farapol V301 epoxy vinyl ester resin (Fig. 1) using bisphenol A epoxy (42 wt% styrene content) was purchased from Farapol Jam Chemical Industries (Hamadan, Iran). Cobalt, dimethylaniline (DMA) and methyl ethyl ketone peroxide (MEKP) with the trade name of butanox LPT, sulfuric acid (H2SO4), phosphoric acid (H3PO4), potassium permanganate (KMnO4), hydrogen peroxide (H2O2), hydrochloric acid (HCl), tetrahydrofuran (THF) solvent and other chemicals were purchased from Merck Chemicals Company.
 |
| | Fig. 1 The reaction of diglycidyl ether of bisphenol A epoxy resin with methacrylic acid to form vinyl ester resin. | |
2.2. Synthesis and preparation of GO
The improved method of Hummers19 was used to prepare GO from graphite flakes. For this purpose, a mixture of concentrated H2SO4/H3PO4 (360![[thin space (1/6-em)]](https://www.rsc.org/images/entities/char_2009.gif) :40 mL) was added gradually with stirring to a mixture of graphite flakes/KMnO4 (3:18 g). Then, the reaction was warm up to 45 °C and mixed for 12 h. The reaction was cooled and poured onto 400 g ice with 3 mL of 30% hydrogen peroxide (H2O2). The mixture was sifted through a metal sieve (Sigma-Aldrich, 300 μm) and then filtered by polyester fiber. The filtrate materials were centrifuged at 4000 rpm for 4 h, and solid product was separated. The solid product was then washed with 200 mL of water, 200 mL of 30% HCl, and 200 mL of ethanol, respectively. After each wash, the mixture was then purified following the previous protocol of sifting, filtering and centrifugation. The material remaining was coagulated with 200 mL of ether, and the mixture was filtered again. The resulting GO obtained on the filter was vacuum dried overnight at room temperature to produce the GO powder.
:40 mL) was added gradually with stirring to a mixture of graphite flakes/KMnO4 (3:18 g). Then, the reaction was warm up to 45 °C and mixed for 12 h. The reaction was cooled and poured onto 400 g ice with 3 mL of 30% hydrogen peroxide (H2O2). The mixture was sifted through a metal sieve (Sigma-Aldrich, 300 μm) and then filtered by polyester fiber. The filtrate materials were centrifuged at 4000 rpm for 4 h, and solid product was separated. The solid product was then washed with 200 mL of water, 200 mL of 30% HCl, and 200 mL of ethanol, respectively. After each wash, the mixture was then purified following the previous protocol of sifting, filtering and centrifugation. The material remaining was coagulated with 200 mL of ether, and the mixture was filtered again. The resulting GO obtained on the filter was vacuum dried overnight at room temperature to produce the GO powder.
2.3. Preparation of GO/VE nanocomposite
The GO nanoparticles were dispersed in the polymeric matrix (VE) with the help of tetrahydrofuran (THF) solvent. Different weight contents of GO (0.05, 0.1, 0.4, 1.5, 3.0 wt%) were first ultrasonicated in 50 mL of THF solvent for 1 h. The homogeneous solution of GO, in THF, was then mixed with 100 g VE monomer. The mixture stirred and ultrasonicated, for 30 min. The mixture was degassed at 60 °C in a vacuum oven for 10 h to remove the solvent and all of the bubbles. Afterwards, 1.5 mL MEKP (catalyst) and 0.3% cobalt (accelerator) were added and the mixture stirred again. In this step, some of the viscous solution was separated and used for DSC studies. The mixture was put into a stainless steel mold. Then, the cured plates were pre-cured in an oven at 80 °C for 2 h and post-cured at 120 °C for another 1 h. The cured GO/VE nanocomposite was used for SEM, TGA and mechanical tests.
2.4. Characterization
X-ray diffraction (XRD) was measured using a Bruker D/Max2550 V X-ray diffractor (Rigaku, Japan) with Cu Kα radiation (λ = 1.5418 Å) at a scan rate of 2 min−1 between 2–45°. Fourier transform infrared (FTIR) spectra for graphene oxide were recorded using an Excalibur 3100 FTIR (Varian, USA) between 500 and 4000 cm−1. TGA and DSC were studied using a Mettler Toledo-TGA/DSC1 (OH, USA) under a nitrogen gas flow of 22 mL min−1. To start the non-isothermal DSC tests, 25 mg of the homogeneous mixture was put in the DSC sample cell at 25 °C. The sample was heated at a constant heating rate (5, 10, 15, and 20 °C min−1). The range of temperature was from 25 to 160 °C under a nitrogen gas flow of 22 mL min−1. Weight loss and degradation of the GO/VE nanocomposite was investigated by TGA under a nitrogen gas flow of 22 mL min−1 and heating rate of 10 °C min−1. For optimum properties, samples were cured at 80 °C for 2 hours and post-cured at 120 °C for 1 hour before beginning the TGA and SEM test. For each TGA test, 25 mg of the cured sample was used. Dynamic mechanical thermal analysis (DMTA) was made using a (dynamic mechanical analyzer-NETZSCH, DMA 242) at 1 Hz with a constant heating rate of 3 °C min−1 ranging from 30 to 250 °C. The sample dimensions were 15 × 4 × 0.5 mm. The glass transition temperature (Tg) was obtained from the maximum peak temperature of the loss factor curve. A tensile test was performed at room temperature using an Ametek Ls100 plus, following the ASTM D-638 procedure. Dumbbell-shaped sample dimensions were 80 × 12.5 × 4 mm and the crosshead speed was 1.0 mm min−1. SEM images were taken by a TESCAN Vega TS 5136mm (Czech Republic). A UP400S powerful sonicator (Hielscher, DE) was used for dispersion of graphene oxide in the GO/VE nanocomposite.
3. Results and discussion
3.1. XRD and FT-IR evaluation
XRD patterns of graphite, graphene oxide and GO/VE nanocomposite are shown in Fig. 2. The peak at 2θ = 26.55 for graphite corresponds to the diffraction of the (002) graphite plane composed to an interlayer spacing of 0.355 nm.20 The peak at 2θ = 9.45 (graphene oxide) corresponds to the diffraction of the (002) graphite oxide plane. The interlayer spacing of the graphite oxide can be obtained according to Bragg’s law:
| nλ = 2dsinθ |
where n is the diffraction series, λ is the X-ray wavelength, and d is the interlayer spacing of graphene oxide. The calculated value of d (0.935 nm), implies that the sample is expanded when graphite is oxidized. However, this peak has disappeared in graphene, indicating that the distances between the graphene layers have been greatly expanded and the layers are disordered.21
 |
| | Fig. 2 XRD patterns of (a) graphite, graphene oxide, and graphene, (b) neat VE resin and its composites containing different contents of GO. | |
Moreover, the FT-IR spectrum of graphene oxide was taken and is shown in Fig. 3. GO showed a peak at 3390 cm−1 attributed to the stretching vibration of hydroxyl (OH) groups, a peak at 1720 cm−1 attributed to the C![[double bond, length as m-dash]](https://www.rsc.org/images/entities/char_e001.gif) O stretching vibration, a peak at 1618 cm−1 attributed to the CC in aromatic ring, a peak at 1413 cm−1 attributed to the –OH deformation vibration, and a peak at 1047 cm−1 attributed to the C–O–C in epoxide.13,22
O stretching vibration, a peak at 1618 cm−1 attributed to the CC in aromatic ring, a peak at 1413 cm−1 attributed to the –OH deformation vibration, and a peak at 1047 cm−1 attributed to the C–O–C in epoxide.13,22
 |
| | Fig. 3 FT-IR spectrum of the graphene oxide. | |
3.2. Curing kinetics and modeling
Non-isothermal DSC was used at four heating rates (5, 10, 15, and 20 °C min−1) to study the kinetics of the cure reaction of VE resin with and without added GO. The results are illustrated in Fig. 4. The exothermic peak temperature Tp for both systems containing VE and 0.3% GO + VE, shifted to lower temperatures with decreasing heating rates. The values of peak temperatures and heats of reaction are shown in Table 1. A comparison of values for both systems shows an increase in Tp for 0.3% GO + VE nanocomposite.
 |
| | Fig. 4 Dynamic DSC curves at different heating rates for (a) VE and (b) VE + 0.3% GO. | |
Table 1 Total dynamic heat of cure reaction and dependence of the peak properties at different heating rates (5, 10, 15, and 20 °C min−1)
| Sample |
VE |
VE + 0.3% GO |
| Heating rate q (°C min−1) |
5 |
10 |
15 |
20 |
5 |
10 |
15 |
20 |
| Heat of reaction (J g−1) |
65.06 |
65.13 |
61.84 |
74.51 |
71.18 |
66.12 |
63.98 |
78.28 |
| Tp (K) |
350.15 |
363.65 |
372.55 |
378.67 |
351.15 |
366.45 |
374.25 |
383.15 |
| (dα/dT) (K−1) |
0.00283 |
0.00275 |
0.00268 |
0.00264 |
0.00285 |
0.00273 |
0.00267 |
0.00261 |
| ln(q/Tp2) |
−10.11 |
−9.489 |
−9.133 |
−8.774 |
−10.11 |
−9.505 |
−9.14 |
−8.901 |
In the dynamic curing process, the cure rate is a function of the degree of cure and temperature. All kinetic models have a same basic form as shown below:23
| |
 | (1) |
In eqn (1), dα/dt is the cure reaction rate, k(T) is the rate constant and can be defined by the Arrhenius equation, α is the fractional conversion at a time t, f(α) is function of α and depends on the reaction mechanism. Eqn (2) shows the Arrhenius equation:
| | |
k(T) = Ae−(Ea/RT)
| (2) |
where
A is the pre-exponential factor,
R is the gas constant,
T is the absolute temperature, and
Ea is the activation energy. Combining
eqn (2) and
(1):
| |
 | (3) |
Eqn (4) indicates the relationship between dα/dt and dα/dT:
| |
 | (4) |
where d
T/d
t is the constant heating rate
q. Combining
eqn (4) into
eqn (3) and taking the logarithm:
| |
 | (5) |
In eqn (5), the Kissinger and Ozawa methods were used to obtain the pre-exponential factor and activation energy.24,25 f(α) depends on the mechanism of curing and may have different forms. In the autocatalytic reactions, f(α) may have the following form with orders of cure reaction m and n:
Putting f(α) from eqn (6) into eqn (5):
| |
 | (7) |
The following equation is the linear equation between heating rate dT/dt and the reciprocal of the peak temperature Tp:
| |
 | (8) |
where
c and −
Ea/
R are the intercept and slope of the curve, respectively. The term of
c can be defined as follows:
| |
 | (9) |
where
Ā is the average value of the pre exponential factors for all heating rates,
Tp is the absolute temperature for the exothermic peak, (d
α/d
T)
p is the derivative of the degree of cure temperature and
αp is the degree of cure at the exothermic peak.
Eqn (10) shows the Kissinger equation,
24 where
q is the constant heating rate (d
T/d
t).
| |
 | (10) |
To determine the activation energy Kissinger and Ozawa equations were used and the results are illustrated in Fig. 5 and 6, respectively. There was a very good linear relationship between heating rate and the reversal of the exothermic peak temperature Tp for Kissinger and Ozawa methods. The values of activation energy Ea were calculated from slopes of each exothermic peak and the results are given in Table 2. By comparing the activation energy for both systems of resin (VE and 0.3% GO + VE), it can be suggested that GO acts as a catalyst, improved the cure reaction and decreased activation energy values. According to Table 2, activation energies were decreased in the Ozawa method for the GO/VE nanocomposite.
 |
| | Fig. 5 Kissinger plots for VE and VE + 0.3% GO. The activation energies were determined by peak temperatures at heating rates of 5, 10, 15, and 20 °C min−1. | |
 |
| | Fig. 6 Ozawa plots for VE and VE + 0.3% GO. The activation energies were determined by peak temperatures at heating rates of 5, 10, 15, and 20 °C min−1. | |
Table 2 Ea values determined by Kissinger and Ozawa method
| |
VE |
VE + 0.3% GO |
| Kissinger method. Ozawa method. |
| Eaa (kJ mol−1) |
56.6 |
43.6 |
| Eab (kJ mol−1) |
59.8 |
49.0 |
The isoconversional plots were obtained by using eqn (5). The isoconversional plots indicated the details of the VE curing process. The isoconversional plots are illustrated in Fig. 7. In these figures, each curve has the same α. There was a good linear relationship for all the isoconversional curves. The activation energy was calculated from the slope at each degree of cure for VE and 0.3% GO + VE nanocomposite. The activation energy Ea as a function of the degree of cure (conversion) is shown in Fig. 8. As shown in Fig. 8, activation energy Ea decreased on addition of 0.3% of GO. The values of Ea are shown in Table 3.
 |
| | Fig. 7 Isoconversional plots for the logarithmic heating rate versus the reciprocal of the absolute temperature (T): (a) VE and (b) VE + 0.3% GO. | |
 |
| | Fig. 8 Activation energy (Ea) as a function of conversion. Ea calculated by isoconversional plots. | |
Table 3 Ea values determined by isoconversional plots with different α values
| |
α |
| 5% |
10% |
20% |
30% |
40% |
50% |
60% |
70% |
80% |
90% |
95% |
| (VE). (VE + 0.3% GO). |
| Eaa (kJ mol−1) |
61.00 |
59.81 |
57.82 |
56.36 |
55.34 |
54.53 |
53.90 |
53.16 |
52.22 |
50.54 |
49.07 |
| Eab (kJ mol−1) |
38.94 |
38.67 |
38.65 |
38.97 |
39.35 |
39.64 |
39.87 |
39.92 |
39.74 |
39.28 |
38.91 |
In this section, the dynamic curing process was modeled to predict the degree of cure and cure rate of vinyl ester resin.26 In previous research,27 the curing process of the resin was complicated and there were two exothermic peaks, but in this work there is only one exothermic peak. Now, we need to obtain the pre-exponential factor A, activation energy Ea and orders of cure reaction (m and n) for each reaction at the different heating rates (5, 10, 15, and 20 °C min−1). The terms of pre-exponential factor A and activation energy Ea achieved by the specifications of the peaks and the orders of cure reaction (m and n) were determined by multiple regression operations.
The rearrangement of eqn (10) gives the average pre-exponential factor Ā:
| |
 | (11) |
The pre-exponential factor A changes with the heating rate q. We can use a new parameter Ar (Ar = A/Ā) to find a form of the pre-exponential factor A at different heating rates (5, 10, 15, and 20 °C min−1). Ar is the correction factor and applying this correction improves the fitting results. Ar changes with the heating rate q. Replacing (Ā) and (A/Ar) in eqn (11), yields:
| |
 | (12) |
Combining eqn (6) and (12) into eqn (3):
| |
 | (13) |
A multiple nonlinear least squares regression method (based on the Levenberg Marquardt algorithm) was used to determine the Ar, m and n (eqn (13)). The details of the reaction (peak) for different heating rates can be obtained from the curve fitting results. The values of the parameters of Ar, m and n were obtained by using a multiple nonlinear regression method. The values of Ar, m and n at different heating rates are shown in Table 4. All of the reactions (peaks) for both systems of VE and GO/VE nanocomposite showed the behavior of an autocatalytic reaction. The pre-exponential factor at each heating rate was obtained by using eqn (12) and the results are listed in Table 4. The kinetic parameters for each reaction (peak) were determined and we could obtain the values of degree of cure α and cure rate dα/dt for each peak by solving the differential equations.
Table 4 Dynamic kinetic parameters obtained by a multiple nonlinear least-squares regression
| |
Heating rate (°C min−1) |
Ar |
ln(A) |
m |
n |
| VE |
5 |
0.12583 |
13.87911858 |
0.53746 |
0.9475 |
| 10 |
0.14729 |
13.92202914 |
0.50535 |
1.0254 |
| 15 |
0.14210 |
13.77594843 |
0.48115 |
0.9262 |
| 20 |
0.13959 |
13.85013758 |
0.50958 |
1.0521 |
| VE + 0.3% GO |
5 |
0.12213 |
9.871135344 |
0.44666 |
0.8000 |
| 10 |
0.12652 |
10.02502643 |
0.55969 |
0.8610 |
| 15 |
0.14395 |
10.08545156 |
0.53159 |
0.9103 |
| 20 |
0.14151 |
10.15694283 |
0.62305 |
1.0042 |
Putting eqn (4) and (6) into eqn (3) and rearranging:
| |
 | (14) |
Eqn (14) is a nonlinear differential equation. The independent variable is the absolute temperature T and the dependent variable is the degree of cure α. There is no analytical solution for eqn (14). Matlab software (ode45, Runge–Kutta 4, 5 algorithm) was used to obtain a numerical solution. The values of the degree of cure α were calculated at each heating rate (5, 10, 15, and 20 °C min−1). The plots of the degree of cure versus the temperature for VE are shown in Fig. 9. The procedure was repeated for 0.3% GO + VE nanocomposite and the plots of the degree of cure versus the temperature are shown in Fig. 10. At all heating rates for VE and GO/VE nanocomposite, the calculated degree of cure α agreed well with the experimental data. The dependence of dα/dT on temperature was obtained by differentiating the degree of cure α with respect to the temperature T. Using eqn (4), the cure rates dα/dt for α versus temperature T were calculated. The results are illustrated in Fig. 11 and 12 for VE and 0.3% GO + VE nanocomposite, respectively. As shown in Fig. 11 and 12, the calculated curing rates predicted the peaks in the curing process and there was a good agreement between the model and the experimental data for all heating rates.
 |
| | Fig. 9 Comparison of model and experimental data for degree of cure as a function of temperature for VE by the method based on the Kissinger and Ozawa at heating rates of 5, 10, 15 and, 20 °C min−1. | |
 |
| | Fig. 10 Comparison of model and experimental data for degree of cure as a function of temperature for VE + 0.3% GO by the method based on the Kissinger and Ozawa at heating rates of 5, 10, 15 and, 20 °C min−1. | |
 |
| | Fig. 11 Comparison of model and experimental data for cure rate as a function of temperature for VE by the method based on the Kissinger and Ozawa at heating rates of 5, 10, 15 and, 20 °C min−1. | |
 |
| | Fig. 12 Comparison of model and experimental data for cure rate as a function of temperature for VE + 0.3% GO by the method based on the Kissinger and Ozawa at heating rates of 5, 10, 15 and, 20 °C min−1. | |
3.3. Dynamic mechanical properties
Information on the storage modulus and loss factor (tandelta) of a cured resin and its composites can be measured by dynamic mechanical analysis (DMA).28 Fig. 13a and b show the storage modulus and loss factor of neat VE and GO/VE composites. As shown in Fig. 13a, the incorporation of GO sheets leads to an increase of the storage modulus in the whole temperature range. This can be well explained by the reinforcing effect of the nanofiller leading to an increase of stiffness.29 The increase of storage modulus is due to the nanofiller reinforcement and the mobility restriction of the matrix chains induced by the formed covalent bonds between the epoxy matrix and the sheets.22,29 The tandelta value is the ratio of the loss modulus to the storage modulus, and the peak of tandelta is often used to obtain the Tg.30 The Tg values of GO/VE composites are listed in Table 5. As shown in Table 5 and, Fig. 13b the Tg of the GO/VE composites has shifted to a higher temperature compared with that of neat VE. The storage moduli of the composites show increase with the sheet weight loading. The wrinkled morphology of graphene oxide sheets with high specific surface area is speculated to constrain the segmental movement of matrix chains to a certain degree. Therefore, these results slightly increase the Tg value.22,31
 |
| | Fig. 13 Dynamic mechanical properties of neat VE and its composites: (a) storage modulus and (b) tandelta. | |
Table 5 Mechanical and thermal properties of neat VE and its composites with different filler loadings
| Sample |
Tensile strength (MPa) |
Elongation at break (%) |
Tg (°C) |
| Neat VE |
63.03 ± 5.03 |
3.99 ± 0.44 |
159.0 |
| VE + 0.05% GO |
68.15 ± 4.88 |
4.18 ± 0.64 |
161.1 |
| VE + 0.1% GO |
80.30 ± 5.14 |
5.46 ± 0.69 |
163.5 |
| VE + 0.3% GO |
87.08 ± 5.33 |
5.91 ± 0.39 |
166.2 |
| VE + 0.4% GO |
84.10 ± 5.10 |
5.72 ± 0.55 |
169.1 |
3.4. Tensile mechanical tests and fracture surface analysis of cured nanocomposites
Typical stress–strain curves of VE and its composites with different filler loadings are shown in Fig. 14a. The tensile properties are listed in Table 5. As shown in Fig. 14a and b the highest increase in tensile strength is almost 38% (from 63.03 to 87.08 MPa) at a GO loading of 0.30 wt%. Further increase in GO content impairs tensile strength slightly. Similarly, the elongation at break shows an increase at a loading of 0.30 wt% and then decreases with further increase of the GO content (Fig. 14c). It can be observed that the tensile strength of the VE depends on the percent of graphene oxide. With increasing graphene oxide, the vinyl ester resin becomes harder to break, thus the samples with a higher percent of GO show more tensile strength. However, the GO/VE nanocomposite prepared with 0.3% GO shows higher elongation and tensile strength than the GO/VE prepared with 0.4% GO. The decrease of tensile strength with a higher percent of GO may be attributed to poor linkage, weak interface, and micro bubbles formed between the resin matrix and GO. Scanning electron microscopy was used to study the different morphologies of the fracture surface. Fig. 15 shows SEM images of fracture surfaces of cured vinyl ester resin filled with different GO contents. The vinyl ester resins are brittle and the graphene oxide is stiff. Therefore, addition of GO to the matrix of VE resin leads to a fracture mechanism causing cracks. As shown in Fig. 15, the surface of neat VE is almost smooth. VE resins prepared with different amounts of GO show a rough fracture surface. It can be concluded that a rough surface can be attributed to the polymer deformation.32
 |
| | Fig. 14 Tensile properties of neat VE and its composites with different filler loadings: (a) stress–strain curves, (b) tensile strength, (c) elongation at break. | |
 |
| | Fig. 15 SEM image of fracture surfaces of VE and GO/VE nanocomposite, (a) neat VE, (b) 0.3 wt% of GO and (c) 0.5 wt% of GO. | |
3.5. Thermal stability
The thermal stability of the cured GO/VE nanocomposite was investigated with a TGA test. To provide more detail different contents of GO were used. Fig. 16 shows TGA and DTG curves of the cured VE and GO/VE nanocomposite under nitrogen flow. The weight loss rates of the nanocomposite were reduced and thermal stability was improved in the GO/VE nanocomposite. The initial decomposition temperature (IDT), the temperature of maximum rate of weight loss (Tmax) and the percent of char yield (Chr. Y.) for VE and its nanocomposites are shown in Table 6. As shown in Table 6, the char yields at 593 °C increased from 6.8% to 15.2% with increasing GO loading contents to the VE. The increased thermal stability with addition of GO sheets is attributed to a higher heat capacity of the sheets and a better barrier effect of GO sheets. These effects retard the volatilization of polymer decomposition products.22 The decomposition temperature shows the cross-link density of thermoset resins. Therefore, the increase of decomposition temperature might be also interpreted by the non-stoichiometry caused by incorporation of GO in the resin matrix.33 The increasing of char yields agrees with the mechanism of flame retardancy.34 Thus, the addition of GO to the VE improved the polymer thermal resistance and flame retardancy.
 |
| | Fig. 16 Thermo gravimetric analysis of cured VE and GO/VE nanocomposite, (a) TGA and (b) DTG. | |
Table 6 Thermal degradation data of the cured samples
| Sample |
IDTa (°C) |
Tb (°C) |
Tmaxc (°C) |
Chr. Y.d (%) |
| Initial decomposition temperature. Temperature for 10% of weight loss. Temperature of maximum weight loss. Char yield at 593 °C. |
| Neat VE |
338 |
377.38 |
419.41 |
6.7 |
| VE + 0.3% GO |
339 |
378.45 |
419.55 |
7.1 |
| VE + 1.5% GO |
339 |
381.51 |
419.10 |
8.3 |
| VE + 3.0% GO |
340 |
380.01 |
420.51 |
15.2 |
4. Conclusions
The effect of GO on the cure kinetics of VE resin in the presence of 0.3% GO was studied. To determine the activation energy of the cure reaction of VE, a non-isothermal DSC method, Ozawa and Kissinger equations were used. The Ea value of the cure reaction of the GO/VE nanocomposite decreased. It is concluded that the GO acted as a catalyst in the reaction of the VE/GO nanocomposite. The non-isothermal DSC curves of the cured resin were modeled by the Matlab program. The models agreed well with the experimental data for all heating rates (5, 10, 15, and 20 °C min−1). The dynamic mechanical analysis showed that the matrix become stiffer after addition of a low content of GO sheets and the glass transition temperatures (Tg) shifted to a higher temperature compared with neat VE. Stress–strain tests showed that the tensile strength of the 0.4% GO/VE nanocomposite is less than of the 0.3% GO/VE. This decrease may be attributed to poor linkage, weak interface, and micro bubbles formed between the resin matrix and GO. TGA tests indicated that the char yields increased with the addition of GO to the VE and improved the polymer thermal resistance and flame retardancy.
Acknowledgements
The authors would like to thank the National Iranian Oil Company research and technology directory and Islamic Azad university of Shiraz for financial support.
References
- C. Jang, T. E. Lacy, S. R. Gwaltney, H. Toghiani and C. U. Pittman, Macromolecules, 2012, 45, 4876 CrossRef CAS.
- S.-H. Liao, M.-C. Hsiao, C.-Y. Yen, C. C. M. Ma, S. J. Lee, A. Su, M. C. Tsai, M. Y. Yen and P. L. Liu, J. Power Sources, 2010, 195, 7808 CrossRef CAS.
- A. Chaturvedi and A. Tiwari, Adv. Mater. Lett., 2013, 4, 656 CAS.
- Z. Guo, T. Pereira, O. Choi, Y. Wang and H. T. Hahn, J. Mater. Chem., 2006, 16, 2800 RSC.
- X. Zhang, V. Bitaraf, S. Wei and Z. Guo, AIChE J., 2014, 60, 266 CrossRef CAS.
- Z. Guo, H. W. Ng, G. L. Yee and H. T. Hahn, J. Nanosci. Nanotechnol., 2009, 9, 3278 CrossRef CAS PubMed.
- E. T. Thostenson and T.-W. Chou, Carbon, 2006, 44, 3022 CrossRef CAS.
- L.-C. Tang, H. Zhang, S. Sprenger, L. Ye and Z. Zhang, Compos. Sci. Technol., 2012, 72, 558 CrossRef CAS.
- L.-C. Tang, Y.-J. Wan, K. Peng, Y.-B. Pei, L.-B. Wu, L.-M. Chen, L. J. Shu, J.-X. Jiang and G.-Q. Lai, Composites, Part A, 2013, 45, 95 CrossRef CAS.
- A. M. Rafiee, J. Rafiee, Z. Wang, H. Song, Z.-Z. Yu and N. Koratkar, ACS Nano, 2009, 3, 3884 CrossRef PubMed.
- E. Alishahi, S. Shadlou, S. Doagou and M. R. Ayatollahi, Macromol. Mater. Eng., 2013, 298, 670 CrossRef CAS.
- H. Kim, A. A. Abdala and C. W. Macosko, Macromolecules, 2010, 43, 6515 CrossRef CAS.
- G. Tang, Z.-G. Jiang, X. Li, H.-B. Zhang, S. Hong and Z.-Z. Yu, Composites, Part B, 2014, 67, 564 CrossRef CAS.
- S. Biswas, H. Fukushima and L. T. Drzal, Composites, Part A, 2011, 42, 371 CrossRef.
- Z. Wang, P. Wei, Y. Qian and J. Liu, Composites, Part B, 2014, 60, 341 CrossRef CAS.
- Z. Guo, X. Liang, T. Pereira, R. Scaffaro and H. T. Hahn, Compos. Sci. Technol., 2007, 67, 2036 CrossRef CAS.
- Z. Guo, S. Wei, B. Shedd, R. Scaffaro, T. Pereira and H. T. Hahn, J. Mater. Chem., 2007, 17, 806 RSC.
- Y. Zhu, S. Murali, W. Cai, X. Li, J. W. Suk, J. R. Potts and R. S. Ruoff, Adv. Mater., 2010, 22, 3906 CrossRef CAS PubMed.
- W. S. Hummers and R. E. Offeman, J. Am. Chem. Soc., 1958, 80, 1339 CrossRef CAS.
- H.-K. Jeong, Y. P. Lee, R. J. W. E. Lahaye, M.-H. Park, K. H. An, I. J. Kim, C.-W. Yang, C. Y. Park, R. S. Ruoff and Y. H. Lee, J. Am. Chem. Soc., 2008, 130, 1362 CrossRef CAS PubMed.
- D. A. Nguyen, Y. R. Lee, A. V. Raghu, H. M. Jeong, C. M. Shin and B. K. Kim, Polym. Int., 2009, 58, 412 CrossRef CAS.
- Y.-J. Wan, L.-C. Tang, L.-X. Gong, D. Yan, Y.-B. Li Li, L.-B. Wu, J.-X. Jiang and G.-Q. Lai, Carbon, 2014, 69, 467 CrossRef CAS.
- J. Gonis, G. P. Simon and W. D. Cook, J. Appl. Polym. Sci., 1999, 72, 1479 CrossRef CAS.
- H. E. Kissinger, Anal. Chem., 1957, 29, 1702 CrossRef CAS.
- T. Ozawa, J. Therm. Anal. Calorim., 1970, 2, 301 CrossRef CAS.
- M. Hayaty, M. H. Beheshty and M. Esfandeh, J. Appl. Polym. Sci., 2011, 120, 62 CrossRef CAS.
- V. Arabli and A. Aghili, Adv. Compos. Mater., 2015, 24, 561 CrossRef CAS.
- Q. Feng, X.-J. Shen, J.-P. Yang, S.-Y. Fu, Y.-W. Mai and K. Fried, Polymer, 2011, 52, 6037 CrossRef CAS.
- L.-C. Tang, Y.-J. Wan, D. Yan, Y.-B. Pei, L. Zhao, Y.-B. Li, L.-B. Wu, J.-X. Jiang and G.-Q. Lai, Carbon, 2013, 60, 16 CrossRef CAS.
- X. Zhang, Q. He, H. Gu, S. Wei and Z. Guo, J. Mater. Chem. C, 2013, 1, 2886 RSC.
- T. Ramanathan, A. A. Abdala, S. Stankovich, D. A. Dikin, M. Herrera-Alonso, R. D. Piner, D. H. Adamson, H. C. Schniepp, X. Chen, R. S. Ruoff, S. T. Nguyen, I. A. Aksay, R. K. Prud’Homme and L. C. Brinson, Nat. Nanotechnol., 2008, 3, 327 CrossRef CAS PubMed.
- J. Zhu, S. Wei, J. Ryu, M. Budhathoki, G. Liang and Z. Guo, J. Mater. Chem., 2010, 20, 4937 RSC.
- Q. Liu, X. Zhou, X. Fan, C. Zhu, X. Yao and Zh. Liu, Polym.-Plast. Technol. Eng., 2012, 51, 251 CrossRef CAS.
- M. Gao, W. Wu and Y. Yan, J. Therm. Anal. Calorim., 2009, 95, 605 CrossRef CAS.
|
| This journal is © The Royal Society of Chemistry 2016 |