
 Open Access Article
 This Open Access Article is licensed under a Creative Commons Attribution-Non Commercial 3.0 Unported Licence
Industrially scalable and cost-effective Mn2+ doped ZnxCd1−xS/ZnS nanocrystals with 70% photoluminescence quantum yield, as efficient down-shifting materials in photovoltaics†
I.
Levchuk
ab,
C.
Würth
c,
F.
Krause
a,
A.
Osvet
a,
M.
Batentschuk
*a,
U.
Resch-Genger
*c,
C.
Kolbeck
d,
P.
Herre
e,
H. P.
Steinrück
d,
W.
Peukert
e and
C. J.
Brabec
abf
aFriedrich-Alexander-Universität Erlangen-Nürnberg, Materials for Electronics and Energy Technology (i-MEET), Martensstraße 7, 91058 Erlangen, Germany. E-mail: miroslaw.batentschuk@fau.de
bEnergy Campus Nürnberg (EnCN), Fürther Str. 250, 90429 Nürnberg, Germany
cDivision Biophotonics, BAM Federal Institute for Materials Research and Testing, Richard-Willstaetter-Str. 11, D-12489 Berlin, Germany. E-mail: ute.resch@bam.de
dChair of Physical Chemistry II, University of Erlangen-Nürnberg, Egerlandstr. 3, 91058 Erlangen, Germany
eInstitute of Particle Technology, Friedrich-Alexander-Universität Erlangen-Nürnberg, Cauerstraße 4, 91058 Erlangen, Germany
fZAE Bayern, Renewable Energies, Haberstr. 2a, 91058 Erlangen, Germany
First published on 6th January 2016
Abstract
We present colloidally stable and highly luminescent ZnxCd1−xS:Mn/ZnS core–shell nanocrystals (NCs) synthesized via a simple non-injection one-pot, two-step synthetic route, which can be easily upscaled. A systematic variation of the reaction component, parameters and thickness of the ZnS shell yielded doped nanocrystals with a very high photoluminescence quantum yield (Φpl) of 70%, which is the highest value yet reported for these Mn-doped sulfide-semiconductor NCs. These materials can be synthesized with high reproducibility in large quantities of the same high quality, i.e., the same Φpl using accordingly optimized reaction conditions. The application of these zero-reabsorption high quality NCs in the light conversion layers, deposited on top of a commercial monocrystalline silicon (mono-Si) solar cell, led to a significant enhancement of the external quantum efficiency (EQE) of this device in the ultraviolet spectral region between 300 and 400 nm up to ca. 12%. EQE enhancement is reflected by an increase in the power conversion efficiency (PCE) by nearly 0.5 percentage points and approached the theoretical limit (0.6%) expected from down-shifting for this Si solar cell. The resulting PCE may result in a BoM (bill of materials) cost reduction of app. 3% for mono-Si photovoltaic modules. Such small but distinct improvements are expected to pave the road for an industrial application of doped semiconductor NCs as cost-effective light converters for silicon photovoltaic (PV) and other optoelectronic applications.
Broader contextThe low efficiencies of inorganic solar cells in the ultraviolet (UV) and blue spectral region are key factors which restrict their power conversion efficiency (PCE). A simple and reliable technological step to overcome these limitations, which can be easily introduced into the manufacturing process, is the coating of the cover glass or the solar cells/modules by a light-converting material with high absorption in the UV-blue, luminescence in the active solar cell region, and a high photoluminescence quantum yield/efficiency. The resulting conversion of UV/blue light to the active spectral region of the solar cell can improve PCE by several percentage points, especially in the case of thin-film solar cells based on CuInGaSe2 or CdTe. Due to the already relatively high efficiency of the monocrystalline silicon (mono-Si) solar cells in the UV (about 45% at 300 nm) the expected improvement of the PCE of these cells is about 0.6 percentage points. Due to the high market share of the mono-Si modules, this improvement is expected to be nevertheless very profitable. To demonstrate the potential of this concept using the most promising type of light converters, that is, zero-reabsorption doped semiconductor quantum dots (QDs), we developed a simple non-injection one-pot, two-step synthetic route towards ZnxCd1−xS:Mn/ZnS core–shell nanocrystals showing a broad and efficient emission centered at 598 nm, which can be easily upscaled, and a simple coating technique to generate down shifting layers applicable to conventional mono-Si solar cells. With this approach, we could improve the efficiency of a commercial Si solar cell by up to ca. 12% in the UV spectral region which led to an enhancement of PCE by nearly 0.5 percentage points and will enable a cost reduction of ca. 3.3%. Our simple strategy is expected to encourage solar module manufacturers to also equip their photovoltaic modules with light converting layers and pave the road to a broader application of solar cells. |
Introduction
During the past few decades, doped semiconductor quantum dots (d-dots) have been increasingly studied since they retain nearly all intrinsic advantages of quantum dots (QDs) and benefit from larger Stokes shifts, minimum reabsorption, and longer excited state lifetimes related to dopant emission.1 Especially Mn2+-doped chalcogenide nanocrystals (NCs)2,3 together with Cu+-doped materials of the same composition4,5 have the potential to become a new class of emissive nanomaterials with high application potential as optical reporters in bioanalysis and active components in optical devices like solar cells. This, however, correlates with advances in synthetic routes that yield high quality d-dots with a photoluminescence quantum yield (Φpl) of at least 50% with a high reproducibility and can be upscaled.One of the best studied d-dots are Mn2+-doped Zn and Cd chalcogenide NCs and their alloys.1 The luminescence of these NCs is governed by the 4T1–6A1 emission of Mn2+ in the orange wavelength region of 580–600 nm, which is nearly independent of the host material and crystal size. These d–d transitions are spin and parity forbidden, which leads to small absorption cross sections, hindering direct optical excitation, and a long intrinsic luminescence lifetime in the order of milliseconds. The absorption properties of these doped NCs are largely determined by the host matrix, which – together with an efficient energy transfer from the host to the Mn2+ ions – ensures bright photoluminescence. As photon absorption occurs mainly by the host lattice, the luminescence properties of doped QDs are similarly sensitive to surface defects like conventional semiconductor NCs, rendering the passivation of surface states, which favor the non-radiative relaxation of the charge carriers formed upon light absorption, the main factor controlling Φpl of these d-dots. Surface state passivation can be achieved by a crystalline shell of a wide bandgap semiconductor like ZnS.6 Moreover, the shell material can enable band gap engineering to control the location of the charge carriers photogenerated in the core.7 Yang et al.8 recently presented a detailed study on factors governing the PL of Mn2+-doped CdS/ZnS core–shell NCs including the influence of the spatial localization of Mn2+ ions inside core–shell QDs as well as the role of surface trap states and energy transfer mechanisms. In this respect, they also reported a surface modification procedure to eliminate surface states, which yielded Mn2+-doped NCs with Φpl in the order of 50%. This is the first example of d-dots with Φpl comparable to common undoped AIIBVI core–shell QDs.8–10
The synthesis of highly luminescent doped NCs requires reproducible and eventually up-scalable procedures which enable the control of all parameters affecting crystal growth and the incorporation of doping ions as well as proper surface passivation. Presently, high-quality doped QDs are efficiently synthesized via high temperature synthetic routes to minimize the formation of surface defects.1 It is, however, challenging to incorporate dopant ions into a host QD lattice without simultaneously reducing Φpl due to the size mismatch between host cations and dopant ions (e.g., the ion radius of Mn2+, 0.85 Å, differs from that of Zn2+, i.e., 0.75 Å, and Cd2+, i.e., 0.95 Å)11 and the “self-purification” effect.12 A key factor for obtaining high-quality doped QDs is the timing of dopant addition.13 There are three strategies to introduce dopant ions into host QDs: dopant introduction together with the host precursors,14–16 before nucleation of the host material,2,3 and during shelling of the host QD.17 Methods for the direct introduction of Mn2+ ions into a growing core or shell are very sensitive to different synthetic parameters, and hence frequently suffer from reproducibility problems. As a new approach to the synthesis of Mn2+-doped QDs, here exemplarily for ZnSe systems, Pradhan et al. utilized the initial formation of MnSe seeds followed by the chemical substitution of Mn by Zn at a higher temperature in organic solvents.2 For Mn2+-doped ZnSe core NCs with a ZnS or a ZnSe shell, using this method Φpl up to values 60% could be realized,18,19 yet this required a complicated multistep hot injection phosphine strategy. In the case of injection-based methods, several kinetic and thermodynamic factors such as temperature instability, mixture heterogeneity, and overall high reaction rates and limited mass-transfer rates, however, often hinder the reproducible preparation of high quality nanocrystals with high Φpl on a large scale. Injection-based shelling methods involving the gradual injection of shell precursors at elongated temperatures can allow the formation of gradient core–shell QDs with a smooth potential barrier for electrons and holes, without strains or interfacial defects, and, as a consequence, Φpl approaches 100% as recently shown for undoped II–VI semiconductor QDs.20 This can also be utilized to introduce dopant ions during shelling of the host QD. Alternatives present non-injection syntheses.21 Such methods have been reported also for the preparation of Mn2+-doped CdS/ZnS,8 CuInS/ZnS22 and MnS/ZnS/CdS23 core–shell QDs, yielding brightly emitting doped QDs with a Φpl of 56–68%. These non-injection methods require, however, several steps to obtain the final high quality products, which hampers upscaling.
The application of very promising Mn-doped QDs as fluorescent reporters and active materials in white light emitting diodes and spectral converters in photovoltaics (PV)24–26 calls for simple and reproducible synthetic procedures using inexpensive precursors that yield high amounts of strongly luminescent NCs. This can be best met using a one-pot approach. The Φpl of Mn2+-doped QDs synthesized via one pot reactions are presently, however, still comparatively low, with maximum Φpl values of 30%.24,27 This is ascribed to the general challenge to incorporate Mn2+ into the host lattice and insufficient passivation of surface defects.11
In this paper we present an industrially scalable and cost-effective one-pot, two-step non-injection synthesis for highly luminescent ZnxCd1−xS:Mn/ZnS NCs. A consequent optimization of the synthetic route for NC core synthesis as well as for surface passivation with a ZnS shell allowed us to achieve the highest Φpl reported to date for this material.
To underline the application potential of the these nanoparticles, doped NCs with high Φpl were subsequently used for the fabrication of down-shifting layers and coupled to monocrystalline silicon (mono-Si) solar cells, resulting in an enhanced external quantum efficiency (EQE) in the UV-blue spectral range and an overall higher AM1.5 power conversion efficiency (PCE). The industrial relevance of this approach was carefully examined by performing a BoM (bill of materials) and BoS (bill of system) analysis for NC based PL conversion layers for mono-Si modules.
Experimental section
Chemicals
Zinc acetate (Zn(OAc)2, 99.99%), cadmium oxide (CdO, 99.99%), manganese acetate (Mn(OAc)2, 99.99%), sulfur powder (99.99%), dodecanethiol (DDT, 99.9%), oleic acid (OA, 90%), oleylamine (OAm, 70%, technical grade), and 1-octadecene (ODE, 90%) were purchased from Sigma-Aldrich. All chemicals were used without further purification. Zn1−xCdxS:Mn and the core/shell NCs were synthesized based on a previously reported protocol4 with slight modifications.Preparation of stock solutions
The Zn, Cd, and Mn stock solutions were prepared in an air-free glovebox. The 0.1 M Zn stock solution was obtained by dissolving 0.220 g (1 mmol) of Zn(OAc)2 in 0.8 mL of OAm, and 9.2 mL of ODE at 160 °C. For the 0.1 M Cd stock solution, 0.128 g (1 mmol) of CdO were dissolved in 2.0 mL of OA, and 8.0 mL of ODE at 160 °C. The 0.01 M Mn stock solution was prepared by dissolving 0.017 g (0.05 mmol) of Mn(OAc)2 in 1 mL of OAm, and 9 mL of ODE at 80 °C. For the preparation of the ZnS shell, we used a 0.4 M Zn stock solution, made by dissolving 0.878 g (4 mmol) of Zn(OAc)2 in 3.0 mL of OAm and 7 mL of ODE at 160 °C. The 0.4 M ODE-S solution was obtained by dissolving 0.128 g of sulfur (4.0 mmol) in 10.0 mL of ODE at 160 °C. All stock solutions were stored at 50 °C in a glovebox before use.Synthesis of ZnxCd1−xS:Mn NCs
All syntheses were carried out using Schlenk line under a nitrogen atmosphere; isolation and purification of the NCs were carried out in air. In a typical procedure, 1 mL of DDT and 2 mL of ODE were filled into a 50 mL three-neck flask in a heating mantle, heated to 40 °C under vacuum, and kept under these conditions for 1 h to remove oxygen and water. Then, the reaction mixture was cooled to room temperature and purged with nitrogen. Subsequently, 1.0 mL of a 0.1 M Zn stock solution (0.1 mmol), 1.0 mL of a 0.1 M Cd stock solution (0.1 mmol), 1 mL of a 0.01 M Mn stock solution (0.01 mmol), and 1.0 mL of a 0.4 M ODE-S solution (0.4 mmol) were added. The reaction mixture was heated to 230 °C with a heating rate of 12 °C min−1 under nitrogen flux and kept at this temperature to grow ZnxCd1−xS:Mn NCs. For the monitoring of the reaction and the optimization of the reaction parameters with respect to the optical properties of our NCs, aliquots of the NC dispersion were taken at different reaction times, injected into cold toluene to terminate the NC growth, and then diluted with chloroform for spectroscopic measurements. After completion of NC growth, the reaction mixture was cooled to 60 °C and 10 mL of toluene or chloroform was added. The NCs were precipitated by the addition of an excess of ethanol, removed from the dispersion by centrifugation (8000 rpm, 10 min), and purified four times by a precipitation/re-dispersion method using a solvent mixture of chloroform and ethanol (2/4 volume mixture). The purified NCs were then re-dispersed in chloroform. To obtain ZnxCd1−xS:Mn NCs with different Zn/Cd ratios, the Zn/Cd precursor ratio was varied while all other variables were kept constant.Deposition of the ZnS shell
Shelling of the ZnxCd1−xS:Mn cores with different layers of ZnS was performed using the crude Mn:ZnxCd1−xS reaction mixture after reaching a temperature of 230 °C when the emission of the core NCs was maximum. 3.0 mL of a 0.4 M stock solution of the Zn precursor were injected into the reaction mixture in 0.5 mL portions drop by drop at time intervals of 15 min. For the monitoring and optimization of the shelling procedure with respect to maximum NC brightness, NC aliquots were taken before the injection of a new portion of Zn stock solution and spectroscopically studied in chloroform. The purification of ZnxCd1−xS:Mn/ZnS NCs was performed similar to that of ZnxCd1−xS:Mn NCs.Scaling up of NC synthesis
The amount of all components used for the previously described synthesis of ZnxCd1−xS:Mn was increased 40 times. Briefly, 40 mL of DDT and 80 mL of ODE were filled into a 500 mL three-neck flask and heated to 40 °C under vacuum. At room temperature, 40 mL of a 0.1 M Zn stock solution (4 mmol), 40 mL of a 0.1 M Cd stock solution (4 mmol), 40 mL of 0.01 M Mn stock solution (0.4 mmol), and 40 mL of a 0.4 M ODE-S solution (16 mmol) were added. The reaction mixture was heated to 230 °C to obtain ZnxCd1−xS:Mn NCs. For coating with a ZnS shell, the entire stock solution of the 0.4 M Zn precursor (120 mL) was injected in six 10 mL portions drop by drop into the reaction vessel at intervals of 15 min at 230 °C. After the completion of particle growth, the reaction mixture was cooled to 60 °C and 250 mL of toluene or chloroform were added. Purification was performed as previously described, taking into account the upscaling factor.Deposition of the down-shifting layer
NCs were deposited directly onto the surface of 41 × 19.5 × 0.3 mm solar cells (LEMO-SOLAR GmbH), previously cleaned with ethanol and dried, using a doctor blade technique. For the preparation of the coating solutions from different concentrations of ZnxCd1−xS:Mn/ZnS NCs, the NCs were precipitated from chloroform dispersions by the addition of ethanol. The separated NCs were dried overnight in a vacuum oven and subsequently dispersed in toluene with different amounts, here 0.5–25 mg mL−1. For NC deposition, the temperature of the doctor blade hot plate was set to 40 °C, the blade gap was set to 400 μm, and 200 μL of each solution were coated with a speed of 10 mm s−1. After NC coating, all solar cells were annealed at 80 °C for 5 min to remove traces of organic solvent.Material characterization
Energy-dispersive X-ray spectroscopy (EDX)
The elemental analysis of the NCs was done using a Philips ESEM XL30 scanning electron microscope equipped with a field emission gun and operated at 10 kV.Transmission electron microscopy (TEM) and high resolution transmission electron microscopy (HRTEM)
TEM and HRTEM images were recorded using a PHILIPS CM 300 UT high-resolution transmission electron microscope (300 kV acceleration voltage, 0.17 nm point resolution at Scherzer defocus, equipped with a LaB6 filament and a CCD camera with an image size of 2048 × 2048 pixels. Samples for TEM were prepared by casting one drop of the NC dispersion onto a standard copper grid coated with a continuous amorphous carbon film. The size distribution were obtained from the TEM image with ImageJ software and covering >100 particles for each sample.X-ray powder diffraction (XRD)
X-ray diffraction measurements were carried out using a Siemens D500 X-ray diffractometer under Cu Kα radiation (λ = 1.5406 Å). Before each measurement, the purified NCs were dried in a vacuum oven at 60 °C overnight.Fourier transform infrared spectroscopy (FTIR)
FTIR measurements were done using a VERTEX-70 spectrometer (Bruker Optik GmbH).Scanning electron microscopy (SEM)
Images were taken using a FEI-Quanta 200 scanning electron microscope at an operation voltage of 20 kV.X-ray photoelectron spectroscopy (XPS)
The XP spectra were collected using a non-monochromated Mg Kα anode operated at a power of 238 W, and an Omicron Argus electron analyzer; the pass energy was set to 200 eV for survey spectra and to 35 eV for detailed spectra. The binding energy axis is referenced to the C 1s signal at 285.0 eV. The samples investigated by XPS were prepared by dripping the NC dispersion on a Mo-based sample holder, which was transferred to the XPS chamber using a load-lock system. To remove the residual solvent, the sample was heated to 60 °C in situ prior to the measurement.Optical measurements
The absorption spectra of the NC dispersions were taken on a Perkin-Elmer Lambda 950 spectrometer and emission spectra on a Jasco Spectrofluorometer FP-8500. The emission spectra shown were corrected for the wavelength-dependent spectral responsivity of the fluorometer.Lifetime measurements
The photoluminescence decay curves were measured by exciting the dispersed nanoparticle samples using a pulsed Xe lamp (pulse width 4 μs) through a 360 nm bandpass filter. The emission was dispersed using an H10 monochromator (Jobin-Yvon), detected using a 9816 photomultiplier (EMI) and recorded using a digital oscilloscope TDS540 (Tektronix).Measurement of Φpl
Φ pl were measured absolutely using a calibrated integrating sphere setup at BAM reported previously.54,55 This involves the determination of the absorbed photon flux (qabsp(λem)) and the emitted photon flux (qemp(λem)) by a sample (see eqn (1)) using an integrating sphere setup.54 | (1) |
The emitted photon flux follows from the blank and spectrally corrected emission spectrum of the sample (Ix(λem)) integrated over the emission band. The absorbed photon flux is calculated from the difference between the transmitted excitation light with the blank (Ib(λex)) and the sample (Ix(λex)), within the wavelength region of the excitation bandwidth. s(λem) and s(λex) represent the spectral responsivity of the detection system in the spectral regions of emission and excitation.
Solar cell characterization
A solar simulator (Oriel Sol 1A, Newport) with an AM1.5G spectrum operated at 100 mW cm−2 was used for illumination of the solar cells. A source measurement unit (Botest LIV) was used to record the current–voltage curves. EQE measurements were carried out using a quantum efficiency (QE) measurement system QE-R from Enlitech.Results and discussion
Synthesis of doped NCs
The phosphine-free synthesis of ZnxCd1−xS:Mn/ZnS core/shell NCs was performed via a non-injection route based on a doping technique utilizing nucleation, where the starting materials for the core of the NC and the dopant precursor are loaded together into the reaction vessel at room temperature. The main steps of this synthesis, which is based on a modified method by Zhang et al.4 for ZnxCd1−xS:Cu, are shown in Fig. 1 and subsequently described; more details are given in the Experimental section. The PL mechanism of Mn-doped NCs is completely different from the one of Cu-doped NCs. In the case of Cu doping, electrons from the conduction band of the host material recombine with holes in the Cu-mediated state. Different from this, Mn doping leads to a recombination process within d–d levels of Mn2+. Therefore, a deep and systematic revision of the previously reported synthetic approach4 for Cu-doped ZnxCd1−xS NCs was required. We fabricated highly regular Mn2+ doped ZnxCd1−xS NCs which were further effectively passivated with a ZnS shell and report here for the first time the synthesis methods and the extended characterization. | ||
| Fig. 1 Schematic illustration of the one pot, two step synthesis of ZnxCd1−xS:Mn/ZnS core–shell NCs. | ||
A mixture of the solvents dodecanethiol (DDT) and octadecene (ODE) was degassed, stock solutions of the Zn, Cd, and Mn-precursors as well as an ODE-sulfur solution were added, and the reaction mixture was heated to 230 °C under nitrogen flow and continuous stirring. After the completion of particle growth, the reaction mixture was cooled to 60 °C. The resulting doped NCs were precipitated by the addition of ethanol and purified using a precipitation/re-dispersion method. For control of the synthesis and optimization of the reaction conditions, aliquots of the reaction mixture were taken at different temperatures and times and spectroscopically studied. The growth experiments were performed mainly with a Zn/Cd/Mn precursor ratio of 50/50/5, which was the first parameter optimized through this procedure.
Structural characterization
The results of the structural characterization of the ZnxCd1−xS:Mn NCs by transmission electron microscopy (TEM), X-ray diffraction (XRD) and Fourier transform infrared spectroscopy (FTIR) are summarized in Fig. 2a–e. All NCs reveal a near-spherical shape and possess high size uniformity (Fig. 2a and b). The size of the nanoparticles was estimated from transmission electron microscopy (TEM) to be 2.88 ± 0.4 nm with a size distribution of only 14% and 3.23 ± 0.42 nm with a size distribution of 13% for Zn0.5Cd0.5S:Mn and Zn0.5Cd0.5S:Mn/ZnS, respectively. Interplanar spacing in the single nanoparticles was obtained by high resolution transmission electron microscopy (HRTEM) analysis. In both, core and core/shell NCs the interplanar spacing is 0.32 nm, which is in between the spacing for CdS (0.33544 nm) and ZnS (0.31261) for the 111 plane of the cubic structure. Wide-angle XRD patterns summarized in Fig. 2c reveal the phase and elemental composition of representatives Zn0.5Cd0.5S:Mn core NCs (lower spectrum) and Zn0.5Cd0.5S:Mn/ZnS core/shell NC (upper spectrum) samples, which display the characteristic peaks of the zinc blende (cubic) structure, located between those of cubic ZnS and CdS materials, respectively. This confirms the Zn0.5Cd0.5S alloy structure. Coating the ZnS shell over the Zn0.5Cd0.5S core also slightly changed the lattice constant from 5.57 to 5.50 Å. Due to the similar lattice parameter of ZnS and Zn0.5Cd0.5S and a likely atomic diffusion at the core/shell interface, it was not possible to differentiate the core from the shell by HRTEM. This phenomenon is well known for different kinds of core/shell structures, such as Ag/Au,57 NaYbF4:Er/NaYF458 or CdSe-core CdS/Zn0.5Cd0.5S/ZnS5 multishell nanocrystals. The crystallite size for ZnxCd1−xS:Mn and ZnxCd1−xS:Mn/ZnS thin powder layers was determined from the XRD pattern to be 3.05 and to 3.5 nm using a Gaussian fit and the Debye–Scherrer formula, respectively. This is in excellent agreement with the results from HRTEM. | ||
| Fig. 2 TEM and HRTEM images of (a) Zn0.5Cd0.5S:Mn and (b) ZnS-coated Zn0.5Cd0.5S:Mn NCs; the corresponding size distributions obtained by TEM are given as insets. (c) XRD patterns of the two NC samples. The standard data for the ZnS zinc blende bulk material (top, ICSD 00-005-0566) and zinc blende bulk CdS (bottom, ICSD pattern 01-080-0019) are shown as reference. (d) FTIR spectra of Zn0.5Cd0.5S:Mn(5%)/ZnS NCs, and (e) an enlarged view of the same spectra in the wavelength region of 2380–2880 cm−1 for the NCs and DDT. | ||
The FTIR spectra of purified Zn0.5Cd0.5S:Mn(5%)/ZnS NCs shown in Fig. 2d and e provide information on the surface chemistry of the doped QDs. The bands in the range of 3000–2800 cm−1 are attributed to C–H stretching vibrations of dodecanethiol (DDT) and oleic acid (OA) and to the asymmetric vibration of CH3 (2955 cm−1) as well as the asymmetric (2922 cm−1) and symmetric stretching of CH2 (2853 cm−1), respectively. The peak at 1708 cm−1 is ascribed to the C![[double bond, length as m-dash]](https://www.rsc.org/images/entities/char_e001.gif) O stretching vibrations of OA. The band at 1560 cm−1 corresponds to the carboxylate groups of the OA ligands and provides evidence for a coordinative bond between this group and Zn2+ or Cd2+ cations on the NC surface.28 A comparison of the IR spectra of pure DDT and the NC samples (Fig. 2, panel e) shows that the weak S–H vibrational band at 2576 cm−1 found in DDT is absent in the NCs. This confirms the broken S–H bonds due to chemisorption of thiolates onto the surface of the NCs.29,30 Hence, DDT serves not only as a capping ligand, but also as a sulfur source for shell growth. Moreover, the CH2 scissoring mode (1464 cm−1) and the CH3 symmetric bending vibration (1377 cm−1) of DDT and the in-plane OH bending vibrations of OA30 are observed. The EDX analysis of the elemental composition of the ZnxCd1−xS:Mn/ZnS and ZnxCd1−xS:Mn dots shown in the ESI,† (Fig. S1A and B) reveals Zn, S, Cd, and Mn peaks, with the growth of the ZnS shell around the ZnxCd1−xS:Mn core being reflected by an increased intensity of the Zn peak. The ratio between Zn and S increased from one in the ZnxCd1−xS:Mn cores to four in the core/shell ZnxCd1−xS:Mn/ZnS NCs.
O stretching vibrations of OA. The band at 1560 cm−1 corresponds to the carboxylate groups of the OA ligands and provides evidence for a coordinative bond between this group and Zn2+ or Cd2+ cations on the NC surface.28 A comparison of the IR spectra of pure DDT and the NC samples (Fig. 2, panel e) shows that the weak S–H vibrational band at 2576 cm−1 found in DDT is absent in the NCs. This confirms the broken S–H bonds due to chemisorption of thiolates onto the surface of the NCs.29,30 Hence, DDT serves not only as a capping ligand, but also as a sulfur source for shell growth. Moreover, the CH2 scissoring mode (1464 cm−1) and the CH3 symmetric bending vibration (1377 cm−1) of DDT and the in-plane OH bending vibrations of OA30 are observed. The EDX analysis of the elemental composition of the ZnxCd1−xS:Mn/ZnS and ZnxCd1−xS:Mn dots shown in the ESI,† (Fig. S1A and B) reveals Zn, S, Cd, and Mn peaks, with the growth of the ZnS shell around the ZnxCd1−xS:Mn core being reflected by an increased intensity of the Zn peak. The ratio between Zn and S increased from one in the ZnxCd1−xS:Mn cores to four in the core/shell ZnxCd1−xS:Mn/ZnS NCs.
Influence of NC growth parameters on PL properties
To optimize the PL properties of our NCs, we assessed different reaction parameters including temperature, ratio of the metal ion precursors, dopant ion concentration, and shell thickness. Crystal formation and NC growth due to the decomposition of the metalloorganic complexes starts at about 125 °C as indicated by a change in the color of the solution from colorless to yellow and then to light orange.31 This was confirmed by absorption and emission measurements summarized in Fig. 3. The broad shoulder in the absorption spectrum at ca. 400 nm (Fig. 3b, left axis), which undergoes a small red shift from 400 to 404 nm with increasing reaction time, is assigned to the first excitonic transition of the ZnxCd1−xS NCs. Such a poorly resolved excitonic absorption peak is characteristic of ternary and quaternary alloyed NCs. Its width points to a wide size distribution and the irregular composition distribution.4 The more or less constant spectral shape during a growth period of 3 h indicates no significant changes in alloy composition. The NCs extracted at 150 °C already showed a bright emission (Fig. 3a). The highest emission intensity was revealed by samples taken at 230 °C (time “0” at the y-axis in Fig. 3a). Longer reaction times and hence, further NC growth resulted in a rapid decrease in emission intensity. Fig. 3b (Fig. 3b, right axis) summarizes the corresponding emission spectra, which are not normalized to better visualize changes in the spectral shape and PL intensity with temperature and reaction time. These spectra contain the characteristic 4T1–6A1 emission of Mn2+ (see the inset in Fig. 3h) with its maximum at 598 nm, matching the values reported for ZnCdS:Mn materials with zinc-blende23 as well as wurtzite crystal structure,11 and a broad red PL band located at about 710 nm. The latter is attributed to emission from defect states or Mn2+ ions at or near the surface of ZnCdS:Mn.32,33 Due to the “self-purification” effect,12 a relatively large number of Mn2+ ions can be located in the vicinity of the surface in these NCs after long annealing times at 230 °C, which may account also for the reduction of the Mn2+ PL intensity in Fig. 3a. The intensity of the long wavelength band at 150 °C is rather high for doped NCs as a homogeneous Mn2+ distribution can be expected under these reaction conditions. Thus, an additional contribution from the emission of Cd2+ species due to local inhomogeneity cannot be excluded. For example, an extrinsic deep-level emission at about 710 nm has also been reported for CdS,23,33 which disappeared after coating of the NCs with a ZnS shell. | ||
| Fig. 3 (a) Dependence of the intensity of the Mn2+ emission at 598 nm on reaction time and temperature. The PL intensities are normalized to the maximal Mn2+ PL intensity of the NCs taken from the reaction mixture directly after reaching 230 °C. (b) Thermal and temporal evolution of absorption (left axis) and emission spectra (right axis) of (unshelled) Zn0.5Cd0.5S NCs doped with 5 mol% of Mn2+ using excitation wavelengths (λex) of 375 and 390 nm for the sample taken at 150 °C and 175 °C, respectively, and 400 nm for all other samples to always excite each sample at the first excitonic absorption maximum. (c) PL intensity at different Cd/Zn precursor ratios and (d) the corresponding absorption (left axis) and normalized emission (right axis, excitation at the first excitonic absorption maximum of each sample) spectra of Zn1−xCdxS:Mn/ZnS NCs. For all core compositions in panels c, d, e, and f, the NCs were coated with one layer of ZnS. (e) PL intensity of undoped Zn0.5Cd0.5S/ZnS and Zn0.5Cd0.5S/ZnS doped with different Mn2+ concentrations (λex = 400 nm). (f) Absorption (left axis) and normalized emission spectra (right axis) of undoped Zn0.5Cd0.5S/ZnS and Mn2+-doped NCs. (g) Dependence of the PL intensity on the number of ZnS coating layers, and (h) evolution of the corresponding absorption (left axis) and normalized emission spectra (right axis, λex = 400 nm) of the Zn0.5Cd0.5S:Mn core (black curve) and Zn0.5Cd0.5S:Mn/ZnS core–shell particles, doped with 5 mol% Mn2+. All absorption spectra were recorded with samples having the same absorbance at the first excitonic absorption band/transition. The inset in panel (h) illustrates light absorption associated with the valence band-conduction band transition, energy transfer from the accordingly formed exciton to the Mn2+ ions, and the nonradiative relaxation initiated by surface defects (SD). All measurements were performed with NCs dispersed in chloroform. | ||
Cd/Zn molar ratio
To study the effect of the Cd/Zn molar ratio on the incorporation of Mn2+ into the crystal lattice and the optical properties of the resulting ZnxCd1−xS:Mn2+/ZnS NCs, we prepared samples with Cd/Zn ratios of 0.5, 1, and 2, respectively and kept the concentration of the Mn2+ precursor in the reaction mixture constant at 5 mol%. Subsequently, the NCs were coated with a single layer of ZnS by the addition of the Zn precursor to the reaction mixture at 230 °C, see the Experimental section.As follows, for example, from Fig. 3d, the absorption spectra recorded at Cd/Zn ratios of 0.5, 1, and 2, respectively, reflect the change of the NC composition from Zn-rich to the Cd-rich samples by a red shift of the first excitonic maximum from ca. 395 to ca. 420 nm. The most intriguing change in emission is the suppression of the red PL at ca. 710 nm by the ZnS shell (Fig. 3d, right axis). This underlines its origin from Mn2+ ions at or near the surface. Although the spectral position of the emission maximum of the Mn2+ (d5) ion depends on the crystal field,34 the spectral shape and position of the emission band at 598 nm (Fig. 3d, right axis), which arises from the 4T1–6A1 transition of Mn2+ ions, is only slightly affected by the Cd/Zn ratio, with Zn-rich NCs (Cd/Zn ratio of 0.5) revealing a small red shift compared to Cd-rich NCs. This is in agreement with the data published by Chen et al.,27 Xua et al.,35 and Kim et al.24 The intensity of the Mn2+ emission is maximum for a Cd/Zn ratio of one (Fig. 3c). This is consistent with the results reported by Nag et al.,11 who studied the influence of the Mn2+ concentration as a function of the lattice mismatch between MnS and ZnxCd1−xS NCs and found an efficient incorporation of Mn2+ ions into the wurtzite host lattice of ZnxCd1−xS for a Cd/Zn ratio of one. This seems to be also true for ZnxCd1−xS NCs with a zinc blende structure as predicted by Klimov et al.,36 because the enthalpy of Mn2+ ion doping is minimized at this NC composition.
Dopant ion concentration
The dependence of the PL intensity of the Mn-doped ZnxCd1−xS/ZnS (x = 0.5) NCs on the Mn2+ concentration is summarized in Fig. 3e for concentrations of the Mn-precursor of 0.5% to 10% and the corresponding absorption and normalized emission spectra are shown in Fig. 3f. The presence of Mn2+ and its oxidation state were confirmed by EDX and XPS measurements (ESI,† Fig. S4, S1A and B). Doping of ZnxCd1−xS/ZnS (x = 0.5) NCs with increasing concentrations of Mn2+ barely affects the absorption spectra of these materials, which are dominated by optical transitions of the host matrix (first excitonic transition and band–band transitions) in contrast to the emission spectra and especially the PL intensity. As shown in Fig. 3f, the incorporation of Mn2+ shifts the initially broad emission of the undoped ZnxCd1−xS QDs, originating from a broad distribution of shallow trapped states,33,37 to 598 nm, i.e., to the typical Mn2+ emission band, and leads to a narrowing of the PL band with increasing Mn2+ concentration. The highest PL intensity is reached for samples grown from stock solutions containing 5 mol% of the Mn precursor (Fig. 3e). Higher dopant ion concentrations lead to a decrease in PL intensity. This reflects two processes, the incorporation of the Mn2+ ions into the crystal lattice of the NCs, acting as luminescence centers, and concentration quenching at higher Mn2+ doping concentrations due to energy transfer and energy migration between neighboring Mn2+ ions, with Mn2+ ions located at or near the surface acting as energy sinks. Concentration quenching in d-dots has been reported also by other groups.11,38 For example, Nag et al.11 observed maximum PL intensities for unshelled Zn0.49Cd0.51S:Mn doped with about 1% Mn2+ and Kole et al.38 realized maximum PL intensities of unshelled ZnS d-dots with a Mn2+ doping concentration of 1.1%. We ascribe our observation of Mn2+ concentration quenching at considerably higher dopant ion concentrations to the protective ZnS shell of our NCs, which shields surface or near surface Mn2+ ions. Also, Mn2+ ions may partially diffuse into the shell during its formation, which affects Mn2+–Mn2+ distances and hence, energy transfer and energy migration between neighboring Mn2+ ions.Influence of ZnS shell thickness
A common approach to increase Φpl of binary or ternary semiconductor NCs such as CdSe,39 CdTe,40 CuInS241–43 and d-dots like ZnCdS:Mn,27 Zn1−x−yCdxMnyS7 and ZnSe:Mn44 presents the shelling of their surface with a higher band gap semiconductor (e.g., ZnS, CdS) or with more sophisticated multi-shells like ZnS/CdS23 or CdS/Zn0.5Cd0.5S/ZnS5 to passivate dangling bonds and surface states favoring radiationless decay or emission with a low intensity from trapped states. The beneficial influence of a surface shell follows also from Fig. 3c and d depicting the influence of a single shell on the PL properties of our ZnxCd1−xS:Mn NCs. For maximum Φpl,45,46 the shell thickness needs to be optimized material-specifically. Hence, we studied the influence of the ZnS shell thickness on the PL intensity of already optimized d-dots, here Zn0.5Cd0.5S:Mn cores (Zn/Cd ratio of 1![[thin space (1/6-em)]](https://www.rsc.org/images/entities/char_2009.gif) :1), doped with 5 mol% Mn. For this purpose, shelling with ZnS was performed in a simple one pot reaction at 230 °C by stepwise injection of identical amounts of a stock solution of the Zn precursor in time intervals of 15 min. At this temperature the alloying effect is absent. Zhong and co-workers59 defined 270 °C as the “alloying point” analogous to melting or boiling points, for the CdSe/ZnSe and CdSe/ZnS systems. Below this temperature the alloying process between the core and the shell is energetically disadvantageous. The ZnS shell grown in these 15 min is considered as one layer. The corresponding absorption and normalized emission spectra and the resulting PL intensities are summarized in Fig. 3g and h, respectively. The growth and increasing thickness of the ZnS shell is confirmed by the increasing absorption in the UV region of 320 to 370 nm (Fig. 3h) and the disappearance of the red emission at 710 nm (Fig. 3b and h). Additional proof for the ZnS shell is the increased Zn content in the core/shell NCs when compared to the uncoated core. Both, EDX and XPS spectra confirm an enhancement of the Zn/Cd ratio for the core/shell particles (ESI,† Fig. S4, S1A and B), and the prolongation of the photoluminescence lifetime from 0.89 to 2.85 ms, does not allow any other conclusion than the formation of a ZnS shell acting as effective surface passivation layer (Fig. 4). The spectral position of the Mn2+ emission is independent of the number of ZnS layers, whereas its intensity strongly increases with shell thickness. A single ZnS layer enhances the PL intensity of the Zn0.5Cd0.5S core, showing a Φpl below 4%, already by a factor of 14 (Fig. 3g). The photoluminescence decay curves of Zn0.5Cd0.5S:Mn and Zn0.5Cd0.5S:Mn/ZnS nanocrystals are shown in Fig. 4. The intensity averaged lifetime τ given by
:1), doped with 5 mol% Mn. For this purpose, shelling with ZnS was performed in a simple one pot reaction at 230 °C by stepwise injection of identical amounts of a stock solution of the Zn precursor in time intervals of 15 min. At this temperature the alloying effect is absent. Zhong and co-workers59 defined 270 °C as the “alloying point” analogous to melting or boiling points, for the CdSe/ZnSe and CdSe/ZnS systems. Below this temperature the alloying process between the core and the shell is energetically disadvantageous. The ZnS shell grown in these 15 min is considered as one layer. The corresponding absorption and normalized emission spectra and the resulting PL intensities are summarized in Fig. 3g and h, respectively. The growth and increasing thickness of the ZnS shell is confirmed by the increasing absorption in the UV region of 320 to 370 nm (Fig. 3h) and the disappearance of the red emission at 710 nm (Fig. 3b and h). Additional proof for the ZnS shell is the increased Zn content in the core/shell NCs when compared to the uncoated core. Both, EDX and XPS spectra confirm an enhancement of the Zn/Cd ratio for the core/shell particles (ESI,† Fig. S4, S1A and B), and the prolongation of the photoluminescence lifetime from 0.89 to 2.85 ms, does not allow any other conclusion than the formation of a ZnS shell acting as effective surface passivation layer (Fig. 4). The spectral position of the Mn2+ emission is independent of the number of ZnS layers, whereas its intensity strongly increases with shell thickness. A single ZnS layer enhances the PL intensity of the Zn0.5Cd0.5S core, showing a Φpl below 4%, already by a factor of 14 (Fig. 3g). The photoluminescence decay curves of Zn0.5Cd0.5S:Mn and Zn0.5Cd0.5S:Mn/ZnS nanocrystals are shown in Fig. 4. The intensity averaged lifetime τ given by | (2) |
 | ||
| Fig. 4 PL decay curves of the Zn0.5Cd0.5S:Mn and Zn0.5Cd0.5S:Mn/ZnS NCs with six Zn precursor injection. Chloroform solutions of the NCs exited using a Xe-lamp at 320 nm, and detection wavelength at 600 nm for both samples. | ||
The highest Φpl achieved for our core–shell NCs using this strategy amounts to 70%. This Φpl is the highest value reported for Mn2+-doped sulfide-semiconductor NCs,6,9,17,21,24,27,35,36 (also see ESI,† Table S1) which were, however, prepared using much more sophisticated synthetic schemes as our simple one pot reaction.
Up-scaling
The use of doped NCs e.g., for the fabrication of more efficient solar cells or other opto-electronic devices requires synthetic procedures that efficiently and reproducibly yield a large amount of high quality NC material. We subsequently studied the upscaling of our simple one pot, two step synthesis of Zn0.5Cd0.5S:Mn/ZnS with optimum luminescence properties. Hence, the amount of all components was increased by a factor of 40 compared to the initially used synthesis (see the Experimental section). This allowed for the preparation of 3.5 g of Zn0.5Cd0.5S:Mn/ZnS NCs in identical quality (Fig. S3, ESI†).Mn2+-doped ZnxCd1−xS/ZnS NCs as converter materials in Si solar cells
To demonstrate the application potential of our optimized Mn2+-doped ZnxCd1−xS/ZnS NCs, we employed this material as a UV-to-visible light converter in monocrystalline silicon (mono-Si) solar cells to improve the otherwise low sensitivity of mono-Si solar cells in the UV and blue spectral region by shifting the energy of these otherwise unused photons to a spectral region of higher sensitivity of the mono-Si cell.47 Semiconductor NCs like CdSe/CdS, ZnSe, CdSe/ZnSe, Zn0.5Cd0.5S/ZnS have already been used as effective UV-light converter materials for downshifting layers,48–51 yet not ternary Mn-doped NCs. The scheme of the down-shifting mechanism and a schematic representation of our proof-of-concept converter film – mono-Si-solar cell system are shown in Fig. 5a. | ||
| Fig. 5 Performance of mono-Si solar cells coated with Zn0.5Cd0.5S:Mn(5%)/ZnS NCs, using a volume 200 μL of the differently concentrated NC dispersion. (a) Scheme of the down-shifting mechanism of the Zn0.5Cd0.5S:Mn(5%)/ZnS NC converter material and the design of proof-of-concept solar cells. (b) EQE of the best mono-Si solar cell (black curve) obtained with a Zn0.5Cd0.5S:Mn(5%)/ZnS NC dispersion containing 10 mg mL−1 NCs (red curve); the EQE in the wavelength region of 300 to 400 nm is magnified in the inset. (c) J–V curves of the corresponding solar cells. (d) SEM picture of the mono-Si solar cell surface structure coated with 5 mg mL−1 NC solution. (e) Cross-section of the same mono-Si solar cell with 260 nm NC thickness. | ||
For this purpose, we dispersed Zn0.5Cd0.5S:Mn(5%)/ZnS NCs with a Φpl of 70% in toluene at different concentrations of 0.5, 1, 2.5, 5, 10, 15, 20, 25 mg mL−1 and coated a thin film on a commercial mono-Si solar cell with a SiNx coated texture by the doctor blade technique. Subsequently, the resulting three solar cells were dried on a hot plate at 80 °C for 5 min. Then, the external quantum efficiency (EQE), i.e. the number of charge carriers to the number of incident photons ratio, and the current density (J)–voltage (V) curves (J–V diagrams) of the three solar cells depicted in Fig. 5a (right panel) were measured. The open-circuit voltage (UOC) and the fill factor (FF; FF = max. power/JSCUOC) are taken from the J–V measurements under the solar simulator, the short circuit current (JSC) was calculated from the EQE spectra, and after that the power conversion efficiency (PCE) was calculated. This is necessary, because due to the deviation of the spectrum of the solar simulator from the standard AM1.5G spectrum (much weaker emission at wavelengths below 400 nm), it is not possible to use the solar simulator for the characterization of the downshifting layers covered solar cells.
Measurements of the EQE curves of the mono-Si solar cells coated with different concentrations of Zn0.5Cd0.5S:Mn(5%)/ZnS NCs (Fig. 5b and Fig. S5A–S11A in the ESI†) reveal an increased EQE in the range of 0.5–15 mg mL−1 (Fig. 5b and Fig. S5A–S9A in the ESI†) and a significantly decreased EQE for higher concentrations of 20–25 mg mL−1 due to parasitic absorption by the thicker NC layer (ESI,† Fig. S10A and S11A). The optimized performance with an EQE enhancement of 12% is found for the layers coated with a 10 mg mL−1 concentrated solution (Fig. 5b).
The average thickness of the NC layer was determined by SEM cross section measurements and yielded values between <50 nm and 750 nm (Fig. 5e and Fig. S12A–E in the ESI†) for various concentrations. The best performing coating from the 10 mg mL−1 concentrated solution showed a layer thickness of 300 nm (Fig. S12C, ESI†) at an EQE enhancement of approx. 12% as shown in Fig. 6.
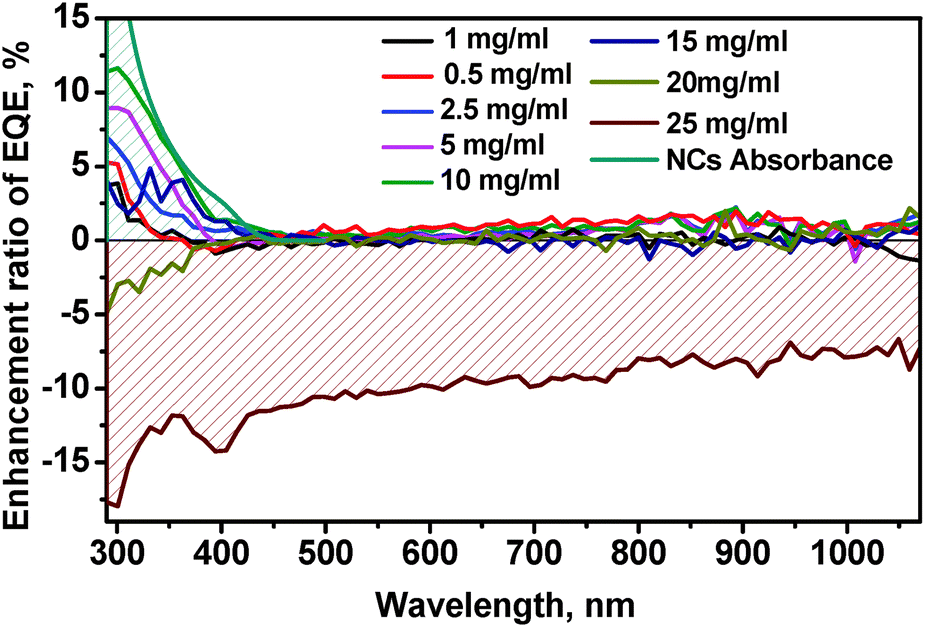 | ||
| Fig. 6 Enhancement ratio of the EQE of mono-Si solar cells as a function of wavelength for coating with differently concentrated Zn0.5Cd0.5S:Mn(5%)/ZnS NC dispersions. | ||
We also observed an enhancement of the EQE in the visible and in the NIR region, here mostly due to the NCs acting as antireflection coating on SiNx,53 as the refractive indexes of ZnCdS and SiNx are equal to 1.9552 and 2.0, respectively.
The results of the measurements of the current density (J)–voltage (V) curves (J–V diagrams) are shown in Fig. 5c and in Fig. S5B–S11B in the ESI.† Lower concentrated solution with 0.5–15 mg mL−1 (Fig. 5c and Fig. S5A–S8A in the ESI†) led to an increase in power conversion efficiency (PCE) and in short circuit current (JSC), demonstrating the down-shifting effect of our NCs. For the best sample of the mono-Si solar cell coated with 10 mg mL−1, PCE led to an enhancement by nearly 0.5 percentage points, which is close to the theoretical limit (0.6%) of the down-shifting layer for Si solar cells.47
The electrical characteristics of the solar cells coated with Zn0.5Cd0.5S:Mn(5%)/ZnS NCs are summarized in Table 1.
| Sample | U OC (V) | FF, % | J SC (mA cm−2) | PCE, % | Δ PCE, % | |
|---|---|---|---|---|---|---|
| 1 | Solar cell | 0.522 ± 0.0114 | 64.69 ± 0.2504 | 35.979 ± 0.0184 | 12.149 ± 0.0448 | +0.132 |
| Solar cell + 0.5 mg mL−1 QDs | 0.528 ± 0.0116 | 64.70 ± 0.8163 | 35.950 ± 0.0184 | 12.281 ± 0.0175 | ||
| 2 | Solar cell | 0.536 ± 0.0117 | 63.63 ± 0.8346 | 35.209 ± 0.0180 | 12.008 ± 0.1669 | +0.302 |
| Solar cell + 1 mg mL−1 QDs | 0.537 ± 0.0118 | 64.52 ± 0.6900 | 35.531 ± 0.0182 | 12.310 ± 0.1083 | ||
| 3 | Solar cell | 0.538 ± 0.0118 | 64.59 ± 0.9580 | 38.061 ± 0.0195 | 13.225 ± 0.1910 | +0.434 |
| Solar cell + 2.5 mg mL−1 QDs | 0.545 ± 0.0119 | 65.37 ± 0.5120 | 38.341 ± 0.0196 | 13.659 ± 0.2490 | ||
| 4 | Solar cell | 0.538 ± 0.0118 | 65.14 ± 1.151 | 38.414 ± 0.0197 | 13.463 ± 0.224 | +0.458 |
| Solar cell + 5 mg mL−1 QDs | 0.552 ± 0.0121 | 65.14 ± 0.605 | 38.716 ± 0.0198 | 13.921 ± 0.149 | ||
| 5 | Solar cell | 0.546 ± 0.0120 | 65.60 ± 0.622 | 38.499 ± 0.0197 | 13.809 ± 0.109 | +0.462 |
| Solar cell + 10 mg mL−1 QDs | 0.558 ± 0.0122 | 65.81 ± 0.754 | 38.861 ± 0.0199 | 14.271 ± 0.268 | ||
| 6 | Solar cell | 0.546 ± 0.0120 | 65.47 ± 0.7355 | 36.033 ± 0.0184 | 12.880 ± 0.3141 | ±0.02 |
| Solar cell + 15 mg mL−1 QDs | 0.549 ± 0.0120 | 65.61 ± 0.7580 | 36.013 ± 0.0184 | 12.900 ± 0.1433 | ||
| 7 | Solar cell | 0.534 ± 0.0117 | 65.86 ± 0.1542 | 35.866 ± 0.0183 | 12.613 ± 0.2162 | −0.025 |
| Solar cell + 20 mg mL−1 QDs | 0.534 ± 0.0117 | 66.01 ± 0.5872 | 35.795 ± 0.0183 | 12.588 ± 0.1913 | ||
| 8 | Solar cell | 0.538 ± 0.0118 | 65.66 ± 0.1443 | 35.857 ± 0.0183 | 12.667 ± 0.059 | −1.025 |
| Solar cell + 25 mg mL−1 QDs | 0.540 ± 0.0118 | 65.65 ± 0.1443 | 32.570 ± 0.0167 | 11.546 ± 0.0427 | ||
Although due to many research activities dedicated to new solar cells with improved efficiencies like perovskite, solar cells with an efficiency of more than 20%,56 the broad use of photovoltaics requires strategies for the simple and inexpensive upgrading of the currently used Si photovoltaic modules to increase their power conversion efficiency without costly replacement. In this respect, and to underline the application potential of these novel down-shifting layers, we performed a simple BoM and BoS cost calculation for the fabrication of photovoltaic (PV) modules based on our down-shifting design and summarized the findings in the ESI.† Based on this estimation, we conclude that the application of a thin layer of highly luminescent Zn0.5Cd0.5S:Mn/ZnS NCs (use of 0.2 mL of a dispersion of 2.5 mg mL−1 NC distributed on an area of 8 cm2), can decrease the production costs of a one Watt energy for a mono-Si solar module with a power of 117W by about 1.5 $ (3.3%) due to the enhanced efficiency in parallel to the unprecedented low costs of this novel converter material.
Conclusion and outlook
In summary, we developed a simple one-pot two-step synthesis route for high quality ZnxCd1−xS:Mn/ZnS NCs with a very high reproducibility. Very high photoluminescence quantum yields (Φpl) of up to 70% and the ease of upscaling this industrially compatible fabrication process make this doped semiconductor material a very promising candidate especially for photovoltaic and optoelectronic applications including light-emitting devices. The potential of these NCs follows from the exemplarily shown use of the Zn0.5Cd0.5S:Mn(5%)/ZnS NCs as down-shifting layer for the ultraviolet (UV) to orange wavelength region for monocrystalline silicon (mono-Si) solar cells. With our NCs and a simple coating technique, the efficiency of a commercial Si solar cell could be improved up to ca. 12% in the UV spectral region which led to an enhancement of PCE by nearly 0.5 percentage points. This allows a reduction of the production costs of mono-Si solar cell modules by around 3.33%. Future work on these doped ternary alloys will focus on the further improvement of their Φpl and their use as a down-shifting layer for different types of solar cells such as thin film, CuInS2 or organic solar cells with a low sensitivity in the blue and UV spectral region, thereby paving the road for the next generation of more efficient and less costly photovoltaic modules for the broad use of solar energy.Acknowledgements
This research was performed as part of the Energie Campus Nürnberg (EnCN) and supported by funding through the “Bavaria on the Move” initiative of the state of Bavaria and the project 1006-11 of the Bavaria Research Foundation (BFS). We gratefully acknowledge financial support from the Cluster of Excellence “Engineering of Advanced Materials” at the University Erlangen-Nürnberg and from the Federal Ministry for Economic Affairs and Energy (MNPQ program BMWI 11/12). We express our gratitude to Norman Lüchinger from Nanograde Ltd. for help in cost effective calculations and Alfons Stiegelschmitt for XRD measurements. P. H. acknowledges financial support from the DFG through the research training group 1896 “In situ microscopy with electrons, X-rays and scanning probes”. Electron microscopy resources have been kindly provided by the Center for Nanoanalysis and Electron Microscopy (CENEM).References
- P. Wu and X.-P. Yan, Chem. Soc. Rev., 2013, 42, 5489–5521 RSC.
- N. Pradhan, D. Goorskey, J. Thessing and X. Peng, J. Am. Chem. Soc., 2005, 127, 17586–17587 CrossRef CAS PubMed.
- N. Pradhan and X. Peng, J. Am. Chem. Soc., 2007, 129, 3339–3347 CrossRef CAS PubMed.
- W. Zhang, X. Zhou and X. Zhong, Inorg. Chem., 2012, 51, 3579–3587 CrossRef CAS PubMed.
- R. Xie, U. Kolb, J. Li, T. Basché and A. Mews, J. Am. Chem. Soc., 2005, 127, 7480–7488 CrossRef CAS PubMed.
- R. W. Knoss, Nova Science, New York, 2009, 691 Search PubMed.
- L. R. Bradshaw, K. E. Knowles, S. McDowall and D. R. Gamelin, Nano Lett., 2015, 15, 1315–1323 CrossRef CAS PubMed.
- Y. Yang, O. Chen, A. Angerhofer and Y. C. Cao, J. Am. Chem. Soc., 2006, 128, 12428–12429 CrossRef CAS PubMed.
- U. Resch-Genger, M. Grabolle, S. Cavaliere-Jaricot, R. Nitschke and T. Nann, Nat. Methods, 2008, 5, 763–775 CrossRef CAS PubMed.
- M. Grabolle, M. Spieles, V. Lesnyak, N. Gaponik, A. Eychmüller and U. Resch-Genger, Anal. Chem., 2009, 81, 6285–6294 CrossRef CAS.
- A. Nag, S. Chakraborty and D. D. Sarma, J. Am. Chem. Soc., 2008, 130, 10605–10611 CrossRef CAS PubMed.
- G. M. Dalpian and J. R. Chelikowsky, Phys. Rev. Lett., 2006, 96, 226802 CrossRef PubMed.
- P. I. Archer, S. A. Santangelo and D. R. Gamelin, J. Am. Chem. Soc., 2007, 129, 9808–9818 CrossRef CAS PubMed.
- F. V. Mikulec, M. Kuno, M. Bennati, D. A. Hall, R. G. Griffin and M. G. Bawendi, J. Am. Chem. Soc., 2000, 122, 2532–2540 CrossRef CAS.
- J. F. Suyver, S. F. Wuister, J. J. Kelly and A. Meijerink, Phys. Chem. Chem. Phys., 2000, 2, 5445–5448 RSC.
- D. J. Norris, N. Yao, F. T. Charnock and T. A. Kennedy, Nano Lett., 2001, 1, 3–7 CrossRef CAS.
- P. V. Radovanovic and D. R. Gamelin, J. Am. Chem. Soc., 2001, 123, 12207–12214 CrossRef CAS PubMed.
- R. Zeng, T. Zhang, G. Dai and B. Zou, J. Phys. Chem. C, 2011, 115, 3005–3010 CAS.
- R. Zeng, M. Rutherford, R. Xie, B. Zou and X. Peng, Chem. Mater., 2010, 22, 2107–2113 CrossRef CAS.
- K.-H. Lee, J.-H. Lee, W.-S. Song, H. Ko, C. Lee, J.-H. Lee and H. Yang, ACS Nano, 2013, 7, 7295–7302 CrossRef CAS PubMed.
- P. Samokhvalov, M. Artemyev and I. Nabiev, Chem. – Eur. J., 2013, 19, 1534–1546 CrossRef CAS PubMed.
- S. Cao, C. Li, L. Wang, M. Shang, G. Wei, J. Zheng and W. Yang, Sci. Rep., 2014, 4, 7510 CrossRef PubMed.
- S. Cao, J. Zheng, J. Zhao, L. Wang, F. Gao, G. Wei, R. Zeng, L. Tian and W. Yang, J. Phys. Chem. C, 2013, 1, 2540–2547 CAS.
- K. Jong-Uk, L. Myung-Hyun and Y. Heesun, Nanotechnology, 2008, 19, 465605 CrossRef PubMed.
- C. S. Erickson, L. R. Bradshaw, S. McDowall, J. D. Gilbertson, D. R. Gamelin and D. L. Patrick, ACS Nano, 2014, 8, 3461–3467 CrossRef CAS PubMed.
- F. Meinardi, A. Colombo, K. A. Velizhanin, R. Simonutti, M. Lorenzon, L. Beverina, R. Viswanatha, V. I. Klimov and S. Brovelli, Nat. Photonics, 2014, 8, 392–399 CrossRef CAS.
- Z.-Q. Chen, C. Lian, D. Zhou, Y. Xiang, M. Wang, M. Ke, L.-B. Liang and X.-F. Yu, Chem. Phys. Lett., 2010, 488, 73–76 CrossRef CAS.
- M. Luo, G. K. Olivier and J. Frechette, Soft Matter, 2012, 8, 11923–11932 RSC.
- D. Xu, Z. Liu, J. Liang and Y. Qian, J. Phys. Chem. B, 2005, 109, 14344–14349 CrossRef CAS PubMed.
- J. Yang, T. Ling, W.-T. Wu, H. Liu, M.-R. Gao, C. Ling, L. Li and X.-W. Du, Nat. Commun., 2013, 4, 1695 CrossRef PubMed.
- Y. Vahidshad, M. Nawaz Tahir, A. Iraji Zad, S. M. Mirkazemi, R. Ghasemzadeh, H. Huesmann and W. Tremel, J. Phys. Chem. C, 2014, 118, 24670–24679 CAS.
- A. Hazarika, A. Layek, S. De, A. Nag, S. Debnath, P. Mahadevan, A. Chowdhury and D. D. Sarma, Phys. Rev. Lett., 2013, 110, 267401 CrossRef PubMed.
- Y. Chen, X. Zhang, C. Jia, Y. Su and Q. Li, J. Phys. Chem. C, 2009, 113, 2263–2266 CAS.
- G. Blasse and B. C. Grabmaier, Luminescent Materials, Springer Berlin Heidelberg, 1994, ch. 3, pp. 33–70 DOI:10.1007/978-3-642-79017-1_3.
- W. Xu, X. Meng, W. Ji, P. Jing, J. Zheng, X. Liu, J. Zhao and H. Li, Chem. Phys. Lett., 2012, 532, 72–76 CrossRef CAS.
- B. Rémi, T. O. Stefan and R. G. Daniel, Nanocrystal Quantum Dots, CRC Press, 2010, 2nd edn, pp. 397–453 DOI:10.1201/9781420079272-c11.
- J. Ouyang, C. I. Ratcliffe, D. Kingston, B. Wilkinson, J. Kuijper, X. Wu, J. A. Ripmeester and K. Yu, J. Phys. Chem. C, 2008, 112, 4908–4919 CAS.
- K. Kole, C. S. Tiwary and P. Kumbhakar, J. Appl. Phys., 2013, 113, 114308 CrossRef.
- D. V. Talapin, R. Koeppe, S. Götzinger, A. Kornowski, J. M. Lupton, A. L. Rogach, O. Benson, J. Feldmann and H. Weller, Nano Lett., 2003, 3, 1677–1681 CrossRef CAS.
- W. Zhang, G. Chen, J. Wang, B.-C. Ye and X. Zhong, Inorg. Chem., 2009, 48, 9723–9731 CrossRef CAS PubMed.
- W. Zhang and X. Zhong, Inorg. Chem., 2011, 50, 4065–4072 CrossRef CAS PubMed.
- R. Xie, M. Rutherford and X. Peng, J. Am. Chem. Soc., 2009, 131, 5691–5697 CrossRef CAS PubMed.
- L. Li, T. J. Daou, I. Texier, T. T. Kim Chi, N. Q. Liem and P. Reiss, Chem. Mater., 2009, 21 CAS.
- F. Zheng, W. Ping, Z. Xinhua and Y. Yong-Ji, Nanotechnology, 2010, 21, 305604 CrossRef PubMed.
- I. Coropceanu and M. G. Bawendi, Nano Lett., 2014, 14, 4097–4101 CrossRef CAS PubMed.
- B. O. Dabbousi, J. Rodriguez-Viejo, F. V. Mikulec, J. R. Heine, H. Mattoussi, R. Ober, K. F. Jensen and M. G. Bawendi, J. Phys. Chem. B, 1997, 101, 9463–9475 CrossRef CAS.
- C. P. Thomas, A. B. Wedding and S. O. Martin, Sol. Energy Mater. Sol. Cells, 2012, 98, 455–464 CrossRef CAS.
- S. Kalytchuk, S. Gupta, O. Zhovtiuk, A. Vaneski, S. V. Kershaw, H. Fu, Z. Fan, E. C. H. Kwok, C.-F. Wang, W. Y. Teoh and A. L. Rogach, J. Phys. Chem. C, 2014, 118, 16393–16400 CAS.
- J.-Y. Jung, K. Zhou, J. H. Bang and J.-H. Lee, J. Phys. Chem. C, 2012, 116, 12409–12414 CAS.
- S.-W. Baek, J.-H. Shim, H.-M. Seung, G.-S. Lee, J.-P. Hong, K.-S. Lee and J.-G. Park, Nanoscale, 2014, 6, 12524–12531 RSC.
- S.-W. Baek, J.-H. Shim and J.-G. Park, Phys. Chem. Chem. Phys., 2014, 16, 18205–18210 RSC.
- S. Singhal, A. K. Chawla, H. O. Gupta and R. Chandra, Thin Solid Films, 2009, 518, 1402–1406 CrossRef CAS.
- C. K. Huang, Y. C. Chen, W. B. Hung, T. M. Chen, K. W. Sun and W. L. Chang, Prog. Photovoltaics, 2013, 21, 1507–1513 CAS.
- C. Würth, J. Pauli, C. Lochmann, M. Spieles and U. Resch-Genger, Anal. Chem., 2012, 84, 1345–1352 CrossRef PubMed.
- C. Würth, M. Grabolle, J. Pauli, M. Spieles and U. Resch-Genger, Nat. Protoc., 2013, 8, 1535–1550 CrossRef PubMed.
- W. S. Yang, J. H. Noh, N. J. Jeon, Y. C. Kim, S. Ryu, J. Seo and S. I. Seok, Science, 2015, 348, 1234–1237 CrossRef CAS PubMed.
- M. Tsuji, D. Yamaguchi, M. Matsunaga and M. J. Alam, Cryst. Growth Des., 2010, 10, 5129–5135 CAS.
- X. Li, D. Shen, J. Yang, C. Yao, R. Che, F. Zhang and D. Zhao, Chem. Mater., 2013, 25, 106–112 CrossRef CAS.
- X. Zhong, M. Han, Z. Dong, T. J. White and W. Knoll, J. Am. Chem. Soc., 2003, 125, 8589–8594 CrossRef CAS PubMed.
Footnote |
| † Electronic supplementary information (ESI) available: Energy-dispersive X-ray spectroscopy (EDX) data, measurements of EQE data and J–V curves, cost effective calculations etc. See DOI: 10.1039/c5ee03165f |
| This journal is © The Royal Society of Chemistry 2016 |