
 Open Access Article
 This Open Access Article is licensed under a
 Creative Commons Attribution 3.0 Unported Licence
The temperature dependence of the Hofmeister series: thermodynamic fingerprints of cosolute–protein interactions†
Michael
Senske
a,
Diana
Constantinescu-Aruxandei‡
b,
Martina
Havenith
a,
Christian
Herrmann
*b,
Hermann
Weingärtner
a and
Simon
Ebbinghaus
*a
aDepartment of Physical Chemistry II, Ruhr-Universität Bochum, 44780 Bochum, Germany. E-mail: Simon.Ebbinghaus@rub.de
bDepartment of Physical Chemistry I, Ruhr-Universität Bochum, 44780 Bochum, Germany. E-mail: Chr.Herrmann@rub.de
First published on 22nd August 2016
Abstract
The Hofmeister series is a universal homologous series to rank ion-specific effects on biomolecular properties such as protein stability or aggregation propensity. Although this ranking is widely used, outliers and exceptions are discussed controversially and a molecular level understanding is still lacking. Studying the thermal unfolding equilibrium of RNase A, we here show that this ambiguity arises from the oversimplified approach to determine the ion rankings. Instead of measuring salt effects on a single point of the protein folding stability curve (e.g. the melting point Tm), we here consider the salt induced shifts of the entire protein ‘stability curve’ (the temperature dependence of the unfolding free energy change, ΔGu(T)). We found multiple intersections of these curves, pinpointing a widely ignored fact: the Hofmeister cation and anion rankings are temperature dependent. We further developed a novel classification scheme of cosolute effects based on their thermodynamic fingerprints, reaching beyond salt effects to non-electrolytes.
Introduction
The native conformation of a protein is only marginally stable.1 The low stability is expressed by the low Gibbs free energy of unfolding, ΔGu = ΔHu − TΔSu, which can be dissected into its enthalpic and entropic contributions, ΔHu, and TΔSu, respectively. ΔGu, forms the thermodynamic driving force of the transition from the native to the unfolded state and has to be positive for a stable conformation. The low ΔGu is founded in the mutual compensation of large enthalpic and entropic contributions, known as “enthalpy–entropy compensation”,2 which can be manipulated by adding cosolutes.The characterization of these cosolute effects is crucial to understand the role of species in the inner of the cell, which is densely crowded with (bio)-macromolecules up to 300 mg mL−1.3 In general, cosolutes which are preferentially excluded from the protein surface favor the folded state because of its smaller solvent exposed surface. Cosolutes which preferentially bind to protein surfaces shift the equilibrium to the unfolded state. Macromolecular crowders, such as polyethylene glycol or dextran, are thought to be excluded cosolutes. Proposed mechanisms range from entropic excluded volume effects4,5 to enthalpic effects similar to osmolytes.6,7 Osmolytes including polyols, sugars and amines stabilize proteins and protect the cellular proteome from environmental stresses.8 They are excluded from protein surfaces and act mainly via an enthalpic stabilization mechanism.5,7,9 On the other hand, chemical denaturants, such as guanidinium salts and urea, destabilize proteins by direct interactions which reduce ΔHu.7,10–12
Since Hofmeister's observation13 that salts precipitate hen egg-white proteins in a highly ion-specific manner, salt effects on proteins have received particular attention.14–18 The resulting anion and cation rankings, known as “Hofmeister series”, are encountered in many fields of chemistry and biochemistry such as surface tension and potential,19,20 orientational ordering of thermotropic liquid crystals at aqueous interfaces,21 protein crystallization,22 protein aggregation,23 and enzymatic activity.24,25 Anion and cation rankings for the effect of salts on protein stability are typically based on the propensity to stabilize/destabilize native proteins, using the “melting temperature”, Tm, of the protein as a criterion.14,26,27Tm is defined as the midpoint of the unfolding transition, where ΔGu = 0. There are, however, striking exceptions from Hofmeister behavior, such as an inverse anion series observed for hen egg-white lysozyme at low pH22,23,28 and some ions that are difficult to integrate into the Hofmeister scheme.14,15 Moreover, the ion-specificity is concentration dependent: while electrostatic effects are expected to be most significant at low concentrations,27,29,30 ion-specific effects were observed both at low and high concentrations.31,32
Instead of focusing on the single state, where ΔGu = 0, the understanding of ion-specific effects is largely increased by determining ΔGu over a wide range of temperatures, obtaining the so-called “stability curve” ΔGu(T) of the protein. Standard thermodynamic procedures allow to dissect ΔGu(T) into its enthalpic and entropic parts, ΔHu(T) and TΔSu(T).33 Cosolute-induced changes relative to the cosolute-free, buffered solution are then quantified by the excess functions:
| ΔΔGu = ΔGu,cosolute − ΔGu,buffer = ΔΔHu − TΔΔSu | (1) |
Specifically, we explore here effects of salts and of some nonelectrolytes on the unfolding thermodynamics of ribonuclease A (RNase A, 124 residues, 13.7 kDa). The ionic cosolutes range from simple alkali halides to complex low-melting organic salts (“ionic liquids”), which enable the systematic variation of the cosolute properties of the ions34 and possess a high potential for steering biomolecular processes.35,36 We have recently explored the impact of ionic liquids on unfolding of RNase A,37,38 and their propensity to steer protein aggregation.39 Since many questions applying to salt effects also concern neutral cosolutes, one gets insight into these mechanism by comparative studies, here especially for alcohols and osmolytic polyols.
Materials and methods
Bovine pancreatic RNase A (type III-A) and the various cosolutes were obtained from different companies (see Table S1, ESI†). Stock solutions of RNase A in 50 mM citrate buffer at pH 5.0 were mixed with solutions containing the cosolute to obtain a protein concentration of 0.5 mg mL−1, which was controlled by UV-VIS spectroscopy at 280 nm, using a NanoDrop 2000 c spectrometer (Thermo Scientific, Waltham, USA). The unfolding transition was characterized by recording DSC thermograms at a rate of 90 K h−1 by a VP-DSC instrument (MicroCal, Northampton, USA) and a Capillary-DSC apparatus (Malvern, Herrenberg, Germany). Our analysis also includes DSC thermograms of RNase A (5.0 mg mL−1) in 10 mM phosphate buffer at pH 5.5 in the presence of ionic liquids,37 which were recorded at a scan rate of 60 K h−1 (Table S1, ESI†). Complex cations used include tetramethylammonium ([Me4N+]), tetrabutylammonium ([Bu4N]+), 1-ethyl-3-methylimidazolium ([emim]+), 1-butyl-3-methylimidazolium ([bmim]+), 1-hexyl-3-methylimidazolium ([hmim]+), N-butylmethylpyrrolidinium ([bmpyrr]+), choline ([chol]+). Anions include dicyanamide ([dca]−), ethylsulfate ([EtSO4]−), dihydrogen phosphate ([dhp]−).At pH ∼ 5.0 RNase A (pI = 9.6) forms monomers with a charge of about +7,39 which undergo a reversible two-state process, characterized by the equilibrium constant
 | (2) |
The experimental observable is the partial heat capacity Cexpp,pr of the protein obtained from the DSC thermogram after correction for the solvent contribution (see ESI,† S.1). Fits to the two-state model yielded Tm, ΔHu(Tm), ΔSu(Tm) = ΔHu(Tm)/Tm, and the heat capacity change at Tm, ΔCp(Tm). For most measurements (Table S1, ESI†) the caloric enthalpy ΔHu,cal agreed with the van't Hoff enthalpy ΔHu,vH calculated from the temperature dependence of ΔGu to within 5% or better, as required for a two-state model.33 Three repeated measurements in buffer were used to estimate the systematic error of all scans (Table S1, ESI†).
The temperature dependence of ΔGu, ΔHu and ΔSu is given by Kirchhoff's laws (eqn (3)–(5)). In agreement with previous findings7 the cosolutes did not significantly influence ΔCp(Tm) (see Table S2 and ESI,† S.2), which allows to approximate ΔCp(T) by the result obtained for the buffer solution.40 Excess functions ΔΔGu, ΔΔHu and TΔΔSu (ΔΔX = Xcosolute − Xbuffer) relative to buffer scans at equal condition were then calculated at Tm,buffer using eqn (3)–(5) and the temperature dependence of ΔCp (see ESI,† S.1). Different choices of buffer and variation of the pH in the range from 5 to 5.5 had only a small effect on Tm and ΔHu which canceled in the excess functions ΔΔGu, ΔΔHu and TΔΔSu and in ΔTm.
 | (3) |
 | (4) |
 | (5) |
Results
Salt-induced changes of Tm
In Fig. 1 we illustrate the primary experimental data by baseline-corrected heat capacity scans of RNase A in 50 mM citrate buffer in the presence of stabilizing K[dhp] and destabilizing Na[ClO4], respectively. Based on such data, Fig. 2 gives an overview on salt effects on Tm of RNase A by plotting the cosolute-induced shift ΔTm = Tm,cosolute − Tm,buffer of the melting temperature versus the salt concentration. Charged proteins undergo electrostatic interactions with ions at very low concentrations, which result in protein destabilization at 0.25 and 0.5 M by almost all salts. However, our data for K[dhp] and [chol][dhp] (increase of ΔTm in the entire measured concentration range, Fig. 2f) indicate that ion-specific effects can also be dominant at these concentrations. At high salt concentrations (≥1 M) electrostatic forces are screened and ion-specific effects become dominant. In the case of stabilizing salts one therefore expects a minimum of the concentration dependence of Tm, while destabilizing salts act in the same direction as the electrostatic effects and depress Tm. | ||
| Fig. 1 Effect of NaClO4 and K[dhp] on the excess heat capacities of RNase A in 50 mM citrate buffer at pH 5.0. The data points are joined to guide the eye. From the left to the right the salt concentrations are 2 M, 1 M, 0.5 M, 0.25 M (NaClO4) and 0.25 M, 0.5 M (K[dhp]). | ||
 | ||
| Fig. 2 Salt-induced shifts of Tm of RNase A. (a and b) chlorides; (c) bromides; (d) sodium salts; (e) salts with [emim]+ as cation; (f) salts with stabilizing oxo-anions. Error bars were calculated by Gaussian error propagation of the primary error estimates (see ESI,† S.1) and are smaller than the point size. Data points for K2SO4, and [gdm]Cl were taken from Ravindra and Winter.41 | ||
Shallow minima of Tm near 0.5 M (e.g. ΔTm ≅ −2 K for 0.5 M NaCl) were indeed observed for stabilizing alkali metal chlorides, [Me4N]Cl and [chol]Cl (Fig. 2a). For salts with oxo-anions, such as K2[SO4], K[dhp] and [chol][dhp] (Fig. 2f), the stabilizing ion-specific effects are too strong to trace these minima. For LiCl (Fig. 2b) and NaBr (Fig. 2d) Tm decreases, but an inflection point of the concentration dependence is still reminiscent of the minima in Fig. 2a. For stronger destabilizing agents, such as Na[ClO4], Tm decreases monotonously. Most ionic liquids destabilize proteins as well. As the alkyl chains of the cation increase in length, the destabilizing power of ionic liquids increases rapidly and leads to a largely negative ΔTm (Fig. 2c). However, strong destabilization can also be enforced by anions, such as [dca]− and [SCN]− (Fig. 2e).
Cosolute-induced changes of ΔGu
The proper thermodynamic driving force of the unfolding transition is the excess free energy ΔΔGu. Fig. 3 shows ΔΔGu for some alkali metal salts and ionic liquids at the temperature Tm,buffer as a function of salt concentration. In dilute solutions (<0.25 M) electrostatic interactions result in ΔΔGu < 0, while at higher salt concentrations stabilizing ion-specific effects (ΔΔGu > 0) or destabilizing effects (ΔΔGu < 0) become dominant, in parallel to the behavior of ΔTm displayed in Fig. 2. Considering this parallelism in more detail, we find an apparent linear relationship between ΔΔGu and ΔTm (even though it is a nonlinear relation). For details we refer to Fig. S1 (ESI†). | ||
| Fig. 3 ΔΔGu calculated at Tm in cosolute-free solution, Tm,buffer, as a function of salt concentration. Error bars were calculated by Gaussian error propagation of the primary error estimates (see ESI,† S.1). | ||
Cosolute-induced changes of ΔHu and ΔSu
Fig. 4 illustrates the dissection of ΔΔGu into its enthalpic and entropic parts, ΔΔHu and TΔΔSu, by showing representative results for the various salt families. The excess functions ΔΔHu and TΔΔSu behave highly salt-specific. For NaCl ΔΔHu and TΔΔSu decrease monotonously with increasing salt concentration and are strongly coupled. In the case of [chol][dhp] both, ΔΔHu and TΔΔSu initially increase and pass maxima. Their behavior parallels one another, but ΔΔHu becomes considerably larger than TΔΔSu, leading to high values of ΔΔGu. For destabilizing Na[ClO4] the behavior is inverse. The curves initially decrease and pass minima at a concentration near 1 M. Both, ΔΔHu and TΔΔSu, retain the same shape, but TΔΔSu increases more strongly than ΔΔHu and eventually becomes positive, rendering ΔΔGu strongly negative. Finally, for more hydrophobic salts, here exemplified by [bmim]Br, both ΔΔHu and TΔΔSu increase with concentration, but TΔΔSu strongly dominates over ΔΔHu. | ||
| Fig. 4 Concentration dependence of ΔΔHu (data points connected by solid lines) and TΔΔSu (data points connected by dashed lines). Error bars were calculated by Gaussian error propagation of the primary error estimates (see ESI,† S.1). Note, ΔΔHu and TΔΔSu are coupled (ΔSu(Tm) = ΔHu(Tm)/(Tm)). Therefore, the error of the relative position of ΔΔHu and TΔΔSu with respect to each other is much smaller and is given by the errors of ΔΔGu in Fig. 3. | ||
Further insight into these issues is gained by an entropy–enthalpy compensation plot of TΔΔSuversus ΔΔHu shown in Fig. 5. This diagram characterizes the mutual compensation of large enthalpic and entropic contributions, which tend to cancel in ΔGu. Different signs of the excess functions ΔΔGu, ΔΔHu and TΔΔSu, define eight different fields in this plot which are marked by different colors. The blue diagonal corresponds to full enthalpy–entropy compensation and separates the protein destabilizing region (ΔΔGu < 0) from the stabilizing region (ΔΔGu > 0). Positive (negative) values of ΔΔHu imply stabilization (destabilization) by the cosolute. The entropy term acts in the opposite direction: a positive TΔΔSu supports destabilization.
 | ||
| Fig. 5 (a–d) Enthalpy–entropy compensation plots. The different segments correspond to different contributions of ΔΔGu, ΔΔHu, and TΔΔSu. The blue diagonal corresponds to a complete enthalpy–entropy compensation. Data points correspond to different concentrations of the respective cosolute. (a, c and d) The first or the first two data points (≤0.5 M) of some compounds are omitted for clarity. Error bars are coupled and omitted for clarity (see caption of Fig. 4). Data of [gdm]Cl, urea, K2SO4, and sorbitol are taken from Ravindra and Winter.41 | ||
The sections I (magenta), and II (blue) and the sections V (yellow) and VI (orange) are most populated due to largely compensating enthalpic and entropic contributions. All hydrophobic ionic liquids (here the cations with butyl side chain or longer) fall into the magenta segment I, where ΔΔHu is positive, but TΔΔSu, is even more positive, leading to entropic destabilization offset by enthalpic stabilization. Hydrophilic salts (e.g. alkali halides) populate states near the borderline between sections V (yellow) and VI (orange), where both, the enthalpic as well as the entropic contribution are negative. Depending on the magnitudes of TΔΔSu and ΔΔHu, one obtains stabilizing salts (ΔΔGu > 0 in section V) or destabilizing salts (ΔΔGu < 0 in section VI). The chemical denaturants [gdm]Cl and urea also fall in section VI. Some chlorides intersect the borderline from destabilizing to stabilizing behavior at high concentrations (see also Fig. 2 and 3).
As already observed in Fig. 2, strongly stabilizing salts based on oxo-anions, such as [dhp]−, reveal unique behavior. We have recently introduced [chol][dhp] as a highly soluble (biocompatible) substitute for K[dhp].35,39 In Fig. 5 [chol][dhp] reveals a strongly non-monotonous behavior with a sharp transition from predominant enthalpic to entropic stabilization near 0.5 M (similar to K[dhp] at 0.25 M), which is associated with a maximum of ΔΔHu and TΔΔSu. Two data points for K2SO4 at 0.25 and 0.5 M reported by Ravindra and Winter41 are also consistent with a very strong entropic stabilization. Na[ClO4] shows a non-monotonous behavior as well, but is strongly destabilizing and covers the segments VI and VII.
In principle, ΔΔHu and ΔΔSu (here calculated at Tm,buffer) are temperature dependent, but the assumption ΔCp,cosolute(T) = ΔCp,buffer(T) used in our modellings renders ΔΔHu temperature independent and simplifies the expression for ΔΔSu to ΔΔSu = TΔCp![[thin space (1/6-em)]](https://www.rsc.org/images/entities/char_2009.gif) ln(Ts,buffer/Ts,cosolute), where Ts is the temperature of maximum stability, ΔGu,max. Thus, ΔΔHu does not change with temperature and ΔΔSu does not change its sign.
ln(Ts,buffer/Ts,cosolute), where Ts is the temperature of maximum stability, ΔGu,max. Thus, ΔΔHu does not change with temperature and ΔΔSu does not change its sign.
Temperature dependence of ΔGu
Because conformational stability requires ΔGu > 0, the temperature dependence of the stability curve ΔGu(T) represents a highly useful measure of the conformational stability. Fig. 6 pinpoints the basic features of ΔGu(T) and shows some typical examples for its response to added salts and neutral cosolutes. In general, ΔGu(T) resembles a parabola and intersects the zero line at high and low temperatures, defining Tm and the cold denaturation temperature Tc, respectively. For RNase A at pH 5–5.5 we extrapolate Tc to be <200 K. Like for most other proteins,42Tc falls largely below the liquid range of the solution. Between Tc and Tm the stability curve passes a maximum, which gives access to Ts and ΔGu,max. | ||
| Fig. 6 Stability curves of RNase A in the presence of representative cosolutes. (a) RNase A in 50 mM citrate buffer at pH 5.0. (b) RNase A in 10 mM phosphate buffer at pH 5.5. The differences of the buffer curves are due to the higher concentration of the citrate buffer and a higher protein stabilizing propensity of the citrate compared to the phosphate ion.14 | ||
We have previously shown that the temperature dependence of ΔCp is crucial when calculating ΔΔHu and TΔΔSuviaeqn (3)–(5).7 By contrast, the temperature dependence of ΔGu can be reliably estimated using a constant value for ΔCp (see Fig. S2, ESI†), which enables an estimate of ΔGu at temperatures at which measurement of ΔCp(T) are infeasible. Here we used ΔCp = 5.0 kJ K−1 mol−1, resembling ΔCp of RNase A around room temperature.40 If the cosolute does not alter ΔCp(T), ΔΔGu(T) deduced from the stability curve reflects the correct temperature dependence, and the shape of the stability curve is not affected by the cosolute (∂2ΔGu(T)/∂T2 = − ΔCp/T). The discussion of cosolute-induced changes of ΔGu(T) can therefore be reduced to the vertical and horizontal changes of the maximum protein stability, ΔGu(Ts) (Fig. 7 and 8).
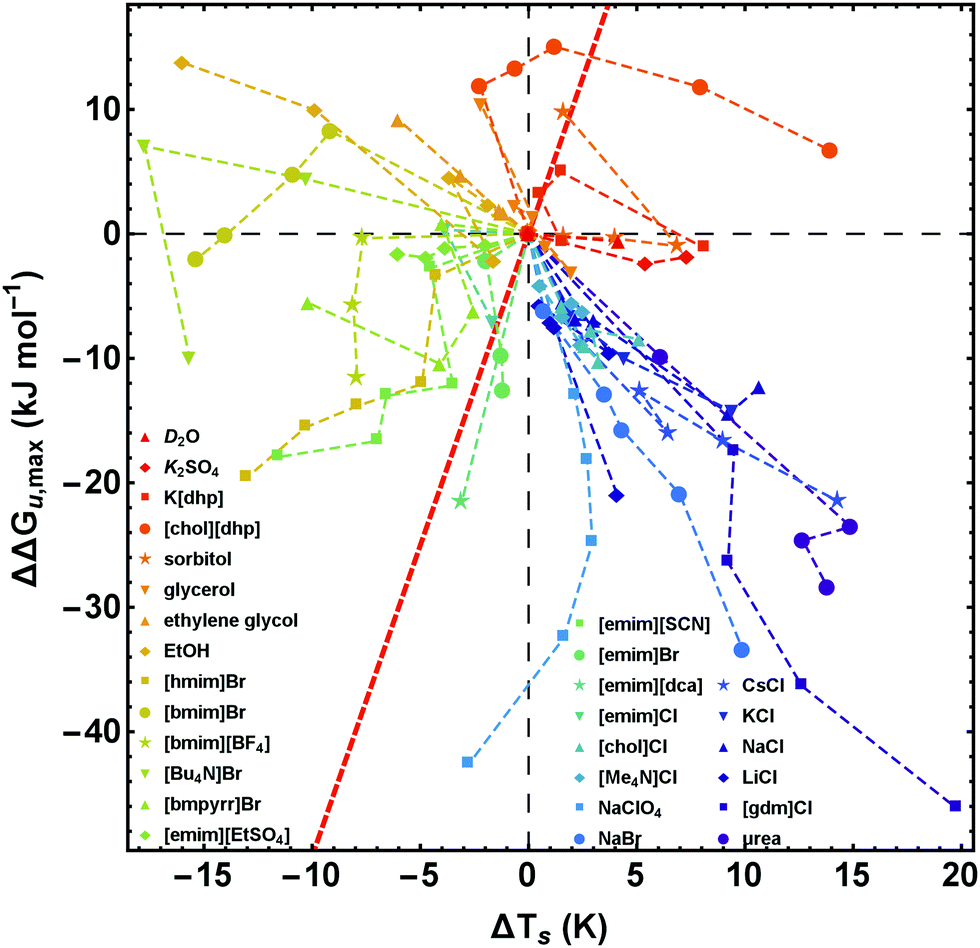 | ||
| Fig. 7 Salt-induced changes of the maximum of the stability curve. ΔΔGu,max corresponds to the vertical shift and ΔTs to the horizontal shift of the maximum position. To retain simplicity, salt concentrations are not given in the figure, but the sequence of concentrations is the same as in Fig. 2. While the red line (ΔΔGu,max(ΔTs) = ΔCp × ΔTs) represents a pure entropic effect, the y-axis corresponds to a pure enthalpic effect. Error bars are omitted for clarity, but are given in Fig. 8 for a representative data point of each curve. Data of [gdm]Cl, urea, K2SO4, and sorbitol are taken from Ravindra and Winter.41 | ||
 | ||
| Fig. 8 Salt-induced changes of the maximum of the stability curve. If not stated otherwise, the concentration of the cosolutes is 1 M. The gradient of the background from blue to red color scales with increasing/decreasing hydrophilicity/hydrophobicity. While the red line (ΔΔGu,max(ΔTs) = ΔCp × ΔTs) represents a pure entropic effect, the y-axis corresponds to a pure enthalpic effect. Error bars were calculated by Gaussian error propagation of the primary error estimates (see ESI† for details). Data of [gdm]Cl, urea, K2SO4, and sorbitol are taken from Ravindra and Winter.41 | ||
Maximum protein stability
In Fig. 7 and 8 we plot the vertical change of ΔGu(Ts), ΔΔGu,max, versus the horizontal change, ΔTs, for all cosolutes. At the maximum of the stability curve ∂ΔGu(T)/∂T is zero. Since ∂ΔGu(T)/∂T = −ΔSu the maximum stabilization of a protein is purely enthalpic. Therefore, a vertical shift of the stability curve along the y-axis signals a purely enthalpic process (ΔΔSu = 0), while a horizontal shift usually affects both, enthalpy and entropy. The red dashed line in Fig. 7 and 8 corresponds to the special case of a purely entropic effect (i.e. ΔΔHu = 0).There is a bundle of curves for alkali metal halides, which reduce ΔGu,max, but increase Ts, thus falling into the lower right quarter of Fig. 7, where the cosolute mechanisms are characterized by enthalpic destabilization and entropic stabilization. In this regime, we also find the widely used denaturants urea and [gdm]Cl. While urea and [gdm]Cl are on the right hand side of the curves in the lower right quarter, the strong denaturant Na[ClO4] is found on the left hand side close to purely enthalpic behavior. Another bundle of curves is associated with hydrophobic behavior of ionic liquids, which fall into the lower to the upper left quarter of Fig. 7. The two ionic liquids [bmim]Br and [Bu4N]Br cross the abscissa corresponding to stability curves, where the maximum free energy is larger than that of the buffer solution. The latter regime is also populated by the neutral cosolutes ethanol and ethylene glycol, which are more hydrophobic than the larger polyols considered.
Summarizing these results, Fig. 8 compares the impact of all cosolutes considered in our study on ΔGu,max at typical concentrations of 1–2 M. The major difference between hydrophilic salts (red symbols) and hydrophobic salts (blue symbols) is founded in a transition from entropic stabilization (ΔTs > 0) to entropic destabilization (ΔTs < 0). The same is true for the neutral cosolutes, where glycerol marks the borderline between entropic stabilization and destabilization. Although we are not aware of cosolutes that exhibit a purely enthalpic or purely entropic mechanism, there is a band of salts of low hydrophobicity which are close to these limits (light blue symbols and Na[ClO4]). In the latter cases destabilization seems substantially affected by the anion (e.g. [SCN]−, [dca]−, [ClO4]−).
Discussion
Thermodynamic fingerprints
In general, the cosolute effect of salts on protein stability depends on the charge of the protein and is determined mainly by two effects. Electrostatic (coulombic) effects dominate at low concentrations and ion-specific (Hofmeister) effects at high concentrations.27,29,30 Since the cosolutes effect of inorganic salts is largely influenced by specific salt–protein interactions the thermodynamic fingerprints of proteins in the presence of inorganic salts can be different. For positively charged RNase A in the presence of alkali halides we find enthalpic destabilization and entropic stabilization. The positively charged peptide met16 shows the same behavior of ΔΔGu, but thermodynamics reveals a different mechanism: the peptide is stabilized enthalpically, but destabilized entropically.30 Yet another type of behavior is exhibited by positively charged ubiquitin. In the latter case the protein is stabilized via an enthalpic mechanism even at low concentrations of alkali and alkaline earth halides, at which electrostatic effects should prevail.7,43While for positively charged RNase A in this study, anionic effects prevail over cationic effects, for negatively charged RNase T1 the salt effect seems to result mainly from the interaction with the cations.44 However, anions can strongly affect negatively charged proteins, specifically in the case of an extended positively charged amino acid cluster31 or the existence of specific anion binding sites.45 For in sum uncharged proteins, the overall salt effect seems to be weakened.7
For simple inorganic salts the variation of the cation has only a small effect on the stability of positively charged RNase A. On the other hand, cation variation of ionic liquids can lead to very strong effects (Fig. 2) because the thermodynamic mechanism depends on the hydrophobicity of the cation (Fig. 5a, 7 and 8). The longer the hydrophobic side chain of the cation, the stronger the destabilization at the high temperature end of the stability curve. These findings are not limited to RNase A. Actually, it seems that ionic liquids, at least the so-called aprotic ones,34 destabilize proteins at the high temperature end of the stability curve.46–48 The recently reported stabilization of α-chymotrypsin by benzyl-methyl-imidazolium chloride49 does not contradict this observation: although the overall effect on ΔΔGu is stabilizing, α-chymotrypsin shows the typical thermodynamic fingerprint exhibited by RNase A and BSA47 in the presence of ionic liquids: the enthalpic contribution is stabilizing, the entropic contribution is destabilizing.
 | ||
| Fig. 9 Stability curves, ΔGu(T), of RNase A in buffered solutions of 4 M NaCl, CsCl, and [Me4N]Cl illustrating the temperature dependence of the Hofmeister series. | ||
It is interesting to compare these findings with data for some OH-bonded neutral cosolutes. Osmolytes like sorbitol or glycerol are known to increase Tm. According to the current opinion they stabilize proteins via an enthalpic mechanism.5,7 For RNase A several studies report, however, a stabilization via an entropic pathway.50–52 Our data for salts help to rationalize this discrepancy by comparing the enthalpy–entropy compensation of homologous alcohols and three polyols which differ in the number of OH-groups. We find that the nonelectrolytes reveal the same correlation between the hydrophobicity of the cosolute and the cosolute effects as observed for ionic liquids: the more hydrophobic the cosolute (e.g. ethanol) the stronger the reduction of Tm (Fig. S3, ESI†). The same trend holds for the enthalpy and entropy contributions: the more hydrophobic the cosolute, the larger the destabilizing entropic and the stabilizing enthalpic contribution (Fig. 5d). While ethanol induces an entropic destabilization which is counteracted by an enthalpic stabilization, sorbitol stabilizes RNase A entropically and the enthalpic contribution is even destabilizing. For alcohols as cosolutes a positive ΔΔHu and ΔΔSu seems to be a general phenomenon.53–56
Our analysis also implies that the cosolute effects of ethanol and typical excluded osmolytes are not as different as it might appear at a first glance from the reduction of Tm. Ethanol shifts the stability curve upwards (Fig. 6a), which is typical for excluded cosolutes,57,58 As shown in Fig. 8, the hydrophobicity/hydrophilicity determines the horizontal position of the maximum (Ts). The more hydrophobic the cosolute, the larger the shift of Ts to lower temperatures, resulting in the discussed enthalpy–entropy compensation. While for RNase A in 4 M ethanol ΔTs = −16 K, the addition of 2.5 M sorbitol shifts Ts even to higher temperatures compared to the buffer solution (ΔTs = 6.9 K). Martin et al. have reported similar effects for yeast frataxin in alcohol solutions.55
In summary, combining the results for alkali halides, ionic liquids and alcohols/polyols, the stability curve of RNase A can be shifted in all possible directions scaling with the hydrophobicity of the cosolute (Fig. 7 and 8), which results in different thermodynamic fingerprints for these important classes of cosolutes. Thereby, the thermodynamic fingerprint of proteins in inorganic salt solution is a fingerprint of both, the protein and the salt, while the scaling of protein thermodynamics with hydrophobicity of the cosolutes is almost protein independent. Regarding protein stability, ionic liquids can be classified as a class of cosolutes in between inorganic salts and nonelectrolytes.
Generalized Hofmeister series
An intriguing question is, how our results affect the current picture of ion-specific (Hofmeister) effects. For this purpose we adopt the cation and anion series of Collins and Washabaugh14 as a reference, which are mainly based on data for salt effects on ΔTm by von Hippel and Schleich.26 This criterion reflects the correct thermodynamic driving force since, as shown above, ΔTm is correlated with ΔΔGu (Fig. S1, ESI†). If ΔΔGu is dissected into its enthalpic and entropic contributions, ΔΔHu, and TΔΔSu, the appealing simplicity and universality of the Hofmeister series immediately gets lost indicating heterologous molecular mechanisms.We now compare the ion rankings deduced from ΔTm, ΔΔGu, ΔΔHu, and TΔΔSu, respectively. Moreover, we expand this comparison to some complex ions, which are frequently used in the field of ionic liquids. As for most salts/ionic liquids the concentration dependence of ΔΔGu, ΔΔHu, and TΔΔSu is highly non-linear and often non-monotonous, we compare these properties at a given concentration of 1 M, which is high enough to ignore electrostatic contributions,30 but not yet affected by the limited solubilities exhibited by some salts and ionic liquids. Ranking the ions at the melting temperature of the salt-free protein from their stabilizing to destabilizing propensity, the formulation of Collins and Washabaugh14 predicts for the salts considered here the “direct” cation series: [Me4N]+, Cs+, K+, Na+, Li+, [gdm]+. There is, however, mounting evidence that at pH < pI, this sequence is reversed.16,22,23,28,59 This reversal is well established for anions, but work by Boström et al.28 and Schwierz et al.59 indicates a similar tendency for cations. In our study, where pH < pI, we find the following cation rankings at 1 M:
| ΔTm: | Na+, K+, Cs+ ≈ [Me4N]+, Li+, [gdm]+ | (Inverse) |
| ΔΔGu: | Na+, K+, Cs+ ≈ [Me4N]+, Li+, [gdm]+ | (Inverse) |
| ΔΔHu: | Li+ ≈ [Me4N]+, Na+, K+, Cs+, [gdm]+ | (Inverse) |
| TΔΔSu: | [gdm]+, Cs+, K+, Na+, [Me4N]+, Li+ | (Direct) |
Our results for ΔTm and ΔΔGu indeed reflect an inverse behavior, but Li+ and [gdm]+ are out of order. The motif NaCl > KCl > LiCl > [gdm]Cl exhibited by ΔTm and ΔΔGu has also been observed for a small model peptide by Sukenik et al.30 The ΔΔHu data yield an inverse series with [Me4N]+ and [gdm]+ out of order. By contrast, the results for TΔΔSu resemble the direct series with [Me4N]+ being out of order, thus essentially being opposite to those based on the ΔΔHu data.
It has been known before15 that [gdm]+ is difficult to incorporate into the Hofmeister scheme, and in some Hofmeister studies reviewed by Collins and Washabaugh,14 the positions of [Me4N]+ and Li+ seem anomalous as well. Based on our dissection of ΔΔGu into ΔΔHu and TΔΔSu, we can come up with an explanation for [Me4N]+ being out of order: the hydrophobic character of the four methyl groups causes an up- and left-shift of the stability curve of RNase A compared to its expected position from the Hofmeister ranking. As already suggested by Flores et al.60 and Schwierz et al.,61 the anomalous behavior of Li+ can be rationalized by the tight binding of water molecules in the first hydration shell to the Li+-ion which decreases the surface charge density. As a consequence, the ion appears to be more hydrophobic as suggested by the coincidence of the data points of LiCl and [Me4N]Cl in Fig. 8.
Turning to effects exerted by some complex anions, which are frequently used in the field of ionic liquids, the observed rankings are
| ΔTm: | [EtSO4]−, Br−, [dca]− ≈ [SCN]− | (Direct) |
| ΔΔGu: | [EtSO4]−, Br−, [dca]− ≈ [SCN]− | (Direct) |
| ΔΔHu: | [EtSO4]−, [SCN]−, [dca]− ≈ Br− | (Inconclusive) |
| TΔΔSu: | Br−, [dca]−, [EtSO4]−, [SCN]− | (Inconclusive) |
Noting the extremely denaturating role of [SCN]− based salts in the classical Hofmeister series,15 a strong similarity of solution properties of salts containing [dca]− and [SCN]− and a fairly hydrophilic nature of [EtSO4]−,34 the results for ΔTm and ΔΔGu may conform to an extension of the direct series, while the results for TΔΔSu and ΔΔHu are inconclusive and not in opposite direction. These observations are in line with previous bio-electrochemistry studies by Medda et al., who found that the apparent Hofmeister ranking gets lost upon dissection of the redox potential of cytochrome c into the enthalpic and entropic contributions.62
Temperature dependence of Hofmeister effects
Our results clearly show that for a proper understanding of Hofmeister behavior it is crucial to account for the temperature dependence of the cosolute effects. Translation of the different excess functions into stability curves (Fig. 6 and 9) reveals an important result which, according to our knowledge, has so far not been addressed in detail: the Hofmeister series is temperature dependent.Using as typical examples the stability curves of RNase A in the presence of NaCl, CsCl, and [Me4N]Cl, Fig. 9 illustrates how temperature influences the order of the Hofmeister series. Depending on the temperature (see the vertical lines at 285 K, 315 K, 342 K) different rankings of the cations Na+, Cs+, and [Me4N]+ are obtained. While [Me4N]+ is the least stabilizing cation at high temperatures, it is the most stabilizing cation at low temperatures. The order of Na+ and Cs+, which remains the same in the temperature range shown in Fig. 9, changes at high temperatures (around 395 K) as well. Similar temperature depending Hofmeister effects are obtained for the ionic liquids (Fig. 6b).
Ranking ions in a Hofmeister series therefore implies that the underlying cosolute-mechanisms reflect homologous effects. However, the salt-induced changes of the stability curves (Fig. 6–9) and of ΔΔHu and TΔΔSu (Fig. 4 and 5) show that this is not the case. Different kind of ions can induce qualitatively different shifts of the ΔGu(T)-curve, which – depending on the temperature – alter the sequence of salts in the Hofmeister series. These crossovers become more important the less the ions have in common (at least in the structural sense). Examples are [gdm]+ or [Me4N]+ within a cation series and complex molecular anions such as [SCN]− or [ClO4]− within the anion series. However, as discussed in the previous section, even a homologous series such as Li+, Na+, K+, and Cs+ has outliers (Li+) when the salt effect is dissected into its thermodynamic mechanisms. The temperature dependence of the Hofmeister series, so far not appreciated in the literature, may explain most outliers in the discussed literature. For example, the non-homologous effects of salt–protein interactions cause a loss of the Hofmeister series upon dissection of the redox potential of cytochrome c into the enthalpic and entropic contributions.62 We suggest that this is due to heterogeneous molecular mechanisms causing the intersections of the respective temperature dependent redox potentials.62
Towards a molecular mechanism
Strictly speaking, thermodynamics cannot provide a molecular mechanism of a reaction. However, comparisons of the thermodynamics of cosolute effects to well characterized cosolutes such as [gdm]Cl or urea could give microscopic insights, although one has to be careful: ΔΔHu and ΔΔSu include protein as well as solvent terms. Even though the enthalpic and entropic contributions of the solvent terms exactly cancel each other,63,64 they can be large in comparison to the protein terms and therefore significantly influence the temperature dependence of ΔGu.65 Thus, similar excess thermodynamic functions or similar shifts of the stability curve can have different molecular origins.5Today, it is widely accepted that the commonly used protein denaturants urea and [gdm]Cl denature proteins via direct chemical interactions.11,12 The thermodynamic fingerprint of all proteins in the presence of these chemical denaturants is a negative ΔΔHu and TΔΔSu.7,10,30 Based on the thermodynamic fingerprint, the destabilizing Hofmeister effect of NaBr and LiCl (Fig. 5, 7 and 8) could also be founded in chemical interactions of the ions with the protein.
In contrast, the ionic liquids are mainly located in field I of Fig. 5 indicating a different molecular mechanism compared to a typical protein denaturant. This is in accordance with the measurement of transfer free energies of amino acids showing that imidazolium-based ionic liquids interact unfavorably with the protein backbone similar to excluded cosolutes such as polyols and sugars, even so the interaction with the side chains of amino acids is favorable.66 The increasing trend of ΔΔHu and TΔΔSu with increasing hydrophobicity of the cation indicates a molecular mechanism which is directly related to the cosolute effect of alcohols on protein stability.
With increasing the hydrophobicity of the cosolutes, the destabilizing entropic contribution and the counteracting stabilizing enthalpic contribution increase. The effect of a hydrophobic cosolute on protein thermodynamics is thereby similar to the transfer thermodynamics of a hydrophobic cosolute into water in the observed temperature range.65 A decrease of entropy is a hallmark of the transfer of a hydrophobic cosolute from the gaseous state into water at temperatures below 100 °C. A reduced entropy of water in an aqueous solution of a hydrophobic cosolute could therefore diminish the reduction of the entropy of water upon unfolding of the protein due to the solvation of exposed hydrophobic residues, since the entropy of water is already reduced due to the presence of the hydrophobic cosolute (Fig. 10). This effect is consistent with a ΔΔSu > 0 and ΔΔHu > 0 as experimentally observed by us. A direct binding mechanism (as in the case of [gdm]Cl or urea) which could also explain the reduction of Tm in ethanol solutions is not likely because the direct interactions between protein and denaturant cause a downshift of the stability curve resulting in ΔGu,max,cosolute < ΔGu,max,buffer. In fact, the stability curve of RNase A in the presence of ethanol resembles a horizontally shifted stability curve of an excluded cosolute instead (Fig. 6a).
 | ||
| Fig. 10 Schematic representation of the hydrophobicity surface (blue: hydrophobic, red: hydrophilic) of a protein in dilute solution and in the presence of solvated [bmim]+. The scheme illustrates a possible molecular mechanism of a hydrophobic cosolute. The gradient of the background color from blue to red indicates the reduction of water entropy due to the hydration of the hydrophobic groups of [bmim]+. The reduced entropy diminishes the loss of entropy due to solvation of hydrophobic groups of the protein which get solvent exposed upon unfolding. This diminished loss of water entropy upon unfolding causes the experimentally observed ΔΔSu > 0. | ||
Conclusion
Here we present a novel thermodynamic analysis of cosolute effects on protein stability based on their different impact on the protein stability curve, ΔGu(T). As the shape of the curve remains the same for different cosolutes, we discussed the effects in terms of shifts of the maximum stability. Different classes of cosolutes shift the maximum differently based on their respective enthalpic (ΔΔHu) and entropic (TΔΔSu) contributions to the excess free energy (ΔΔGu): the more hydrophobic the cosolute, the larger the destabilizing entropic and the stabilizing enthalpic contributions. This classification is valid for both, neutral cosolutes as well as ions and leads to a new understanding of the Hofmeister series. Multiple intersections of the respective ΔGu(T) curves, determined by their thermodynamic fingerprints, manifest themselves in temperature dependent ion rankings. The present thermodynamic analysis is a fundamental framework for future molecular studies and simulations of cosolute effects.Acknowledgements
We thank Liel Sapir for helpful discussions. We acknowledge funding from the Cluster of Excellence RESOLV (EXC 1069) funded by the German Research Foundation (DFG). M. S. acknowledges financial support by the Fonds der Chemischen Industrie.References
- K. A. Dill, Biochemistry, 1990, 29, 7133–7155 CrossRef CAS PubMed.
- R. Lumry and S. Rajender, Biopolymers, 1970, 9, 1125–1227 CrossRef CAS PubMed.
- S. B. Zimmerman and S. O. Trach, J. Mol. Biol., 1991, 222, 599–620 CrossRef CAS PubMed.
- H. X. Zhou, G. Rivas and A. P. Minton, Annu. Rev. Biophys., 2008, 37, 375–397 CrossRef CAS PubMed.
- L. Sapir and D. Harries, J. Chem. Theory Comput., 2015, 11, 3478–3490 CrossRef CAS PubMed.
- L. A. Benton, A. E. Smith, G. B. Young and G. J. Pielak, Biochemistry, 2012, 51, 9773–9775 CrossRef CAS PubMed.
- M. Senske, L. Törk, B. Born, M. Havenith, C. Herrmann and S. Ebbinghaus, J. Am. Chem. Soc., 2014, 136, 9036–9041 CrossRef CAS PubMed.
- P. H. Yancey, M. E. Clark, S. C. Hand, R. D. Bowlus and G. N. Somero, Science, 1982, 217, 1214–1222 CAS.
- R. Gilman-Politi and D. Harries, J. Chem. Theory Comput., 2011, 7, 3816–3828 CrossRef CAS PubMed.
- G. I. Makhatadze and P. L. Privalov, J. Mol. Biol., 1992, 226, 491–505 CrossRef CAS PubMed.
- D. R. Canchi and A. E. Garcia, Annu. Rev. Phys. Chem., 2013, 64, 273–293 CrossRef CAS PubMed.
- B. Moeser and D. Horinek, J. Phys. Chem. B, 2014, 118, 107–114 CrossRef CAS PubMed.
- F. Hofmeister, Arch. Exp. Pathol. Pharmakol., 1888, 24, 247–260 Search PubMed.
- K. D. Collins and M. W. Washabaugh, Q. Rev. Biophys., 1985, 18, 323–422 CrossRef CAS PubMed.
- W. Kunz, Curr. Opin. Colloid Interface Sci., 2010, 15, 34–39 CrossRef CAS.
- P. Lo Nostro and B. W. Ninham, Chem. Rev., 2012, 112, 2286–2322 CrossRef CAS PubMed.
- P. Jungwirth and P. S. Cremer, Nat. Chem., 2014, 6, 261–263 CrossRef CAS PubMed.
- P. Ball and J. E. Hallsworth, Phys. Chem. Chem. Phys., 2015, 17, 8297–8305 RSC.
- A. P. dos Santos, A. Diehl and Y. Levin, Langmuir, 2010, 26, 10778–10783 CrossRef CAS PubMed.
- Y. Marcus, Curr. Opin. Colloid Interface Sci., 2016, 23, 94–99 CrossRef CAS.
- R. J. Carlton, C. D. Ma, J. K. Gupta and N. L. Abbott, Langmuir, 2012, 28, 12796–12805 CrossRef CAS PubMed.
- M. M. Ries-Kautt and A. F. Ducruix, J. Biol. Chem., 1989, 264, 745–748 CAS.
- Y. Zhang and P. S. Cremer, Proc. Natl. Acad. Sci. U. S. A., 2009, 106, 15249–15253 CrossRef CAS PubMed.
- A. Salis, D. Bilaničová, B. W. Ninham and M. Monduzzi, J. Phys. Chem. B, 2007, 111, 1149–1156 CrossRef CAS PubMed.
- D. Bilaničová, A. Salis, B. W. Ninham and M. Monduzzi, J. Phys. Chem. B, 2008, 112, 12066–12072 CrossRef PubMed.
- P. H. Von Hippel and T. Schleich, Acc. Chem. Res., 1969, 2, 257–265 CrossRef CAS.
- J. W. Bye and R. J. Falconer, Protein Sci., 2013, 22, 1563–1570 CrossRef CAS PubMed.
- M. Boström, F. W. Tavares, S. Finet, F. Skouri-Panet, A. Tardieu and B. W. Ninham, Biophys. Chem., 2005, 117, 217–224 CrossRef PubMed.
- L. M. Pegram, T. Wendorff, R. Erdmann, I. Shkel, D. Bellissimo, D. J. Felitsky and M. T. Record, Jr., Proc. Natl. Acad. Sci. U. S. A., 2010, 107, 7716–7721 CrossRef CAS PubMed.
- S. Sukenik, L. Sapir, R. Gilman-Politi and D. Harries, Faraday Discuss., 2013, 160, 225–237 RSC , discussion 311–227.
- M. Yamasaki, H. Yano and K. Aoki, Int. J. Biol. Macromol., 1991, 13, 322–328 CrossRef CAS PubMed.
- D. F. Parsons and A. Salis, Curr. Opin. Colloid Interface Sci., 2016, 23, 41–49 CrossRef CAS.
- W. J. Becktel and J. A. Schellman, Biopolymers, 1987, 26, 1859–1877 CrossRef CAS PubMed.
- H. Weingärtner, Angew. Chem., Int. Ed., 2008, 47, 654–670 CrossRef PubMed.
- H. Weingärtner, C. Cabrele and C. Herrmann, Phys. Chem. Chem. Phys., 2012, 14, 415–426 RSC.
- F. van Rantwijk and R. A. Sheldon, Chem. Rev., 2007, 107, 2757–2785 CrossRef CAS PubMed.
- D. Constantinescu, H. Weingärtner and C. Herrmann, Angew. Chem., Int. Ed., 2007, 46, 8887–8889 CrossRef CAS PubMed.
- M. Senske, S. Ebbinghaus and C. Herrmann, in Foundations and Contemporary Approaches, ed. M. Bastos, 2016, ch. 13, pp. 247–259 Search PubMed.
- D. Constatinescu, C. Herrmann and H. Weingärtner, Phys. Chem. Chem. Phys., 2010, 12, 1756–1763 RSC.
- P. L. Privalov and G. I. Makhatadze, J. Mol. Biol., 1990, 213, 385–391 CrossRef CAS PubMed.
- R. Ravindra and R. Winter, Z. Phys. Chem., 2003, 217, 1221–1243 CrossRef CAS.
- P. L. Privalov, Crit. Rev. Biochem. Mol. Biol., 1990, 25, 281–305 CrossRef CAS PubMed.
- G. I. Makhatadze, M. M. Lopez, J. M. Richardson, 3rd and S. T. Thomas, Protein Sci., 1998, 7, 689–697 CrossRef CAS PubMed.
- C. Q. Hu, J. M. Sturtevant, J. A. Thomson, R. E. Erickson and C. N. Pace, Biochemistry, 1992, 31, 4876–4882 CrossRef CAS PubMed.
- C. N. Pace and G. R. Grimsley, Biochemistry, 1988, 27, 3242–3246 CrossRef CAS PubMed.
- C. Lange, G. Patil and R. Rudolph, Protein Sci., 2005, 14, 2693–2701 CrossRef CAS PubMed.
- Y. Shu, M. Liu, S. Chen, X. Chen and J. Wang, J. Phys. Chem. B, 2011, 115, 12306–12314 CrossRef CAS PubMed.
- A. M. Figueiredo, J. Sardinha, G. R. Moore and E. J. Cabrita, Phys. Chem. Chem. Phys., 2013, 15, 19632–19643 RSC.
- P. Attri, P. Venkatesu and A. Kumar, Phys. Chem. Chem. Phys., 2011, 13, 2788–2796 RSC.
- N. K. Poddar, Z. A. Ansari, R. K. B. Singh, A. A. Moosavi-Movahedi and F. Ahmad, Biophys. Chem., 2008, 138, 120–129 CrossRef CAS PubMed.
- Y. F. Liu and J. M. Sturtevant, Biochemistry, 1996, 35, 3059–3062 CrossRef CAS PubMed.
- S. S. Cho, G. Reddy, J. E. Straub and D. Thirumalai, J. Phys. Chem. B, 2011, 115, 13401–13407 CrossRef CAS PubMed.
- J. F. Brandts and L. Hunt, J. Am. Chem. Soc., 1967, 89, 4826–4838 CrossRef CAS PubMed.
- G. Velicelebi and J. M. Sturtevant, Biochemistry, 1979, 18, 1180–1186 CrossRef CAS PubMed.
- S. R. Martin, V. Esposito, P. De Los Rios, A. Pastore and P. A. Temussi, J. Am. Chem. Soc., 2008, 130, 9963–9970 CrossRef CAS PubMed.
- O. Miyawaki and M. Tatsuno, J. Biosci. Bioeng., 2011, 111, 198–203 CrossRef CAS PubMed.
- A. E. Smith, L. Z. Zhou, A. H. Gorensek, M. Senske and G. J. Pielak, Proc. Natl. Acad. Sci. U. S. A., 2016, 113, 1725–1730 CrossRef CAS PubMed.
- M. Senske, A. E. Smith and G. J. Pielak, Angew. Chem., Int. Ed., 2016, 55, 3586–3589 CrossRef CAS PubMed.
- N. Schwierz, D. Horinek, U. Sivan and R. R. Netz, Curr. Opin. Colloid Interface Sci., 2016, 23, 10–18 CrossRef CAS.
- S. C. Flores, J. Kherb, N. Konelick, X. Chen and P. S. Cremer, J. Phys. Chem. C, 2012, 116, 5730–5734 CAS.
- N. Schwierz, D. Horinek and R. R. Netz, Langmuir, 2013, 29, 2602–2614 CrossRef CAS PubMed.
- L. Medda, A. Salis and E. Magner, Phys. Chem. Chem. Phys., 2012, 14, 2875–2883 RSC.
- A. Ben-Naim, Biopolymers, 1975, 14, 1337–1355 CrossRef CAS.
- H.-A. Yu and M. Karplus, J. Chem. Phys., 1988, 89, 2366–2379 CrossRef CAS.
- D. Ben-Amotz, Annu. Rev. Phys. Chem., 2016, 67, 617–638 CrossRef CAS PubMed.
- A. Tischer, H. Lilie, M. Auton and C. Lange, Biopolymers, 2014, 101, 1129–1140 CrossRef CAS PubMed.
Footnotes |
| † Electronic supplementary information (ESI) available. See DOI: 10.1039/c6cp05080h |
| ‡ National Institute for R&D in Chemistry and Petrochemistry, Spl. Independentei 202, 060021 Bucharest, Romania. |
| This journal is © the Owner Societies 2016 |