 Open Access Article
Creative Commons Attribution 3.0 Unported Licence
Adsorption and separation of binary and ternary mixtures of SO2, CO2 and N2 by ordered carbon nanotube arrays: grand-canonical Monte Carlo simulations
Mahshid
Rahimi
*a,
Jayant K.
Singh
ab and
Florian
Müller-Plathe
a
aTechnische Universität Darmstadt, Eduard-Zintl-Institut für Anorganische und Physikalische Chemie, Alarich-Weiss-Str. 4, D-64287 Darmstadt, Germany. E-mail: mahshid.rahimi@theo.chemie.tu-darmstadt.de
bDepartment of Chemical Engineering, Indian Institute of Technology Kanpur, Kanpur-208016, India
First published on 11th January 2016
Abstract
The adsorption and separation behavior of SO2–CO2, SO2–N2 and CO2–N2 binary mixtures in bundles of aligned double-walled carbon nanotubes is investigated using the grand-canonical Monte Carlo (GCMC) method and ideal adsorbed solution theory. Simulations were performed at 303 K with nanotubes of 3 nm inner diameter and various intertube distances. The results showed that the packing with an intertube distance d = 0 has the highest selectivity for SO2–N2 and CO2–N2 binary mixtures. For the SO2–CO2 case, the optimum intertube distance for having the maximum selectivity depends on the applied pressure, so that at p < 0.8 bar d = 0 shows the highest selectivity and at 0.8 bar < p < 2.5 bar, the highest selectivity belongs to d = 0.5 nm. Ideal adsorbed solution theory cannot predict the adsorption of the binary systems containing SO2, especially when d = 0. As the intertube distance is increased, the ideal adsorbed solution theory based predictions become closer to those of GCMC simulations. Only in the case of CO2–N2, ideal adsorbed solution theory is everywhere in good agreement with simulations. In a ternary mixture of all three gases, the behavior of SO2 and CO2 remains similar to that in a SO2–CO2 binary mixture because of the weak interaction between N2 molecules and CNTs.
1. Introduction
In the last decade carbon nanotubes (CNTs) have been widely studied as adsorbents of different gases such as H2, N2, CO2, SO2, alkanes and noble gases.1,2 This great interest in using CNTs for gas adsorption and separation is mainly due to their hollow cylindrical geometry, low mass density and large specific area.3,4 In many studies, CNTs were compared with other gas sorbents and found to have higher gas adsorption and separation. Lu et al. studied CO2 capture experimentally and showed that CNTs are better adsorbents in terms of capacity per mass, compared with other sorbents such as zeolites and activated carbon.5 Diffusivities of light gases (H2 and CH4) in carbon nanotubes and zeolites with comparable pore sizes were studied by molecular dynamics simulations. It was found that the diffusivity of H2 and CH4 in carbon nanotubes is orders of magnitude faster than in zeolites.6 Using grand canonical Monte Carlo (GCMC) simulations for CO2 and CH4 adsorption, Huang et al. showed that CNTs have a higher selectivity for CO2/CH4 separation than that reported for activated carbons, zeolite 13X and metal organic frameworks (MOFs).7The important role of carbon porosity was revealed by simulated SO2 adsorption isotherms on activated carbon.8 This role is even more important in the case of CNTs because of their well-defined structure and arrangement. Accordingly, the optimization of the geometrical properties like the tube diameter and the intertube distance has always been a question. Jakobtorweihen et al.9 employed GCMC simulations to investigate the adsorption of linear alkanes and alkenes on CNTs with different tube diameters. Narrower pores were found to have higher adsorption at low pressure (p < 2 bar) and lower adsorption at high pressure (2 bar < p < 1000 bar). Kowalczyk and coworkers10 used GCMC to measure the amount of CO2 adsorbed onto CNTs and showed that the optimum diameter for having the highest adsorption depends on the applied pressure. This result was confirmed by our recent study of SO2 adsorption on CNTs.11 The same method has been used to measure the adsorption of CO2 and SO2 molecules on single-walled CNTs (SWCNTs).12 The contributions of the inner and outer adsorption were studied and it was found out that for both molecules, the inside adsorption is higher at low pressures. The outside adsorption becomes larger above 10 and 2 bar for CO2 and SO2, respectively.
In CNT bundles, the intertube distance is a second geometrical parameter that can be tuned13 and it is also claimed to have an important effect on adsorption.14,15 Agnihotri et al.16 combined the experiment and simulations to analyze the adsorption sites in CNT bundles. They showed that grooves are the most favorable sites. They are completely filled already at very low pressure. In order to measure the adsorption locally, Bienfait and coworkers17 used neutron diffraction measurements of different gases on CNTs. They also found grooves as the best adsorption sites.
The ideal adsorbed solution theory (IAST) developed by Myers and Prausnitz18 is a technique used to calculate multi-component adsorption equilibria based on single-component adsorption isotherms. The agreement of IAST and GCMC simulations for the adsorption of binary mixtures of CO2/CH4/H2/N2 on various materials, like MOFs and CNTs, was confirmed by various groups.19–21 Cannon and coworkers22 used GCMC to study the adsorption and selectivity of linear alkanes on closed nanotube bundles. They found that the adsorption of the alkane mixture agrees between IAST and simulations. Peng et al.23 showed that the IAST prediction of CO2 and CH4 adsorption in ordered carbon nanopipes is in good agreement with experiment. Using molecular simulations and IAST, the selectivity of nanoporous carbon materials for the mixture of CO2 and H2 was studied by Kumar and Rodríguez-Reinoso.24 To investigate the effects of nanopore structure, carbon nanotubes, slit-shaped porous carbon form and a carbon model with a disordered pore structure, were considered. The results showed that CNTs have the highest selectivity towards CO2.
Among all the adsorption and separation studies, there are few investigations of SO2 and its mixture with CO2. Wang and coworkers25 used GCMC to calculate SO2–CO2 and SO2–N2 mixtures in CNT bundles with different tube diameters. They found that among the studied diameters, 1.09 nm and 0.81 nm show the highest selectivity for SO2–CO2 and SO2–N2 respectively. Furthermore, they showed a decrease of selectivity with increasing temperature. The observations of these authors were still based on bundles of single-walled CNTs (SWCNTs) with a fixed intertube distance. However, it is not known if such behavior also occurs for double- or multi-walled CNT bundles. Moreover, the effect of the intertube distance was not investigated. Finally, it would be helpful for experimental studies to know if IAST can be used for the adsorption of the SO2–CO2 mixture in bundles of CNTs.
In this study, we investigate the adsorption and selectivity of binary (SO2–CO2, CO2–N2 and SO2–N2) and ternary mixtures (SO2–CO2–N2) in bundles of double-walled carbon nanotubes (DWCNTs) using the GCMC method. Since the influence of the tube diameter has been exhaustively studied,11,26 the intertube distances of DWCNT arrays are varied in order to find the optimum geometry for each adsorption/separation situation. Predictions of the IAST approximation are compared with the results of the simulations.
2. Model and method
Following our previous studies,14,15,26 the DWCNTs in the simulation box are arranged on a hexagonal lattice, and periodic boundary conditions are used in all three directions (cf. Fig. 1 of ref. 14). In the present study, DWCNTs with an inner tube diameter of 2R = 2.98 nm, which was found to be optimum for single gas adsorption, are used.26 Since the adsorption isotherm was found to be insensitive to the CNT length,11 the DWCNT length is fixed to be 7.38 nm. The intertube distance (the surface to surface distance between the outer layers of adjacent tubes, i.e. d = 0 represents the case of touching DWCNTs, the distance between the positions of their surface carbons being 0.34 nm) is varied (d = 0 to 2 nm), since it has a stronger effect compared to the tube diameter, and since its optimum value depends on the applied pressure.11 The simulation box length in the direction of the CNT axes is equal to the CNT length; the simulation box lengths in the other two directions are adjusted to the intertube distance. In total, there are 11![[thin space (1/6-em)]](https://www.rsc.org/images/entities/char_2009.gif) 760 carbon atoms in the simulation box.
760 carbon atoms in the simulation box.
The DWCNTs are considered as rigid structures with a C–C bond length of 0.142 nm. The Lennard-Jones potential of the AMBER96 force field27 is used to describe DWCNTs. It has been used in similar work.11,28 The EPM2 model of Harris and Yung29 is used to describe CO2. In this model, CO2 is considered as a 3-site rigid molecule with Lennard-Jones potential (σC–C = 0.2757 nm, εC–C = 0.23388 kJ mol−1, σO–O = 0.3033 nm, εO–O = 0.66837 kJ mol−1) plus a set of partial point charges (qC = 0.6512e), a fixed bond length (lC–O = 0.1149 nm) and a fixed angle (θO–C–O = 180°). Ketko et al.30 developed an optimized intermolecular potential for SO2 to accurately calculate the vapor–liquid equilibria, critical properties, vapor pressure, and heats of vaporization. This rigid model, which is used in the present study, describes SO2 using Lennard-Jones interactions and partial charges (σS–S = 0.339 nm, εC–C = 0.61361 kJ mol−1, σO–O = 0.305 nm, εO–O = 0.65684 kJ mol−1, lS–O = 0.1432 nm, and θO–S–O = 119.3°). The N2 molecules are also modeled as a 3-site molecule with Lennard-Jones potential plus a set of partial point charges, a fixed bond length and a fixed angle.31 Dissimilar non-bonded interactions are calculated using the Lorentz–Berthelot combining rules. The electrostatic interactions are calculated using the smooth-particle-mesh Ewald (SPME) method.32
The grand canonical Monte Carlo method at constant chemical potential μ, volume V and temperature T is used to calculate the adsorption and separation coefficients of gases. Three Monte Carlo moves, displace, rotate, and insert/delete, with the probability of 0.2, 0.1 and 0.7, respectively, are implemented. The temperature is fixed at 303 K and the atomic cutoff is 1 nm. In order to account for the non-ideality of gases, the fugacities of the components in the bulk phases were calculated using the Peng–Robinson equation of state (PR EOS) for mixtures.33 For all simulation runs, 1 × 10⁷ Monte Carlo steps are used for equilibration and another 1 × 10⁷ Monte Carlo steps for data collection. The output of the simulation is the total number of gas molecules of each component, which is converted to a common unit for adsorption, mmol of gas per gram of adsorbent and is denoted ni for the component i. Adsorption selectivity of component i relative to component j in a binary system is calculated using
 | (1) |
The composition of flue gas strongly depends on the type of fuel and the combustion conditions. For instance, the flue gas from coal-fire consists of 7 to 15% moles of CO2.34,35 In this work, we use the molar ratio of 5![[thin space (1/6-em)]](https://www.rsc.org/images/entities/char_2009.gif) :
:![[thin space (1/6-em)]](https://www.rsc.org/images/entities/char_2009.gif) 95, 1
95, 1![[thin space (1/6-em)]](https://www.rsc.org/images/entities/char_2009.gif) :
:![[thin space (1/6-em)]](https://www.rsc.org/images/entities/char_2009.gif) 99 and 15
99 and 15![[thin space (1/6-em)]](https://www.rsc.org/images/entities/char_2009.gif) :
:![[thin space (1/6-em)]](https://www.rsc.org/images/entities/char_2009.gif) 85 in the bulk phase for the binary mixtures of SO2–CO2, SO2–N2, and CO2–N2, respectively.25,36–38
85 in the bulk phase for the binary mixtures of SO2–CO2, SO2–N2, and CO2–N2, respectively.25,36–38
The ideal adsorbed solution theory (IAST) predicts multi-component sorption equilibria from single-component isotherms.18 According to IAST, the following equation holds for each component of the studied mixture based on an analogy with Raoult's law:
| pyi = xipi(π), | (2) |
 | (3) |
 | (4) |
Levan and Vermeulen used eqn (2)–(4) together with the single-component Langmuir isotherms to derive an explicit and thermodynamically consistent binary Langmuir isotherm.39,40 The adsorption isotherm of each pure component is simulated individually using GCMC. Then it is fitted using the Langmuir isotherm
 | (5) |
 | (6) |
 | (7) |
 | (8) |
3. Results and discussion
3.1. SO2–CO2 mixture
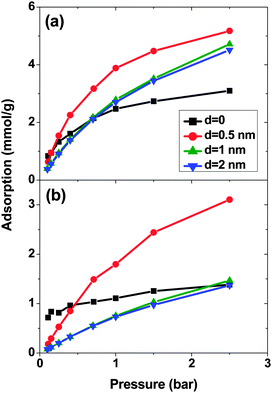
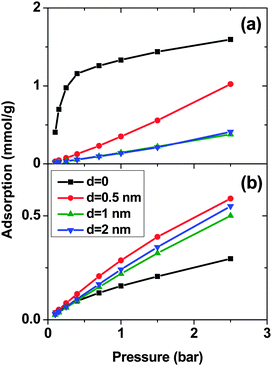
Fig. 1 shows the adsorption isotherms of a mixture of SO2 and CO2 at a molar ratio of 5![[thin space (1/6-em)]](https://www.rsc.org/images/entities/char_2009.gif) :
:![[thin space (1/6-em)]](https://www.rsc.org/images/entities/char_2009.gif) 95 on a bundle of 3 nm diameter DWCNTs as a function of the total bulk pressure. For CO2 (Fig. 1a), the system with d = 0.5 nm shows the highest adsorption in the studied pressure range. The reason is the direct relationship between d and adsorption energy, and the inverse relationship between d and accessible volume. The competing effects of adsorption energy and adsorption space volume cause d = 0.5 nm to be the optimum intertube distance for having the maximum adsorption in this pressure range (0.1 bar < p < 2.5 bar). The bulk partial pressure of CO2 (pCO2) varies with the total pressure of the particle reservoir. It is in the range 0.095 to 2.375 bar. The optimum intertube distance, within this partial pressure range, for the maximum adsorption amount is similar to that of pure CO2.26 For SO2 (Fig. 1b) at low pressure p < 0.5 bar, d = 0 has the highest adsorption because there is a strong interaction between SO2 molecules and CNT walls in the interstitial and groove regions when d = 0. Since the partial pressure of SO2 is very low (0.005 bar < pSO2 < 0.025 bar), these regions have enough volume to accommodate the SO2 molecules. As the pressure increases to ∼0.5 bar (partial pressure of SO2 is ∼0.025 bar), the intertube volume is saturated and the optimal intertube distance is slightly shifted up to d = 0.5 nm. This trend continues up to the highest studied pressure in the present work (p = 2.5 bar) and CNT arrays with d = 0.5 nm have the highest adsorption between 0.5 bar and 2.5 bar. It is expected, however that a further increase of pressure will shift the optimal intertube distance to even higher values, as seen in earlier work for the adsorption of pure SO2.11 Moreover, it was found in the earlier studies11,26 for a pure SO2 system, that the maximum adsorption at low pressures is achieved for d = 0.3 nm11 and d = 0.526 nm. Our results do not contradict these findings, since the lowest pressure studied in the previous studies was pSO2 ∼0.1 bar, but not the very low pressure region (0.005 bar < pSO2 < 0.125 bar) of this work. Furthermore, our results confirm the previous finding that the optimum intertube distance depends on the applied pressure and the optimum d is shifted to higher values with increasing pressure.11
95 on a bundle of 3 nm diameter DWCNTs as a function of the total bulk pressure. For CO2 (Fig. 1a), the system with d = 0.5 nm shows the highest adsorption in the studied pressure range. The reason is the direct relationship between d and adsorption energy, and the inverse relationship between d and accessible volume. The competing effects of adsorption energy and adsorption space volume cause d = 0.5 nm to be the optimum intertube distance for having the maximum adsorption in this pressure range (0.1 bar < p < 2.5 bar). The bulk partial pressure of CO2 (pCO2) varies with the total pressure of the particle reservoir. It is in the range 0.095 to 2.375 bar. The optimum intertube distance, within this partial pressure range, for the maximum adsorption amount is similar to that of pure CO2.26 For SO2 (Fig. 1b) at low pressure p < 0.5 bar, d = 0 has the highest adsorption because there is a strong interaction between SO2 molecules and CNT walls in the interstitial and groove regions when d = 0. Since the partial pressure of SO2 is very low (0.005 bar < pSO2 < 0.025 bar), these regions have enough volume to accommodate the SO2 molecules. As the pressure increases to ∼0.5 bar (partial pressure of SO2 is ∼0.025 bar), the intertube volume is saturated and the optimal intertube distance is slightly shifted up to d = 0.5 nm. This trend continues up to the highest studied pressure in the present work (p = 2.5 bar) and CNT arrays with d = 0.5 nm have the highest adsorption between 0.5 bar and 2.5 bar. It is expected, however that a further increase of pressure will shift the optimal intertube distance to even higher values, as seen in earlier work for the adsorption of pure SO2.11 Moreover, it was found in the earlier studies11,26 for a pure SO2 system, that the maximum adsorption at low pressures is achieved for d = 0.3 nm11 and d = 0.526 nm. Our results do not contradict these findings, since the lowest pressure studied in the previous studies was pSO2 ∼0.1 bar, but not the very low pressure region (0.005 bar < pSO2 < 0.125 bar) of this work. Furthermore, our results confirm the previous finding that the optimum intertube distance depends on the applied pressure and the optimum d is shifted to higher values with increasing pressure.11
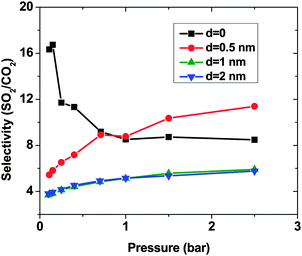
As expected, for all conditions CO2 has higher adsorption than SO2 due to its higher bulk concentration (95 mol%). However, the selectivity of SO2 over CO2 shows a non-uniform behavior (Fig. 2). When d = 0, the system shows the highest selectivity (SSO2/CO2 = 16) at very low pressure, since molecules perfectly fit to the narrow intertube pores of DWCNTs. Increasing the pressure to p = 0.7 bar leads to a decrease of the selectivity to around 8. With a further increase of the pressure, the selectivity remains almost constant (SSO2/CO2 ∼ 8). The situation for the intertube distance of d = 0.5 nm is almost reversed. The selectivity increases strongly with pressure up to p = 0.7 bar, then it continues increasing but very smoothly. As a result, the two curves cross at p ∼0.8 bar. The two systems with d = 1 and 2 nm show a behavior qualitatively similar to d = 0.5 nm. The selectivity increases smoothly over the whole studied pressure region, but does not exceed 6. Consequently, at lower pressure (p < 0.8 bar) d = 0 has the highest selectivity, while the highest selectivity at higher pressure (0.8 bar < p < 2.5 bar) is found for the system with d = 0.5 nm. The selectivity found by Wang et al.25 for SWCNTs with similar inner diameters (2R = 2.71 nm) varies from ∼10 to ∼20 at different pressures and it is obviously higher than that found in the present study for DWCNTs. This is most likely due to the higher outer diameter of our DWCNTs (2Rout = 3.66 nm) and consequently, their larger intertube volume which leads to a decrease in adsorption energy. Moreover, it was also reported for single-gas adsorption that SWCNTs show higher adsorption than DWCNTs.41 DWCNTs, however, are still attractive from an application view point, since SWCNTs are expensive and more difficult to synthesise.42 Moreover, the selectivity value is found here to range from 4 to 16, indicating that the optimization of the pore size tuning can increase it by 4 times.
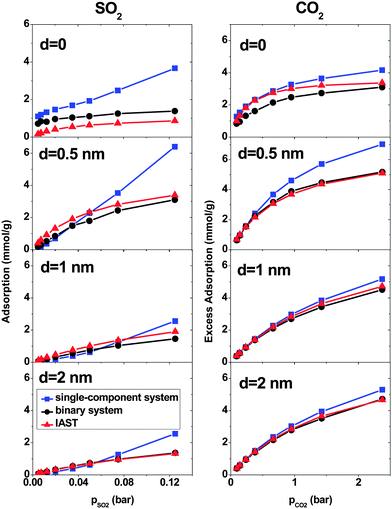
At low pressure, CO2 and SO2 may adsorb separately without interfering with each other.43 In order to verify this assertion, separate simulations are performed for pure SO2 and CO2 with the pressure same as the partial pressure in the binary mixture. Fig. 3 shows the SO2 and CO2 adsorption as a function of their partial pressure in three different situations: a single-component system, a binary system and IAST prediction. When d = 0, the IAST prediction does not agree with the simulation data, neither for CO2 nor for SO2. This means that, in the adsorbed phase, SO2 and CO2 molecules do not behave as an ideal mixture because of their high density in the low intertube space volume of this geometry. The GCMC results show higher SO2 adsorption and lower CO2 adsorption than the IAST prediction, reflecting the high selectivity for SO2 of this system (Fig. 2). Furthermore, the adsorption of single gases deviates markedly from the adsorption of each component in the binary mixture. Thus, the assumption that each gas is adsorbed separately without interfering with the other is evidently not true in the CNT arrays with d = 0. There are also deviations between IAST predictions and the GCMC adsorption isotherms of single gases because the IAST predicts that each component occupies a certain amount of volume and as a result, the accessible volume in the IAST prediction for the other component is less than in single-gas systems. With increasing intertube distance, IAST predictions for the adsorption isotherms move closer to the simulation results, so that for d = 2 nm, the difference between adsorbed amounts predicted by IAST and simulation is less than 5% for CO2 at pCO2 = 2.375 bar and also for SO2 at pSO2 = 0.125 bar. This is due to the reduction of the gas density with increasing intertube distance. Adsorption isotherms of the binary system and single-component systems show the same trend with increasing d. For instance, at pCO2 = 0.66 bar, the deviations between the adsorption of CO2 in the binary system and the single-component system are 13%, 8% and 7% for d = 0.5 nm, 1 nm and 2 nm, respectively. Moreover, for d > 0, there is only a small deviation between the adsorption isotherms of the binary system and that of a single-component system at low pressure (e.g. for CO2, d = 2 nm, at pCO2 = 0.38 bar, the deviation is ∼5%). Increasing the pressure enhances the deviation so that for d = 2 nm, at pCO2 = 2.375 bar, the difference between adsorption in the binary system and the single-component system is ∼13%. Therefore, at very low pressure, the two gases behave independently. However, at higher pressure, each gas occupies a considerable amount of volume and reduces the accessible volume for the other one and, hence, the presence of one gas has a detrimental effect on the adsorption of the other.
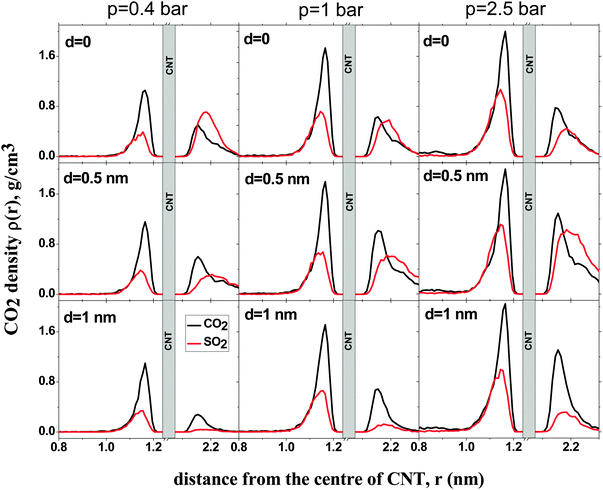
Fig. 4 shows the density profiles of CO2 and SO2 in systems with different d and p. The density profile inside the CNT is indifferent to d, as has been observed before for pure CO2 and SO2 adsorption.11,14, In all systems, a layer of CO2 and SO2 forms at low pressure (p = 0.4 bar). This layer grows in density with increasing pressure. Outside the CNT, when d = 0, the density of SO2 is higher than that of CO2 at low pressure. As the pressure increases, the density of SO2 remains almost constant but the density of CO2 increases, confirming what has been observed for the selectivity in Fig. 2. The reduction in selectivity is due to the outer intertube volume being small and SO2 being a large molecule. Therefore, the intertube volume saturates soon. The CO2 molecules are smaller and they can fit themselves in the remaining space. For d = 0.5 nm, the densities of both CO2 and SO2 increase with pressure. The increase is larger for SO2 than for CO2, because the intertube space is larger, and SO2 molecules interact strongly with CNT carbon molecules than CO2. A similar behavior is observed for the case of d = 1 nm.
3.2. SO2–N2 mixture
Fig. 5 presents SO2 and N2 adsorption isotherms of a SO2–N2 (1![[thin space (1/6-em)]](https://www.rsc.org/images/entities/char_2009.gif) :
:![[thin space (1/6-em)]](https://www.rsc.org/images/entities/char_2009.gif) 99) mixture. When d = 0, a remarkable increase of SO2 adsorption can be seen until p ∼0.4 bar. Beyond that, the adsorption approaches saturation with a lower rate. Increasing d leads to a drastic reduction in SO2 adsorption and, hence, d = 0 has the highest adsorption in the studied pressure region. This is due to the strong interaction between SO2 molecules and CNT walls in the intertube space and also to the very low partial pressure of SO2 (pSO2 < 0.025 bar), which causes the limited intertube space to be large enough to accommodate the few SO2 molecules. This result is in line with SO2 adsorption isotherms in the SO2–CO2 system (Fig. 1), where d = 0 also has the maximum adsorption at low partial pressure (pSO2 < 0.025 bar).
99) mixture. When d = 0, a remarkable increase of SO2 adsorption can be seen until p ∼0.4 bar. Beyond that, the adsorption approaches saturation with a lower rate. Increasing d leads to a drastic reduction in SO2 adsorption and, hence, d = 0 has the highest adsorption in the studied pressure region. This is due to the strong interaction between SO2 molecules and CNT walls in the intertube space and also to the very low partial pressure of SO2 (pSO2 < 0.025 bar), which causes the limited intertube space to be large enough to accommodate the few SO2 molecules. This result is in line with SO2 adsorption isotherms in the SO2–CO2 system (Fig. 1), where d = 0 also has the maximum adsorption at low partial pressure (pSO2 < 0.025 bar).
For N2, d = 0 shows the lowest adsorption because most of the available volume, especially in the groove and interstitial regions, is occupied by SO2 molecules which have stronger interactions with CNTs. However, N2 adsorption increases uniformly with pressure, since N2 molecules are smaller than SO2 and they fit in the accessible space between SO2 molecules. Increasing the intertube distance slightly to 0.5 nm has two important consequences. Firstly, the intertube volume increases and secondly, the density of SO2 molecules decreases. As a result, there is more space accessible for N2 molecules. Therefore, N2 adsorption is notably higher at d = 0.5 nm than at d = 0. A further increase in the intertube distance reduces the interaction between N2 molecules and DWCNT carbons which causes a decrease in the adsorption of N2.
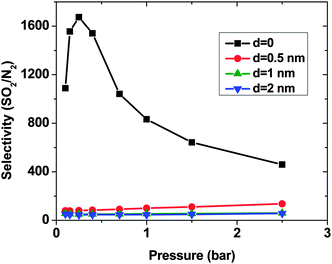
The adsorption of N2 is generally less than SO2 in all systems, although the bulk concentration of N2 is much higher than SO2. To investigate the reason we calculate the minimum energy of one single SO2, CO2 and N2 molecule inside the CNT. For this purpose the probability of the Monte Carlo moves, displace, rotate, and insert/delete, is changed to 0.7, 0.3 and 0.0, respectively, and the simulation is carried out at low temperature (5 K). The minimum adsorption energies are −13 kJ mol−1, −22.6 kJ mol−1 and −27.4 kJ mol−1 for one N2, CO2 and SO2 molecule, respectively. Thus, the observed selectivity for SO2 (Fig. 6) is mainly caused by the interaction of individual molecules with the CNT. The selectivity for the system with d = 0 increases initially with pressure, reaching a maximum of more than 1600 at p = 0.25 bar. Further increase of pressure leads to a decrease in selectivity, but at p = 2.5 bar it is still ∼400. This is due to the fact that SO2 is a large molecule with a strong interaction with CNT. Therefore, SO2 molecules fill the intertube space soon at low pressure (p < 0.4 bar) and saturate the system. On the other hand, the small N2 molecules can be accommodated between SO2 molecules and thus, N2 adsorption shows a monotonic increase as a function of pressure. The selectivity for the system with d = 0.5 nm increases smoothly from ∼80 to ∼140 with pressure. The selectivities of the other systems are almost constant (SSO2/N2 ∼ 55 and ∼45 for d = 1 nm and 2 nm, respectively) in the studied pressure region.
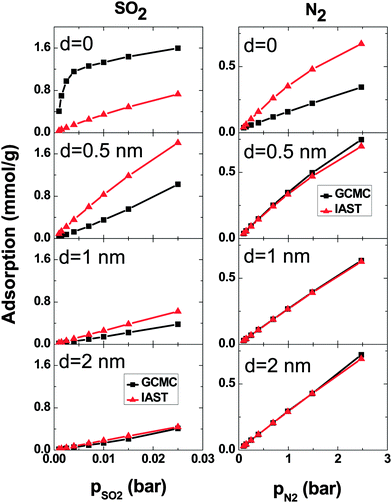
A comparison between GCMC simulations and IAST predictions in the SO2–N2 system is shown in Fig. 7. As for the SO2–CO2 system, IAST cannot predict the adsorption very well for d = 0. Because of the high density in the intertube space, the mixing behavior of the adsorbed gases is far from ideal. For larger d, the gas density decreases and as a consequence the IAST predictions become more similar to the adsorption calculated using simulations. Furthermore, the IAST predictions and GCMC results of the SO2–N2 mixture agree better than those of the SO2–CO2 mixture because of the weaker interaction of N2 with either SO2 or CNT carbons than that of CO2.
3.3. CO2–N2 mixture
Fig. 8 shows the adsorption of CO2–N2 (15![[thin space (1/6-em)]](https://www.rsc.org/images/entities/char_2009.gif) :
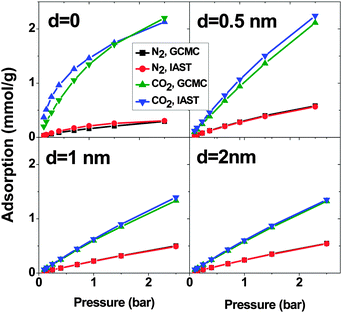
:![[thin space (1/6-em)]](https://www.rsc.org/images/entities/char_2009.gif) 85) mixtures calculated using the GCMC method and IAST predictions. When d = 0, there is an obvious deviation between IAST predictions and GCMC simulations but it is much less than what is observed in SO2–CO2 and SO2–N2 mixtures. Like the previous mixtures, in the systems with d > 0, the deviation between IAST and GCMC is less than that of d = 0. At p = 2.5 bar, the maximum deviation is less than 7% and 3% for CO2 and N2 respectively. In short, IAST can predict the CO2–N2 mixture better than SO2–CO2 and SO2–N2 mixtures. This result is in line with previous work.19,21
85) mixtures calculated using the GCMC method and IAST predictions. When d = 0, there is an obvious deviation between IAST predictions and GCMC simulations but it is much less than what is observed in SO2–CO2 and SO2–N2 mixtures. Like the previous mixtures, in the systems with d > 0, the deviation between IAST and GCMC is less than that of d = 0. At p = 2.5 bar, the maximum deviation is less than 7% and 3% for CO2 and N2 respectively. In short, IAST can predict the CO2–N2 mixture better than SO2–CO2 and SO2–N2 mixtures. This result is in line with previous work.19,21
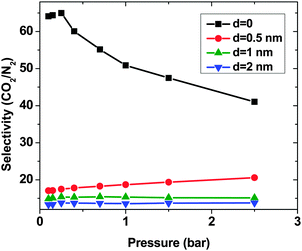
Similar to the SO2–N2 mixture, in all 4 CNT arrays, CO2 shows higher adsorption than N2 although in the bulk, there is more N2 than CO2. This is due to the stronger interaction between CO2 and CNTs (cf. Section 3.2). Moreover, d = 0 shows the highest difference between the N2 and CO2 adsorption. The selectivity highlights this difference (Fig. 9). The system with d = 0 has the highest selectivity. With increasing pressure, the limited adsorption space in this region causes the selectivity to decrease from around 70 to around 40 at p = 2.5 bar, which is still high. Unlike for d = 0, an increase in the pressure enhances the selectivity of CNTs with d = 0.5 nm. Nevertheless, the selectivity of this system is much lower (∼20) than that with d = 0. For larger d, the system shows an almost constant selectivity (∼15 and ∼13 for d = 1 nm and 2 nm, respectively) in the studied pressure range and it is lower than for the two shorter intertube distances. Moreover, the observed selectivity of CO2 over N2 for optimized DWCNTs is higher than what has been reported for zeolites (between ∼10 and ∼30 depending on the type of zeolite and the pressure) and MOFs (between ∼5 and ∼40 depending on the type of MOFs and the pressure).36,44
3.4. Ternary mixture
To represent flue gas composition more realistically, we calculated the selectivity of a ternary mixture to CNT arrays with d = 0.5 nm (Fig. 10). The molar ratio of N2–CO2–SO2 considered is 84.21![[thin space (1/6-em)]](https://www.rsc.org/images/entities/char_2009.gif) :
:![[thin space (1/6-em)]](https://www.rsc.org/images/entities/char_2009.gif) 15
15![[thin space (1/6-em)]](https://www.rsc.org/images/entities/char_2009.gif) :
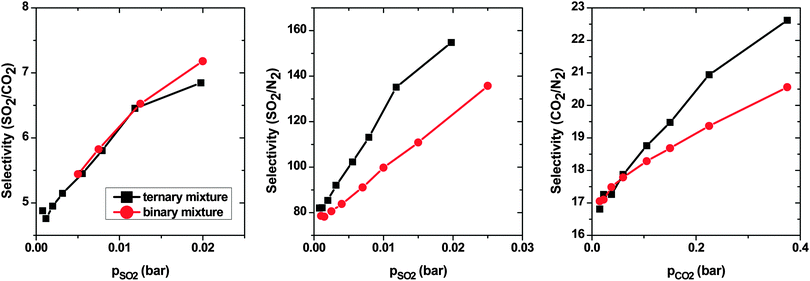
:![[thin space (1/6-em)]](https://www.rsc.org/images/entities/char_2009.gif) 0.79, which is similar to ratios of studied binary mixtures in the present work. The selectivity of SO2 over CO2 increases with pressure from ∼4.5 to ∼7. This trend is very similar to what was observed for the SO2–CO2 binary mixture. This result was expected, since the interaction between N2 and CNT is very weak in comparison with that between either SO2 or CO2 and the CNT. Thus, N2 does not have an influence on the selectivity of SO2 over CO2. The selectivity of SO2 over N2 (and CO2 over N2) in a ternary mixture shows the same trend as in a binary mixture. The selectivities increase with pressure, however, in a ternary mixture, SSO2/N2 (SCO2/N2), they are apparently higher than in a binary mixture. The presence of two species (CO2 and SO2), which are both more adsorptive than N2, leads to an additional crowding-out of N2 from adsorption sites and, as a result, higher selectivities.
0.79, which is similar to ratios of studied binary mixtures in the present work. The selectivity of SO2 over CO2 increases with pressure from ∼4.5 to ∼7. This trend is very similar to what was observed for the SO2–CO2 binary mixture. This result was expected, since the interaction between N2 and CNT is very weak in comparison with that between either SO2 or CO2 and the CNT. Thus, N2 does not have an influence on the selectivity of SO2 over CO2. The selectivity of SO2 over N2 (and CO2 over N2) in a ternary mixture shows the same trend as in a binary mixture. The selectivities increase with pressure, however, in a ternary mixture, SSO2/N2 (SCO2/N2), they are apparently higher than in a binary mixture. The presence of two species (CO2 and SO2), which are both more adsorptive than N2, leads to an additional crowding-out of N2 from adsorption sites and, as a result, higher selectivities.
4. Conclusion
In this work, we used grand-canonical Monte Carlo simulations to study the adsorption and separation properties of parallel-aligned DWCNTs for flue gas mixture components (SO2, CO2, and N2) at 303 K. Bundles of DWCNTs with a constant inner diameter of 2R = 3 nm but different intertube distances of d = 0–2 nm were studied.The quantity and quality of the selectivity for each system depend on the type of adsorbate molecules and also on the adsorbent structure. For SO2–CO2 mixtures, the adsorption of CO2 and SO2 as a function of the intertube distance is nonlinear. As a result, at low pressures p < 0.8 bar, bundles whose tubes touch each other (d = 0) show the highest selectivity towards SO2. For higher pressures, bundles with a finite but short intertube distance (d = 0.5 nm) show the highest selectivity. For SO2–N2 and CO2–N2, on the other hand, no such pressure dependence is found and close-packed CNT bundles (d = 0) have the maximum selectivity towards SO2 and CO2, respectively, over the whole studied pressure range. The selectivity relates directly to the difference in the strength of interaction between each gas species and CNTs. The highest difference and consequently, the highest selectivity are observed between SO2 and N2, followed by CO2 and N2, and finally SO2 and CO2. The lowest and the highest observed selectivities are 4 and 16 for SO2–CO2, 50 and 1600 for SO2–N2, and 10 and 70 for CO2–N2, respectively. The overall picture does not change for a ternary mixture of all three gases, because the adsorption of N2 is so much weaker than the other two gases that their adsorption equilibria are not influenced by the presence of N2. The selectivity results indicate that firstly, DWCNTs are excellent materials for gas purification and secondly, optimizing the pore structure is very important to achieve the highest selectivity. Fortunately, close-packed bundles are easy to obtain45 and show the highest selectivity in most cases.
The IAST predictions fail in predicting the adsorption for mixtures involving SO2, in particular when d = 0. Increasing d reduces the deviation between IAST and GCMC in SO2–CO2 and SO2–N2 binary mixtures. Nevertheless, the results are still not in agreement, indicating that IAST is not suitable for the systems containing strongly interacting molecules like SO2. In the case of CO2–N2, the IAST and GCMC are in good agreement and like the other two systems, as d increases, the deviation between GCMC and IAST reduces.
Acknowledgements
MR would like to thank Sadanandam Namsani for valuable comments and discussion. JKS thanks the Alexander von Humboldt Foundation and the Ministry of Earth Sciences, GOI, for financial support. This work was supported by the Priority Programme 1570 Porous media with well-defined pore structure in chemical engineering: Modeling, application, synthesis of Deutsche Forschungsgemeinschaft.References
- F. L. Darkrim, P. Malbrunot and G. P. Tartaglia, Int. J. Hydrogen Energy, 2002, 27, 193–202 CrossRef CAS.
- J. Zhao, A. Buldum, J. Han and J. P. Lu, Nanotechnology, 2002, 13, 195–200 CrossRef CAS.
- X. Ren, C. Chen, M. Nagatsu and X. Wang, Chem. Eng. J., 2011, 170, 395–410 CrossRef CAS.
- M. J. O'Connell, Carbon Nanotubes: Properties and Applications, CRC Taylor & Francis, Boca Raton, FL, 2006 Search PubMed.
- C. Lu, H. Bai, B. Wu, F. Su and J. F. Hwang, Energy Fuels, 2008, 22, 3050–3056 CrossRef CAS.
- A. I. Skoulidas, D. M. Ackerman, J. K. Johnson and D. S. Sholl, Phys. Rev. Lett., 2002, 89, 185901 CrossRef PubMed.
- L. Huang, L. Zhang, Q. Shao, L. Lu, X. Lu, S. Jiang and W. Shen, J. Phys. Chem. C, 2007, 111, 11912–11920 CAS.
- S. Furmaniak, A. P. Terzyk, P. A. Gauden, P. Kowalczyk and G. S. Szymański, Chem. Phys. Lett., 2013, 578, 85–91 CrossRef CAS.
- S. Jakobtorweihen and F. J. Keil, Mol. Simul., 2009, 35, 90–99 CrossRef CAS.
- P. Kowalczyk, S. Furmaniak, P. A. Gauden and A. P. Terzyk, J. Phys. Chem. C, 2010, 114, 21465–21473 CAS.
- Y. Yang, M. Rahimi, J. K. Singh, M. C. Böhm and F. Müller-Plathe, J. Phys. Chem. C Search PubMed , under review.
- Z. Nickmand, S. F. Aghamiri, M. R. Talaie Khozanie and H. Sabzyan, Sep. Sci. Technol., 2014, 49, 499–505 CrossRef CAS.
- D. N. Futaba, K. Hata, T. Yamada, T. Hiraoka, Y. Hayamizu, Y. Kakudate, O. Tanaike, H. Hatori, M. Yumura and S. Iijima, Nat. Mater., 2006, 5, 987–994 CrossRef CAS PubMed.
- M. Rahimi, J. K. Singh, D. J. Babu, J. J. Schneider and F. Müller-Plathe, J. Phys. Chem. C, 2013, 117, 13492–13501 CAS.
- M. Rahimi, J. K. Singh and F. Müller-Plathe, J. Phys. Chem. C, 2015, 119, 15232–15239 CAS.
- S. Agnihotri, J. P. B. Mota, M. Rostam-Abadi and M. J. Rood, Carbon, 2006, 44, 2376–2383 CrossRef CAS.
- M. Bienfait, P. Zeppenfeld, N. Dupont-Pavlovsky, M. Muris, M. Johnson, T. Wilson, M. DePies and O. Vilches, Phys. Rev. B: Condens. Matter Mater. Phys., 2004, 70, 035410 CrossRef.
- A. L. Myers and J. M. Prausnitz, AIChE J., 1965, 11, 121–127 CrossRef CAS.
- X. Peng, X. Cheng and D. Cao, J. Mater. Chem., 2011, 21, 11259–11270 RSC.
- R. Babarao, Z. Hu, J. Jiang, S. Chempath and S. I. Sandler, Langmuir, 2007, 23, 659–666 CrossRef CAS PubMed.
- P. Kowalczyk, Phys. Chem. Chem. Phys., 2012, 14, 2784–2790 RSC.
- J. J. Cannon, T. J. H. Vlugt, D. Dubbeldam, S. Maruyama and J. Shiomi, J. Phys. Chem. B, 2012, 116, 9812–9819 CrossRef CAS PubMed.
- X. Peng, D. Cao and W. Wang, Chem. Eng. Sci., 2011, 66, 2266–2276 CrossRef CAS.
- K. Vasanth Kumar and F. Rodríguez-Reinoso, RSC Adv., 2012, 2, 9671 RSC.
- W. Wang, X. Peng and D. Cao, Environ. Sci. Technol., 2011, 45, 4832–4838 CrossRef CAS PubMed.
- M. Rahimi, D. J. Babu, J. K. Singh, Y.-B. Yang, J. J. Schneider and F. Müller-Plathe, J. Chem. Phys., 2015, 143, 124701 CrossRef PubMed.
- W. D. Cornell, P. Cieplak, C. I. Bayly, I. R. Gould, K. M. Merz, D. M. Ferguson, D. C. Spellmeyer, T. Fox, J. W. Caldwell and P. A. Kollman, J. Am. Chem. Soc., 1995, 117, 5179–5197 CrossRef CAS.
- G. Hummer, J. C. Rasaiah and J. P. Noworyta, Nature, 2001, 414, 188–190 CrossRef CAS PubMed.
- J. G. Harris and K. H. Yung, J. Phys. Chem., 1995, 12021–12024 CrossRef CAS.
- M. H. Ketko, G. Kamath and J. J. Potoff, J. Phys. Chem. B, 2011, 115, 4949–4954 CrossRef CAS PubMed.
- J.-C. Neyt, A. Wender, V. Lachet and P. Malfreyt, J. Phys. Chem. B, 2011, 115, 9421–9430 CrossRef CAS PubMed.
- U. Essmann, L. Perera, M. L. Berkowitz, T. Darden, H. Lee and L. G. Pedersen, J. Chem. Phys., 1995, 103, 8577 CrossRef CAS.
- D.-Y. Peng and D. B. Robinson, Ind. Eng. Chem. Fundam., 1976, 15, 59–64 CAS.
- P. Wattanaphan, T. Sema, R. Idem, Z. Liang and P. Tontiwachwuthikul, Int. J. Greenhouse Gas Control, 2013, 19, 340–349 CrossRef CAS.
- A. Chakma, Energy Convers. Manage., 1995, 36, 427–430 CrossRef CAS.
- B. Liu and B. Smit, J. Phys. Chem. C, 2010, 114, 8515–8522 CAS.
- W. Sun, L.-C. Lin, X. Peng and B. Smit, AIChE J., 2014, 60, 2314–2323 CrossRef CAS.
- X. Xu, C. Song, R. Wincek, J. M. Andresen, B. G. Miller and A. W. Scaroni, Fuel Chem. Div. Prepr., 2003, 48, 162–163 CAS.
- M. D. LeVan and T. Vermeulen, J. Phys. Chem., 1981, 85, 3247–3250 CrossRef CAS.
- A. Sharma, S. Namsani and J. K. Singh, Mol. Simul., 2014, 41, 414–422 CrossRef.
- D. D. Do, H. D. Do, A. Wongkoblap and D. Nicholson, Phys. Chem. Chem. Phys., 2008, 10, 7293–7303 RSC.
- A. Aqel, K. M. M. A. El-Nour, R. A. A. Ammar and A. Al-Warthan, Arabian J. Chem., 2012, 5, 1–23 CrossRef CAS.
- P. Kowalczyk, Phys. Chem. Chem. Phys., 2012, 14, 2784–2790 RSC.
- B. Liu and B. Smit, Langmuir, 2009, 25, 5918–5926 CrossRef CAS PubMed.
- D. J. Babu, M. Lange, G. Cherkashinin, A. Issanin, R. Staudt and J. J. Schneider, Carbon, 2013, 61, 616–623 CrossRef CAS.
| This journal is © the Owner Societies 2016 |

