 Open Access Article
Creative Commons Attribution 3.0 Unported Licence
Can the mechanical activation (polishing) of screen-printed electrodes enhance their electroanalytical response?†
Loanda R.
Cumba
ab,
Christopher W.
Foster
b,
Dale A. C.
Brownson
b,
Jamie P.
Smith
b,
Jesus
Iniesta
c,
Bhawana
Thakur
d,
Devaney R.
do Carmo
a and
Craig E.
Banks
*b
aFaculdade de Engenharia de Ilha Solteira UNESP – Universidade Estadual Paulista, Departamento de Física e Química. Av. Brasil Centro, 56 CEP 15385-000, Ilha Solteira, SP, Brazil
bFaculty of Science and Engineering, School of Science and the Environment, Division of Chemistry and Environmental Science, Manchester Metropolitan University, Chester Street, Manchester M1 5GD, UK. E-mail: c.banks@mmu.ac.uk; Web: http://www.craigbanksresearch.com Fax: +44 (0)161-247-6831; Tel: +44 (0)161-247-1196
cPhysical Chemistry Department and Institute of Electrochemistry, University of Alicante, 03690, San Vicente del Raspeig, Alicante, Spain
dChemistry Division, Modular Labs, Bhabha Atomic Research Centre, Trombay 400085, India
First published on 4th February 2016
Abstract
The mechanical activation (polishing) of screen-printed electrodes (SPEs) is explored and shown to exhibit an improved voltammetric response (in specific cases) when polished with either commonly available alumina slurry or diamond spray. Proof-of-concept is demonstrated for the electrochemical sensing of nitrite where an increase in the voltammetric current is found using both polishing protocols, exhibiting an improved limit of detection (3σ) and a two-fold increase in the electroanalytical sensitivity compared to the respective un-polished counterpart. It is found that mechanical activation/polishing increases the C/O ratio which significantly affects inner-sphere electrochemical probes only (whereas outer-sphere systems remain unaffected). Mechanical activation/polishing has the potential to be a simple pre-treatment technique that can be extended and routinely applied towards other analytes for an observable improvement in the electroanalytical response.
Introduction
Recent years have seen the field of analytical electrochemistry emerge as a powerful tool for the analytical chemist, performing rapid in situ analyses with a high level of accuracy, sensitivity and selectivity and being comparable to conventional analytical techniques whilst also maintaining a low cost and the ability to be scaled into an ‘in-the-field’ sensor.1,2 In light of this, the field of screen-printed electrodes is ever emerging; various carbon forms (particularly graphite), gold and any other working electrode materials can be printed onto inexpensive substrates and, due to their scales of economy, produce cost-effective electrochemical sensing platforms.1,3–16 For example, graphite screen-printed sensors have been applied to the detection of a diverse array of analytes; such as novel psychoactive substances,17,18 Rohpynol®,19 pindolol,20 atropine,21 clonazepam in serum and in wine,22 nimodipine in pharmaceutical formulations23 and chemical markers indicative of both cystic fibrosis24 and tuberculosis25 for potential use in breath sensing, as well as many other analytes of both clinical and environmental interest.26–36 Screen-printed sensors are often modified to improve their electrochemical response with the addition of various metal compounds,37,38 nanoparticles39–41 and even organic substrates,42 however the implementation of mechanical activation/electrode polishing as a pre-treatment has not been reported contrary to their conventional solid electrode counterparts. In fact, only one proof-of-concept study has been reported by Pravda et al.43 who polished a screen-printed electrode (SPE) gently using soft office paper and aggressively using emery paper to improve immunoglobulin (IgG) adsorption. This demonstrated polishing an SPE is plausible, yet the technique has not (to-date), been explored as a pre-treatment to potentially improve their electroanalytical response.To this end, the following work explores the effect of mechanically activating/polishing SPEs using either commonly utilised alumina slurry or diamond spray and explores what affect this potentially has on their electrochemical activity. We seek to answer the question: can the mechanical activation (polishing) of SPEs enhance their electroanalytical response? Proof-of-concept is shown by using mechanical activation/polishing as a simple pre-treatment step towards the detection and quantification of nitrite; a common environmental pollutant44 which electrochemically reacts through an inner-sphere mechanism, i.e. is highly dependent and easily affected by changes to surface features.45
Experimental
All chemicals were of the highest grade available and were used as received (without further purification) from Sigma Aldrich (UK). All solutions were prepared using deionised water of resistivity no less than 18.2 MΩ cm and were vigorously degassed with nitrogen to remove oxygen prior to analysis. Sodium nitrite solutions (1 mmol L−1 in pH 7 phosphate buffer solution (PBS)) were used on the day of preparation. Working solutions of lower concentrations were prepared by the appropriate dilution of the stock solution as mentioned above.Voltammetric measurements were carried out using a Palmsens (Palm Instruments BV, The Netherlands) potentiostat/galvanostat and controlled by PSTrace version 4.4. All electrochemical measurements were performed at room temperature. The screen-printed graphite electrodes (SPEs), which have a 3 mm diameter working electrode were fabricated in-house with appropriate stencil designs using a microDEK 1760RS screen-printing machine (DEK, Weymouth, UK). This screen-printed electrode design has been previously reported.17,19,26–28,30,33,35,46 For the case of each fabricated electrode, first a carbon ink formulation (Product Code: C2000802P2; Gwent Electronic Materials Ltd, UK), which is utilised for the efficient connection of all three electrodes and as the electrode material for both the working and counter electrodes, was screen-printed onto a polyester (Autostat, 250 micron thickness) flexible film. After curing the screen-printed carbon layer in a fan oven at 60 degrees Celsius for 30 minutes, next a silver/silver chloride reference electrode was included by screen-printing Ag/AgCl paste (Product Code: C2040308P2; Gwent Electronic Materials Ltd, UK) onto the polyester substrates, which was subsequently cured once more in a fan oven at 60 degrees Celsius for 30 minutes. Finally, a dielectric paste (Product Code: D2070423D5; Gwent Electronic Materials Ltd, UK) was then printed onto the polyester substrate to cover the connections and define the active electrode areas, including that of the working electrode (3 mm diameter). After curing at 60 degrees Celsius for 30 minutes the SPEs are ready to be used. The electrodes have been characterised electrochemically in prior publications.17,20,28 Prior to mechanical activation/electrode polishing, the Ag/AgCl reference electrode was removed (to avoid contamination of the working electrode) and throughout a conventional three-electrode system was used with a screen-printed graphite electrode (working electrode), a platinum wire (counter electrode) and a Saturated Calomel Electrode, SCE, (reference electrode); consequently, all potentials herein are reported versus the SCE. The physical geometric size of the respective SPE working electrodes was determined to correspond to 0.071 cm2 using callipers. The values of the heterogeneous electron transfer rate constant, k°, were determined utilising the Nicholson47 method through the use of the following equation: ψ = k°[πDnνF/(RT)]−1/2 where ψ is the kinetic parameter, D is the diffusion coefficient, n is the number of electrons involved in the process, F is the Faraday constant, R is the universal gas constant and T is the temperature. The kinetic parameter, ψ, is tabulated as a function of ΔEP (peak-to-peak separation) at a set temperature (298 K) for a one-step, one electron process with a transfer coefficient, α, equal to 0.5.47–49 The function of ψ (ΔEP), which fits Nicholson's data, for practical usage (rather than producing a working curve) is given by: ψ = (−0.6288 + 0.0021X)/(1 − 0.017X)48,50 where X = ΔEP is used to determine ψ as a function of ΔEP from the experimentally recorded voltammetry; from this, a plot of ψ against [πDnνF/(RT)]−1/2 allows the k° to be readily determined.
Scanning electron microscope (SEM) images and surface element analysis were obtained with a JEOL JSM-5600LV model equipped with an energy-dispersive X-ray (EDX) microanalysis package. Raman Spectroscopy was performed using a Renishaw InVia spectrometer with a confocal microscope (×50 objective) spectrometer with an argon laser (514.3 nm excitation) at a very low laser power level (0.8 mW) to avoid any heating effects. X-ray photoelectron spectroscopy (XPS, K-Alpha, Thermo Scientific) was also used. All spectra were collected using Al-K radiation (1486.6 eV), monochromatised by a twin crystal monochromator, yielding a focused X-ray spot with a diameter of 400 μm, at 3 mA × 12 kV. The alpha hemispherical analyser was operated in the constant energy mode with survey scan pass energies of 200 eV to measure the whole energy band and 50 eV in a narrow scan to selectively measure the particular elements. Thus, XPS was used to provide the chemical bonding state as well as the elemental composition. Charge compensation was achieved with the system flood gun that provides low energy electrons and low energy argon ions from a single source.
Preparation of mechanically activated/polished screen-printed graphite electrodes (SPEs)
A saturated solution containing alumina slurry was dropped onto precision lapping and polishing cloths (Kemet, UK) and the SPEs were mechanically activated/polished for differing times (0.5, 1.0, 3.0 and 10.0 minutes) manually in a figure of eight formation; this is the same protocol used universally to polish conventional solid electrodes and we did not seek to explore whether the polishing pattern would influence the reproducibility of the performance of the SPE, but rather kept this constant. After polishing, the electrodes were washed, placed in a beaker containing deionised water and placed into an ultrasonic cleaner/bath for 15 minutes. Following this procedure, the electrodes were removed and dried at room temperature. The mechanically activated electrodes were then ready for use. The same technique was applied when using Kemet diamond spray in decreasing size order 5 to 3 μm.Results and discussion
Screen-printed graphite electrodes (SPEs) were fabricated as described within the Experimental section with the effect of mechanical activation/polishing upon their electrochemical response explored using the redox probe hexaammineruthenium(III) chloride/0.1 mol L−1 KCl; this probe was chosen since it is an outer-sphere redox probe, which is insensitive to the C/O ratio groups and is affected only by the electronic structure (i.e. edge plane like-sites/defects). As shown in ESI Fig. 1† there appears to be a relative increase in the voltammetric peak current following mechanical activation/polishing in comparison to that of a conventional un-mechanically activated/unpolished electrode, suggesting that the process of mechanical activation/polishing potentially has merit as a pre-treatment step to improve its (analytical) electrochemical response. After a subsequent scan-rate study, the working area of the electrode surface, in each instance of polishing time, was estimated using the Randles–Ševčík equation for a quasi-reversible process (at 298 K):51,52 | (1) |
| %Roughness factor = (AR–S/AGeo) × 100 | (2) |
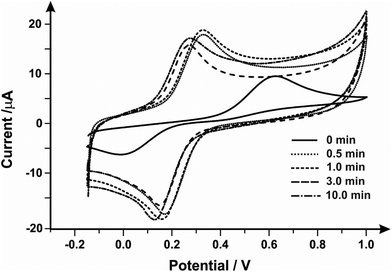
Next, the Fe2+/Fe3+ redox couple was explored to evaluate the effect of mechanical activation/polishing. This is an inner-sphere probe which is known to be very sensitive to surface and functional groups, especially carbonyl groups.55,56Fig. 1 presents cyclic voltammetric profiles where the unmodified/unpolished SPE exhibits a very large peak-to-peak separation, 510 mV, which significantly improves from mechanical activation/polishing with peak-to-peak separations of 160, 170, 130 and 130 mV for polishing times of 0.5, 1.0, 3.0 and 10.0 minutes respectively. Thus it is clear that the mechanical activation/polishing results in an improvement in the voltammetric response in this case, which is likely a result of the introduction of carbon–oxygen groups (known to improve electron transfer rate kinetics for this case, see above).
X-ray photoelectron spectroscopy (XPS) was next applied to distinguish any surface changes from mechanical activation/polishing; the results of XPS analysis for the SPEs pre-treated with mechanical activation/polishing with alumina (0.5, 1.0, 3.0 and 10.0 minutes) and a control (no mechanical activation/polishing) are reported within Table 1. De-convolution of the spectra reveals the total atomic percentage of carbon (C%) and oxygen (O%) decreases and increases respectively with increasing time of polishing; the percentage of C–O or C![[double bond, length as m-dash]](https://www.rsc.org/images/entities/char_e001.gif) O moieties present on the surface increased from 1.22% following no pre-treatment to 7.28%, 7.37%, 6.03% and 7.12% for increasing increments of polishing time (0.5, 1.0, 3.0 and 10.0 minutes respectively). Note the presence of AlO(OH)/Al2O3 which is still present even after the post-treatment (see Experimental section). It is evident that the diminishing in the impurity levels upon polishing is likely the responsible parameter for the sudden increase of oxygen ratio in the XPS data. In addition, Raman spectroscopy was utilised to explore and provide any further insights into surface changes. ESI Fig. 2† depicts Raman spectra of the unpolished (a) and polished (b (0.5 min), c (1.0 min), d (3.0 min) and e (10 min)) SPEs, showing three characteristic peaks of graphitic materials at ca. 1368, 1578 and 2725 cm−1 (D, G and 2D (G′)).66 Even after mechanical activation/polishing, the SPEs exhibited similar responses to the Raman spectrum of an un-mechanically activated/unpolished electrode, suffering only a slight change in the peak intensities. It can be deduced that following mechanical activation/polishing, the electrode surface remains graphitic in nature and does not yield any useful insights.
O moieties present on the surface increased from 1.22% following no pre-treatment to 7.28%, 7.37%, 6.03% and 7.12% for increasing increments of polishing time (0.5, 1.0, 3.0 and 10.0 minutes respectively). Note the presence of AlO(OH)/Al2O3 which is still present even after the post-treatment (see Experimental section). It is evident that the diminishing in the impurity levels upon polishing is likely the responsible parameter for the sudden increase of oxygen ratio in the XPS data. In addition, Raman spectroscopy was utilised to explore and provide any further insights into surface changes. ESI Fig. 2† depicts Raman spectra of the unpolished (a) and polished (b (0.5 min), c (1.0 min), d (3.0 min) and e (10 min)) SPEs, showing three characteristic peaks of graphitic materials at ca. 1368, 1578 and 2725 cm−1 (D, G and 2D (G′)).66 Even after mechanical activation/polishing, the SPEs exhibited similar responses to the Raman spectrum of an un-mechanically activated/unpolished electrode, suffering only a slight change in the peak intensities. It can be deduced that following mechanical activation/polishing, the electrode surface remains graphitic in nature and does not yield any useful insights.
| Functional group | Polishing time (min) | Binding energy (eV) | |||||
|---|---|---|---|---|---|---|---|
| 0 (at%) | 0.5 (at%) | 1.0 (at%) | 3.0 (at%) | 10.0 (at%) | |||
| C–C or C–H and C-graphite | 53.89 | 51.09 | 50.58 | 51.26 | 46.41 | 284.68 | |
| Csp3–H | 10.33 | 7.57 | 7.73 | 8.72 | 16.57 | 285.83 | |
| C–O | 14.73 | 9.5 | 9.87 | 9.22 | 11.61 | 286.68 | |
C![[double bond, length as m-dash]](https://www.rsc.org/images/entities/char_e001.gif) O O |
1.9 | 1.35 | 1.44 | 1.52 | 1.62 | 289.01 | |
C–O or C![[double bond, length as m-dash]](https://www.rsc.org/images/entities/char_e001.gif) O O |
1.22 | 7.28 | 7.37 | 6.03 | 7.12 | 533.12 | |
Cl–C![[double bond, length as m-dash]](https://www.rsc.org/images/entities/char_e001.gif) O, C–Cl O, C–Cl |
7.34 | 2.05 | 2.16 | 2.42 | 2.30 | 200.28 | |
| AlO(OH) gamma boehmite Al2O3 | — | 18.94 | 18.46 | 18.15 | 11.84 | 531.35 | |
| C–O–C | 3.11 | — | — | — | — | 532.41 | |
| Total | Carbon | 80.85 | 69.51 | 69.62 | 70.72 | 76.21 | — |
| Oxygen | 4.33 | 26.22 | 25.83 | 24.18 | 18.96 | — | |
Next, physical visualisation of the surface was obtained through Scanning Electron Microscopy-Energy Dispersive X-ray Spectroscopy (SEM-EDS). SEM-EDS images (Fig. 2) of unpolished (A) and mechanically activated/polished (B (0.5 min), C (1.0 min), D (3.0 min) and E (10 min)) SPEs with a magnification of 5000× were obtained. It can be observed that by increasing the mechanical activation/polishing time, the electrode appears to exhibit a more regular and smooth surface – which is at first sight contradictory to that reported using the redox probes and the % roughness factors described above. However, the later provide (obtained via cyclic voltammetry) an average response over the entire electrode surface, while SEM images are of randomly selected areas. Through analysis of energy-dispersive X-ray spectroscopy (EDS) and XPS (presented above) it can be observed that mechanical activation/polishing results in an increase in the amount of oxygen (as well as the presence of alumina in samples that have been pre-treated (ESI Table 1†)). In summary the process of mechanical activation/polishing results in a surface reorganisation with no additional edge plane sites/defects nor a substantial increase in active area but introduces carbon–oxygen functionalities. As shown above, mechanical activation/polishing will improve the electron transfer kinetics of inner-sphere redox probes only (i.e. the Fe2+/Fe3+ redox couple is improved due to its surface sensitivity (and the possible beneficial introduction of oxygenated species onto the surface), but not the Ru(NH3)63+/2+ probe which is outer-sphere and affected only by the electronic structure of the electrode).
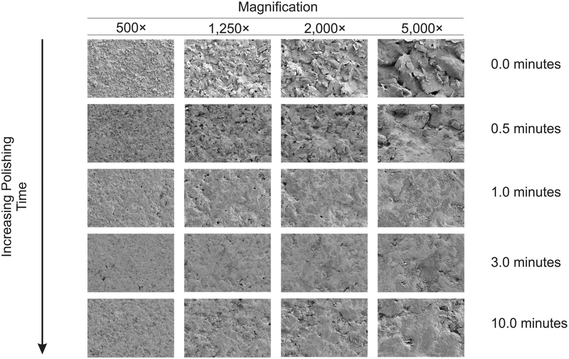 | ||
| Fig. 2 SEM images of the mechanically activated/polished SPEs at four different magnifications for each increment of polishing time using alumina. | ||
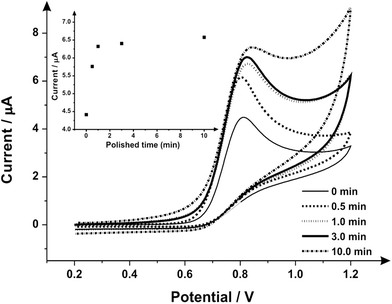
Attention was next turned to the proof-of-concept electroanalytical sensing of sodium nitrite; this model analyte was chosen to explore the any potential electroanalytical improvements through the use of utilising mechanically activated/polished SPEs. It has been extensively studied using carbon-based electrodes, allowing us to benchmark our (electro)analytical performance. The sensing of nitrite is of importance because of its potential adverse effect on human health;57 although previously thought of as an inert metabolite of nitric oxide (NO), recent studies have shown it can be harmful57–59 by forming carcinogenic compounds in the digestive system or interfering in the oxygen availability for tissues.45 Nitrite is typically used in the food industry as a colorant or preservative,60 excessive and inappropriate use of this substance however can potentially cause harm to the population, creating a global need to rapidly and accurately sense nitrite. Fig. 3 shows the cyclic voltammetric response using mechanically activated/polished and un-mechanically activated/un-polished SPEs with increasing mechanical activation/polishing times recorded in 50 μmol L−1 sodium nitrite/PBS (pH 7.0) where an elecroanalytical oxidative peak is visible at approximately +0.84 V (vs. SCE). In accordance with the literature, observable in Fig. 3, there is a significant increase in the intensity of the anodic peak current and a slight shift to more positive overpotentials with increasing mechanical activation/polishing time. Qualitative analysis of the cyclic voltammetry reveals the absence of the reverse reaction (reduction), presenting only the oxidative peak, i.e. it is an irreversible process or has a coupled chemical reaction consuming the oxidised species.45,64,65 Also visible from the voltammetric responses, is that the application of 3 minutes mechanical activation/polishing time offers an improved oxidative current of similar intensity to 10 minutes, however for convenience 3 minutes was used herein. As a control measure, the electroanalytical sensing of sodium nitrite was performed using a 9.2 mg alumina surface modified SPE which has not been mechanically activated/polished with additions made over the range 10.0–90.0 μmol L−1. This data is presented in ESI Fig. 3† where the response is distinct from that presented in Fig. 4, indicating that the alumina itself is not the result of the improved electroanalytical result from mechanical activation/polishing. The surface modification of differing alumina coverages was explored but was found not to result in any improvement nor produce a response as presented above, such as Fig. 4; clearly the improvement in Fig. 3 is due to the mechanical activation/polishing rather than residual surface alumina.
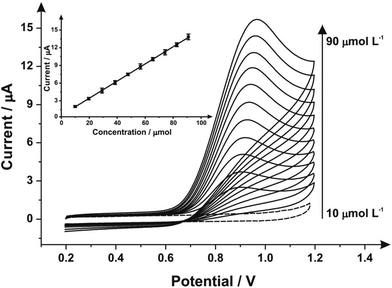
Next, the response of mechanically activated/polished SPEs was explored towards the electroanalytical detection of nitrite through increasing additions of nitrite into pH 7 PBS. Fig. 4 shows the resulting cyclic voltammograms using a mechanically activated/polished SPE (3 minutes) at various concentrations of sodium nitrite, where analysis of the voltammetric peak current (Ip) as a function of nitrite concentration reveals a linear response (see inset of Fig. 4). Fig. 4 (inset) shows the resulting calibration plot which is linear over the range 10.0–90.0 μmol L−1 (Ip (μA) = 0.15 A L mol−1 (μmol L−1) + 1.96 μA; N = 3; R2 = 0.99; with an average %RSD of 2.56% across all data points). The limit of detection (3σ) was found to correspond to 0.89 μmol L−1. The limit of detection is comparable to other reported methods for the detection of nitrite in aqueous media such as: liquid chromatography-amperometric detection of nitrite using a polypyrrole modified glassy carbon electrode doped with tungstodiphosphate anion (1.00 μmol L−1)61 and many others in an array of matrices involving complicated, often expensive protocols.60,62,63 This is also an improvement over the limit of detection (3σ) determined from the calibration plot obtained following no mechanical activation/no polishing (Ip (μA) = 0.07 A L mol−1 (μmol L−1) + 0.33 μA; N = 3; R2 = 0.99; with an average %RSD of 4.95% across all data points), revealing a calculated limit of detection (3σ) equal to 2.35 μmol L−1. Also evident from the calibration curves is that the mechanical activation/polishing pre-treatment offers a greater than two-fold improvement of the electroanalytical sensitivity; 0.15 A L mol−1 following mechanical activation (vs. 0.07 A L mol−1, untreated).
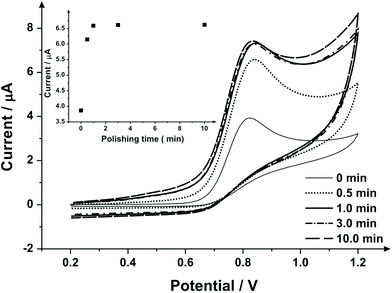
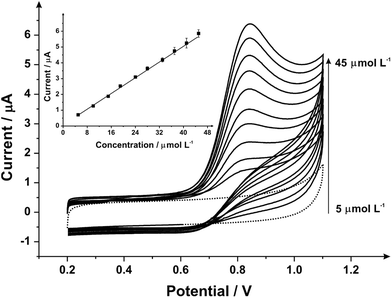
To extend this concept further, SPEs were mechanical activation/polished with diamond spray (which is also commonly used to pre-treat solid reusable electrodes). A cyclic voltammetric study of varying the duration of which the SPEs have been mechanically activated/polished using diamond spray (and using the redox probe hexaammineruthenium(III) chloride/0.1 mol L−1 KCl) was undertaken – this is shown in ESI Fig. 4.† A similar response as observed earlier (ESI Fig. 1†) is evident, where a relative improvement in electron transfer kinetics is observed (however, in this case no change in the voltammetric peak current is observed). Fig. 5 shows the electrochemical oxidation of sodium nitrite which again shows that mechanical activation/polishing an SPE can result in an increase in the oxidative current; with the voltammetric signal (peak) observed to occur at approximately +0.80 V (vs. SCE). Also shown in Fig. 5, in the inset, is the optimum time required to get a satisfactory increase in oxidative current, which is 0.5/1 minutes, as the intensity appears to plateau after this time. These findings are reflected in the SEM micrographs presented in Fig. 6 wherein no apparent improvement in surface ‘smoothness’ is visible after 0.5/1 minutes. EDS analysis (ESI Table 2†), shows a marginal increase in oxygen content from 1.84% to 3.39% after successive polishing times. In light of this, an electrode polished for just 1 minute was selected for further analysis.
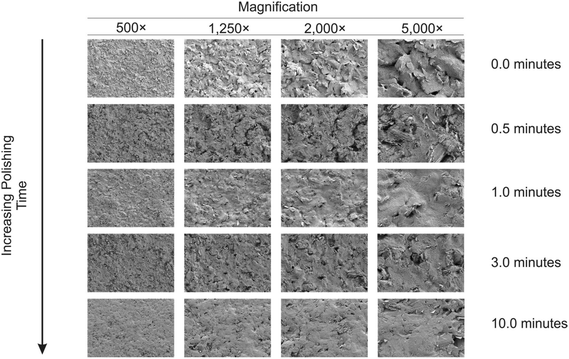 | ||
| Fig. 6 SEM images of mechanically activated/polished SPEs at four different magnifications for each increment of polishing time using diamond spray. | ||
The electroanalytical response towards the sensing of sodium nitrite was next explored with additions made into a pH 7 PBS using mechanically activated/polished SPEs with the resulting data presented in Fig. 7 where analysis of the voltammetric peak height reveals a linear response (inset of Fig. 7; Ip (μA) = 0.13 A L mol−1 (μmol L−1) + 0.06 μA; R2 = 0.99; N = 3; with the average % RSD of 3.10% over the data points) over the range 5–45 μmol L−1. The limit of detection (3σ) is found to correspond to 0.50 μmol L−1. This limit of detection is both lower than the value achieved following mechanical activation/polishing via alumina slurry polishing and no pre-treatment, but also attained faster with just 1 minute required opposed to 3 minutes with alumina for optimum results. Also indicative from the study, as with the alumina slurry pre-treatment, is a two-fold increase in the electroanalytical sensitivity compared to the untreated electrodes 0.13 A L mol−1vs. 0.07 A L mol−1 respectively. Although the exact cause cannot be precisely deduced, the improved electroanalytical response is unlikely to be a change in surface morphology (electrode area) due to the small change in the voltammetry with the outer-sphere redox probe (hexaammineruthenium(III) chloride) which is dependant only upon the electronic structure rather than being surface sensitive. Thus the two-fold increment in the electroanalytical sensitivity is likely due to the change in carbon–oxygen species. In the case of nitrite, this is favourable since it has been independently reported45 that the electrochemical oxidation of nitrite at carbon-based electrodes is significantly influenced by the state of the electrode surface where the electrochemical process is through an inner-sphere mechanism (where strong interactions take place between the electrode active species and electrode surface via the adsorption of nitrite, i.e. highly dependent and easily effected by changes to surface features).45
A further experiment was performed where the electrochemical oxidation of ascorbic acid was explored at mechanically activated SPEs (diamond spray) and an increase in the voltammetric peak current was observed after 30 seconds of mechanical activation; increasing this time further was found not to improve the magnitude of the electrochemical signal. The electroanalytical sensing of this mechanically activated/polished SPE was explored where only a 1.4-fold increase was observed in the electroanalytical sensitivity over that of an un-mechanically activated SPE.
In summary, mechanically activation/polishing beneficially changes the oxygen content introducing new carbon–oxygen groups which improve electron transfer kinetics. This approach thus only affects probes that are inner-sphere which are very sensitive to surface and functional groups. This is compounded by exploring the electrochemical oxidation of ascorbic acid at mechanically activated/polished SPEs where only a modest improvement is observed since this inner-sphere probe is surface sensitive but not oxide sensitive;55 clearly the exact C/O composition is critical in obtaining optimal electrochemical/electroanalytical results.
Conclusions
The use of a simple mechanical activation/polishing technique to activate SPEs is presented, which is low cost and requires non-specialist equipment. The method can be used as a pre-treatment for SPEs to improve their electroanalytical response (in specific cases) as shown herein for the first time. SPEs have already been widely demonstrated as a low cost, reproducible sensing platform previously.The protocol of mechanical activation/polishing beneficially changes the oxygen content upon the SPE's surface by introducing new carbon–oxygen groups, which improve electron transfer rate kinetics (for inner-sphere redox systems only). This approach thus only affects probes that are inner-sphere which are very sensitive to surface and functional groups and does not apply to outer-sphere systems that are affected only by the electrodes electronic state. The proof-of-concept of simply polishing with either alumina or diamond spray as a pre-treatment has been shown by improving the electroanalytical signal two-fold over un-mechanically activated/unpolished counterpart electrochemical signals towards the sensing of nitrite (which is a surface sensitive probe). As a facile and economical protocol, mechanical activation has the potential to be extended and applied to an array of analytes (that are surface sensitive) to offer an observable improvement to their electrochemical response when utilising SPEs as the basis of sensor platforms.
Acknowledgements
Financial support for this research was supplied by Coordenação de Aperfeiçoamento de Pessoal de Nível Superior (CAPES) – Process n° 99999.001285/2014-09 and a British Council Institutional Link grant (no. 172726574).References
- J. P. Metters, R. O. Kadara and C. E. Banks, Analyst, 2011, 136, 1067–1076 RSC
.
- J. P. Smith, J. P. Metters, O. I. G. Khreit, O. B. Sutcliffe and C. E. Banks, Anal. Chem., 2014, 86, 9985–9992 CrossRef CAS PubMed
.
- K. K. Mistry, K. Layek, A. Mahapatra, C. RoyChaudhuri and H. Saha, Analyst, 2014, 139, 2289–2311 RSC
.
- M. Li, Y.-T. Li, D.-W. Li and Y.-T. Long, Anal. Chim. Acta, 2012, 734, 31–44 CrossRef CAS PubMed
.
- M. Arvand, N. Ghodsi and M. A. Zanjanchi, Biosens. Bioelectron., 2016, 77, 837–844 CrossRef CAS PubMed
.
- N. Hernandez-Ibanez, L. Garcia-Cruz, V. Montiel, C. W. Foster, C. E. Banks and J. Iniesta, Biosens. Bioelectron., 2016, 77, 1168–1174 CrossRef CAS PubMed
.
- P. Kanyong, G. Hughes, R. M. Pemberton, S. K. Jackson and J. P. Hart, Anal. Lett., 2016, 49, 236–244 CrossRef CAS
.
- C. Kokkinos, M. Prodromidis, A. Economou, P. Petrou and S. Kakabakos, Electrochem. Commun., 2015, 60, 47–51 CrossRef CAS
.
- N. Lezi and A. Economou, Electroanalysis, 2015, 27, 2313–2321 CrossRef CAS
.
- S. Patris, M. Vandeput, G. M. Kenfack, D. Mertens, B. Dejaegher and J.-M. Kauffmann, Biosens. Bioelectron., 2016, 77, 457–463 CrossRef CAS PubMed
.
- A. A. Rabinca, M. Buleandra, A. Balan, I. Stamatin and A. A. Ciucu, Electroanalysis, 2015, 27, 2275–2279 CrossRef CAS
.
- K. Senthilkumar, T. N. Sithini, N. Thiyagarajan, S. Baskar and J.-M. Zen, Electrochem. Commun., 2015, 60, 113–116 CrossRef CAS
.
- B. V. M. Silva, B. A. G. Rodriguez, G. F. Sales, M. D. P. T. Sotomayor and R. F. Dutra, Biosens. Bioelectron., 2016, 77, 978–985 CrossRef CAS PubMed
.
- P. D. Sinawang, V. Rai, R. E. Ionescu and R. S. Marks, Biosens. Bioelectron., 2016, 77, 400–408 CrossRef CAS PubMed
.
- D. Talarico, F. Arduini, A. Constantino, M. Del Carlo, D. Compagnone, D. Moscone and G. Palleschi, Electrochem. Commun., 2015, 60, 78–82 CrossRef CAS
.
- Y. Teng, W. Liu, M. Lan, S. Ma and C. Ma, Anal. Lett., 2016, 49, 299–306 CrossRef CAS
.
- J. P. Smith, J. P. Metters, C. Irving, O. B. Sutcliffe and C. E. Banks, Analyst, 2014, 139, 389–400 RSC
.
- J. P. Smith, J. P. Metters, O. I. G. Khreit, O. B. Sutcliffe and C. E. Banks, Anal. Chem., 2014, 86, 9985–9992 CrossRef CAS PubMed
.
- J. P. Smith, J. P. Metters, D. K. Kampouris, C. Lledo-Fernandez, O. B. Sutcliffe and C. E. Banks, Analyst, 2013, 138, 6185–6191 RSC
.
- L. R. Cumba, J. P. Smith, D. A. C. Brownson, J. Iniesta, J. P. Metters, D. R. do Carmo and C. E. Banks, Analyst, 2015, 140, 1543–1550 RSC
.
- O. Ramdani, J. P. Metters, L. C. S. Figueiredo, O. Fatibello and C. E. Banks, Analyst, 2013, 138, 1053–1059 RSC
.
- K. C. Honeychurch, J. Brooks and J. P. Hart, Talanta, 2016, 147, 510–515 CrossRef CAS PubMed
.
- P. Salgado-Figueroa, C. Gutierrez and J. A. Squella, Sens. Actuators, B, 2015, 220, 456–462 CrossRef CAS
.
- J. P. Metters, D. K. Kampouris and C. E. Banks, Analyst, 2014, 139 Search PubMed
.
- J. P. Metters, D. K. Kampouris and C. E. Banks, J. Braz. Chem. Soc., 2014, 25, 1667–1672 CAS
.
- J. Metters, F. Tan and C. Banks, J. Solid State Electrochem., 2013, 17, 1553–1562 CrossRef CAS
.
- J. P. Metters, R. O. Kadara and C. E. Banks, Analyst, 2011, 136, 1067–1076 RSC
.
- E. P. Randviir, D. A. C. Brownson, J. P. Metters, R. O. Kadara and C. E. Banks, Phys. Chem. Chem. Phys., 2014, 16, 4598–4611 RSC
.
- A. Brotons, L. A. Mas, J. P. Metters, C. E. Banks and J. Iniesta, Analyst, 2013, 138, 5239–5249 RSC
.
- A. V. Kolliopoulos, J. P. Metters and C. E. Banks, Anal. Methods, 2013, 5, 3490–3496 RSC
.
- A. V. Kolliopoulos, J. P. Metters and C. E. Banks, Anal. Methods, 2013, 5, 851–856 RSC
.
- J. P. Metters, S. M. Houssein, D. K. Kampouris and C. E. Banks, Anal. Methods, 2013, 5, 103–110 RSC
.
- J. P. Metters, R. O. Kadara and C. E. Banks, Analyst, 2013, 138, 2516–2521 RSC
.
- J. P. Metters, R. O. Kadara and C. E. Banks, Sens. Actuators, B, 2012, 169, 136–143 CrossRef CAS
.
- J. P. Metters, F. Tan, R. O. Kadara and C. E. Banks, Anal. Methods, 2012, 4, 3140–3149 RSC
.
- E. P. Randviir, J. P. Metters, J. Stainton and C. E. Banks, Analyst, 2013, 138, 2970–2981 RSC
.
- C. W. Foster, J. Pillay, J. P. Metters and C. E. Banks, Sensors, 2014, 14, 21905–21922 CrossRef CAS PubMed
.
- M. Khairy, R. O. Kadara, D. K. Kampouris and C. E. Banks, Anal. Methods, 2010, 2, 645–649 RSC
.
- E. Bernalte, C. Marín Sánchez and E. Pinilla Gil, Sens. Actuators, B, 2012, 161, 669–674 CrossRef CAS
.
- M. Khairy, D. K. Kampouris, R. O. Kadara and C. E. Banks, Electroanalysis, 2010, 22, 2496–2501 CrossRef CAS
.
- C. M. Welch, C. E. Banks, A. O. Simm and R. G. Compton, Anal. Bioanal. Chem., 2005, 382, 12–21 CrossRef CAS PubMed
.
- K. C. Honeychurch, J. P. Hart, D. C. Cowell and D. W. M. Arrigan, Sens. Actuators, B, 2001, 77, 642–652 CrossRef CAS
.
- M. Pravda, C. O'Meara and G. G. Guilbault, Talanta, 2001, 54, 887–892 CrossRef CAS PubMed
.
- W. J. R. Santos, P. R. Lima, A. A. Tanaka, S. M. C. N. Tanaka and L. T. Kubota, Food Chem., 2009, 113, 1206–1211 CrossRef CAS
.
- Y. Wang, E. Laborda and R. G. Compton, J. Electroanal. Chem., 2012, 670, 56–61 CrossRef CAS
.
- D. A. C. Brownson, A. C. Lacombe, M. Gomez-Mingot and C. E. Banks, RSC Adv., 2012, 2, 665–668 RSC
.
- R. S. Nicholson, Anal. Chem., 1965, 37, 1351–1355 CrossRef CAS
.
- D. A. C. Brownson, S. A. Varey, F. Hussain, S. J. Haigh and C. E. Banks, Nanoscale, 2014, 6, 1607–1621 RSC
.
- D. A. C. Brownson, D. K. Kampouris and C. E. Banks, Chem. Soc. Rev., 2012, 41, 6944–6976 RSC
.
- I. Lavagnini, R. Antiochia and F. Magno, Electroanalysis, 2004, 16, 505–506 CrossRef CAS
.
- D. A. C. Brownson, C. W. Foster and C. E. Banks, Analyst, 2012, 137, 1815–1823 RSC
.
-
C. E. Banks and R. G. Compton, Understanding Voltammetry, Imperial College Press, 2008 Search PubMed
.
- L. C. S. Figueiredo-Filho, D. A. C. Brownson, O. Fatibello-Filho and C. E. Banks, Electroanalysis, 2014, 26, 93–102 CrossRef CAS
.
- R. O. Kadara, N. Jenkinson and C. E. Banks, Sens. Actuators, B, 2009, 138, 556–562 CrossRef CAS
.
- P. Chen and R. L. McCreery, Anal. Chem., 1996, 68, 3958 CrossRef CAS
.
- M. R. Kagan and R. L. McCreery, Langmuir, 1995, 11, 4041 CrossRef CAS
.
-
J. Lerfall, in Processing and Impact on Active Components in Food, ed. V. Preedy, Academic Press, San Diego, 2015, pp. 433–438, DOI:10.1016/B978-0-12-404699-3.00052-4
.
-
M. Abdollahi and M. R. Khaksar, in Encyclopedia of Toxicology, ed. P. Wexler, Academic Press, Oxford, 3rd edn, 2014, pp. 334-337, DOI:10.1016/B978-0-12-386454-3.01206-9
.
- N. S. Bryan, Free Radicals Biol. Med., 2006, 41, 691–701 CrossRef CAS PubMed
.
- D. Zhang, Y. Fang, Z. Miao, M. Ma, X. Du, S. Takahashi, J.-i. Anzai and Q. Chen, Electrochim. Acta, 2013, 107, 656–663 CrossRef CAS
.
- Z. Liu, X. Xi, S. Dong and E. Wang, Anal. Chim. Acta, 1997, 345, 147–153 CrossRef CAS
.
- X.-H. Pham, C. A. Li, K. N. Han, B.-C. Huynh-Nguyen, T.-H. Le, E. Ko, J. H. Kim and G. H. Seong, Sens. Actuators, B, 2014, 193, 815–822 CrossRef CAS
.
- L. Zhou, J.-P. Wang, L. Gai, D.-J. Li and Y.-B. Li, Sens. Actuators, B, 2013, 181, 65–70 CrossRef CAS
.
- Q. Li, C. Batchelor-McAuley and R. G. Compton, J. Phys. Chem. B, 2010, 114, 7423–7428 CrossRef CAS PubMed
.
- R. G. Greenler, J. Chem. Phys., 1962, 37, 2094–2100 CrossRef CAS
.
- D. A. C. Brownson, P. J. Kelly and C. E. Banks, RSC Adv., 2015, 5, 37281–37286 RSC
.
Footnote |
| † Electronic supplementary information (ESI) available. See DOI: 10.1039/c6an00167j |
| This journal is © The Royal Society of Chemistry 2016 |

