 Open Access Article
Combined experimental–theoretical study of the optoelectronic properties of non-stoichiometric pyrochlore bismuth titanate†
Dalal
Noureldine
,
Sheikha
Lardhi
,
Ahmed
Ziani
,
Moussab
Harb
*,
Luigi
Cavallo
and
Kazuhiro
Takanabe
*
Division of Physical Sciences and Engineering, KAUST Catalysis Center (KCC), King Abdullah University of Science and Technology (KAUST), 4700 KAUST, Thuwal, 23955-6900, Saudi Arabia. E-mail: moussab.harb@kaust.edu.sa; kazuhiro.takanabe@kaust.edu.sa
First published on 27th October 2015
Abstract
A combination of experimental and computational methods was applied to investigate the crystal structure and optoelectronic properties of the non-stoichiometric pyrochlore Bi2−xTi2O7−1.5x. The detailed experimental protocol for both powder and thin-film material synthesis revealed that a non-stoichiometric Bi2−xTi2O7−1.5x structure with an x value of ∼0.25 is the primary product, consistent with the thermodynamic stability of the defect-containing structure computed using density functional theory (DFT). The approach of density functional perturbation theory (DFPT) was used along with the standard GGA PBE functional and the screened Coulomb hybrid HSE06 functional, including spin–orbit coupling, to investigate the electronic structure, the effective electron and hole masses, the dielectric constant, and the absorption coefficient. The calculated values for these properties are in excellent agreement with the measured values, corroborating the overall analysis. This study indicates potential applications of bismuth titanate as a wide-bandgap material, e.g., as a substitute for TiO2 in dye-sensitized solar cells and UV-light-driven photocatalysis.
Introduction
Semiconductors lie at the heart of optoelectronic technology, functioning as photon absorbers and/or as charge-carrier transporters. TiO2 is one of the most popular semiconductors for this purpose; it has been utilized in dye-sensitized solar cells1 and in basic studies of photoelectrochemical water splitting reactions.2 To improve the performance of TiO2-based devices, alternative semiconductor materials with highly effective photophysical properties, such as light absorption, charge-carrier extraction and carrier diffusion, are currently screened. Among the most promising materials are bismuth titanates, since they demonstrate great potential because of their excellent photophysical properties and their bandgaps, which can be tuned through site substitution with different elements.3 In particular, the bismuth titanate pyrochlore structure has been used as a pigment4 and, recently, as a UV-light-responsive photocatalyst.5–10In the literature, the properties and functions of bismuth titanates remain controversial because of a lack of detailed information on their optoelectronic properties. In part, this lack of clarity results from the difficulty in controlling their chemical stoichiometry through material synthesis. Pyrochlore bismuth titanate has been synthesized using several methods, including metal–organic decomposition,11 the sol–gel method,12 and co-precipitation.13,14 It was first introduced as Y1−xBixTi2O7, and several non-stoichiometric forms have also been reported, such as the Bi3+- and O2−-deficient compound Bi1.833Ti2O6.75.15 Often, the perovskite Bi4Ti3O12 structure is co-generated in the attempt to synthesize the stoichiometric pyrochlore Bi2Ti2O7 through solid-state reactions.16 Later, Bi1.74Ti2O6.62 synthesized via co-precipitation was reported as a single pure product refined via neutron diffraction, thereby confirming the stoichiometry.17 Recently, a non-stoichiometric structure synthesized via an aqueous sol–gel method was reported, namely, a non-stoichiometric (Bi2−xTi0.75x)Ti2O7 material with x equal to 0.44.7 There remains a need for a detailed study to elucidate the crystal structure as well as the optical and transport properties of this non-stoichiometric Bi2−xTi2O7−1.5x material.
To resolve the inconsistencies regarding the crystal structure and optoelectronic properties of pyrochlore bismuth titanate in the literature, we report here a detailed study combining both experimental and theoretical methods. On the experimental side, care was taken to synthesize the non-stoichiometric phase without any secondary phases. Density functional theory (DFT) and density functional perturbation theory (DFPT) employing both the standard Perdew–Burke–Ernzerhof (PBE) functional and the more accurate screened Coulomb hybrid Heyd–Scuseria–Ernzerhof (HSE06) functional were employed,18,19 with the inclusion of spin–orbit coupling. Our approach enabled the determination of the electronic structure, optical absorption coefficient, dielectric constant and effective charge-carrier masses of the non-stoichiometric Bi1.75Ti2O6.62. There was good agreement between the measured and the calculated values. The impact of the non-stoichiometric structure relative to the ideal Bi2Ti2O7 stoichiometric structure on these properties was also investigated, and a general comparison of the properties with those of the well-studied material TiO2 was performed.
Experimental and theoretical methods
Chemicals
The following chemicals were used: bismuth nitrate pentahydrate (Aldrich, 99.999%), titanium isopropoxide (Aldrich, 99.999%), glacial acetic acid (Fisher Scientific, 99.8%), ammonium hydroxide (Fisher Scientific, 29.44%), methoxy ethanol (Sigma, 99%), acetyl acetone (Aldrich, 99%), and sodium hydroxide (Sigma-Aldrich, 99.99%).Synthesis of bismuth titanate powders and films
Bismuth titanate powders were synthesized using the co-precipitation method.14 Bi(NO3)3·5H2O (10 mmol) was dissolved in 25 ml of glacial acetic acid under stirring at room temperature for 3 h until the solution became clear. Then, titanium isopropoxide was added to adjust the starting Ti/Bi molar ratio to values of 1, 1.23, 1.50, 1.75 and 2 to form crystalline samples with different stoichiometries. After 5 min of stirring, 33 ml of cold ammonium hydroxide was slowly added. When the pH became ∼7, a white precipitate was formed, which was filtered and washed extensively with Milli-Q water (>18 MΩ). After drying at 90 °C for 24 h, the obtained mixture was ground and heat treated at 550 °C for 16 h in a static furnace.Pyrochlore bismuth titanate films were deposited using the chemical solution deposition method via the spin-coating technique. The starting solution was prepared by dissolving 3 mmol of Bi(NO3)3·5H2O in 5 ml of glacial acetic acid. Methoxy ethanol (2.5 ml) was added to adjust the tension of the solution. Then, a stoichiometric amount of titanium isopropoxide (3.7 mmol, Ti/Bi molar ratio = 1.23) was added, causing the solution to turn light yellow. Acetyl acetone (1.5 ml) was added to prevent titanium complexation. In each cycle, the solution was spin coated onto a Si wafer or a fluorine-doped tin oxide (FTO) substrate at 3000 rpm for 30 s. Unless otherwise stated, the deposition was repeated over 10 cycles. Then, the film was dried for 5 min at 200 °C. Finally, it was calcined at 600 °C for 2 h.
Structural and optical characterization
X-ray diffraction (XRD) patterns were collected using a Bruker D8 Advanced A25 diffractometer equipped with a Cu X-ray tube (Cu-Kα; λ = 0.15418 nm) operated at 40 kV and 40 mA in the Bragg–Brentano geometry using a linear position-sensitive detector with an opening of 2.9°. The diffractometer was configured with a 0.44° divergence slit, a 2.9° anti-scatter slit, 2.5° Soller slits, and a nickel filter to attenuate contributions from Cu-Kβ fluorescence. The XRD data were analyzed via the Rietveld method using the fundamental parameters approach, as implemented in the software TOPAS V4.2 (Bruker-AXS). The XRD pattern of pyrochlore bismuth titanate was refined using the cubic structure (space group Fd3m) taken from card 01-089-4732 in the ICSD database. The profile parameters included the scale factor, a sample displacement parameter, and a three-term polynomial for the background. The fundamental parameters approach involves analytically calculating the instrumental broadening in the peak profile. The particle size was calculated from the Lorentzian contribution to this profile. The values of Rwp, RBragg, and the goodness of fit (GOF) were approximately 9, 3, and 2, respectively, for all refinements.Inductively coupled plasma (ICP) measurements were performed using an Agilent 720 Series ICP-OES instrument (Agilent Technologies). Digestion of the material was performed in an ETHOS 1 microwave digestion system (Milestone Srl).
The thicknesses and complex refractive indexes (n + ik) of the films were determined by applying the spectroscopic ellipsometry technique to films deposited on Si substrates. Measurements were made via scanning in the 1–6 eV range using a Jobin-Yvon ellipsometer (UVISEL).
Electrochemical measurements
Electrochemical measurements were performed using Milli-Q water. Sodium hydroxide was used as received to prepare the required 0.1 M electrolyte with pH 13.2. All experiments were performed using a research-grade multi-channel potentiostat (VMP3, BioLogic Science Instruments). Cyclic voltammetry (CV) experiments were performed using a regular one-compartment electrochemical cell with a three-electrode configuration. A Pt wire and an Ag/AgCl (saturated KCl) electrode were used as counter and reference electrodes, respectively. All experiments were recorded against this reference electrode, which was reported on the reversible hydrogen electrode (RHE) scale. Pyrochlore bismuth titanate films on FTO were used as the working electrodes. The CV results were recorded at a scan rate of 10 mV s−1. Electrochemical impedance spectroscopy was performed to estimate the flatband potential of the prepared samples. Prior to impedance spectroscopy, CV was conducted under Ar bubbling at a 10 mV s−1 scan rate from a potential of 0 to 1.7 V vs. RHE to determine the potential window for Mott–Schottky analysis. For this analysis, we chose a potential range of 0.5–1 V vs. RHE, in which the faradic current remains negligible. Impedance spectra were recorded between 10 Hz and 200 kHz, and the amplitude of the superimposed sinusoidal potential signal was 5 mV for each of the 70 steps.Computational methods
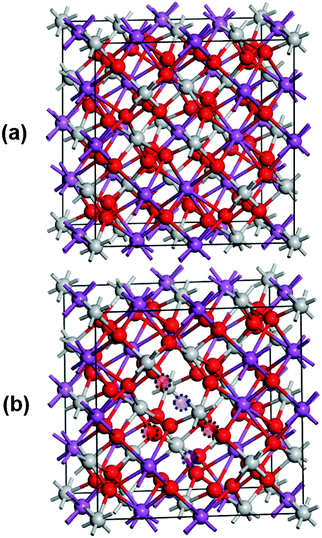
Starting from the cubic crystal structure of Bi2Ti2O7 (pyrochlore phase; space group is Fd3m), which contains 16 functional units (Bi16Ti16O56) or 88 atoms (see Fig. 1a), we modeled the non-stoichiometric Bi1.75Ti2O6.62 structures by removing two neutral Bi atoms and three neutral O atoms from various possible sites in the cell to obtain Bi1.75Ti2O6.625. We explored several geometrical configurations by paying particular attention to key structures exhibiting separated or aggregated Bi and O vacancies (see Fig. 1b and Fig. S1, ESI†). In the structural models considered in our calculations, the oxidation states of the examined elements were Bi3+, Ti4+, and O2−. The various generated structures were optimized using periodic DFT, as implemented in VASP20–23 using the PBE exchange–correlation functional24 and the projected-augmented plane wave (PAW) approach.25 The configurations of the valence electrons adopted in the PAW potentials were 6s2 6p3 for Bi, 3d3 4s1 for Ti, and 2s2 2p4 for O. Cutoff energies of 500 and 610 eV were used for the wave functions and charge augmentations, respectively. The convergence criterion for the SCF cycles was set to 10−5 eV per cell. The atomic coordinates and cell parameters were fully relaxed until all components of the residual forces reached values below 0.01 eV Å−1. In all cases, the Brillouin zone was sampled using a 5 × 5 × 5 Monkhorst–Pack k-point grid.26For density-of-states (DOS) calculations, we employed the screened Coulomb hybrid HSE06 exchange–correlation functional,27–29 as implemented in VASP,20–23 based on the optimized geometries obtained at the PBE level. We used the tetrahedron method with Blöchl corrections for the Brillouin-zone integration. As reported in ref. 30–32, the well-known limitation of GGA functionals (underestimated bandgaps) is expected to be considerably mitigated through the use of HSE06.30–38
To calculate the UV-Vis optical absorption properties of these materials, we applied DFPT, as implemented in VASP using the HSE06 formalism. The optical properties were obtained from the frequency-dependent complex dielectric function ε(ω) = ε1(ω) + iε2(ω) following a methodology described in the literature.39 The real part ε1(ω) was obtained using the Kramers–Kronig relation and it is defined as the electronic contribution to the dielectric constant, whereas the imaginary part ε2(ω) was calculated by summing all possible transitions from occupied to unoccupied states in the Brillouin zone weighted with the matrix elements describing the probabilities of transition. To determine the fraction of the light absorbed in these materials, we calculated the optical absorption coefficient α(ω) (in cm−1) for each compound as a function of the wavelength of the incident light using the following equations:
 | (1) |
 | (2) |
The vibrational contribution to the dielectric constant tensors (εvib) was obtained by computing the full phonon spectrum of the crystal using DFPT and the PBE functional in the framework of the linear response method implemented in VASP.
The effective mass tensors of photogenerated holes (mh*) and electrons (me*) at the band edges of these compounds were computed based on their k-space band structures obtained from the PBE functional using the following expression:
 | (3) |
Results and discussion
Structural properties
We made an experimental attempt to synthesize single-phase pyrochlore bismuth titanate. We used the co-precipitation method to synthesize powder materials with various Ti/Bi precursor ratios. Samples with starting Ti/Bi molar ratios of 1, 1.23, 1.5, 1.75 and 2 were synthesized. The actual Ti/Bi ratios in these samples were confirmed via ICP and found to be 0.96, 1.16, 1.51, 1.71 and 1.92, respectively. Fig. S1 shows the XRD patterns for the samples with varied Ti/Bi molar ratios (ESI†). Fig. S1 (ESI†) shows a magnified view of the region in which amorphous phases appear (23° < 2θ < 28°). It can be seen that for the sample with an initial Ti/Bi ratio of 1, a mixture of the pyrochlore phase with Bi4Ti3O12 as a secondary phase was obtained at 2θ = 33°. The XRD pattern of the powder sample with a Ti/Bi ratio of 1.16 showed a single phase of the pyrochlore structure with no impurities (neither a secondary nor an amorphous phase), and the peaks were indexed according to PDF# 01-089-4732. The characteristic peaks of the pyrochlore structure were clearly observed for the (111) and (222) peaks. Indeed, no amorphous phase existed for the samples with Ti/Bi ratios of 1.16 to 1.51. Higher Ti/Bi ratios of 1.72 and 1.92 led to the formation of an amorphous phase that manifested as a broad increase in the background at 2θ values of 23 to 32°. This chemical composition was confirmed by an ICP measurement, in which a Ti/Bi ratio of 1.16 was found, close to the initial ratio of 1.23. This confirmed that excess titanium created vacancies at the bismuth and oxygen sites, consistent with the proposal in the literature that such vacancies may stabilize the entire structure.17 It should be noted that the impurity phase with low Ti (Bi4Ti3O12) caused the band edge to shift to longer wavelengths, whereas excess Ti would not cause any shift in the band edge, as observed from the Kubelka–Munk function from the UV-Vis spectroscopy results (Fig. S2, ESI†). Further data and discussion on the stoichiometry of Bi2−xTi2O7−1.5x can be found in ESI.†Therefore, for the subsequent characterizations presented in this work, we chose a ratio of Ti/Bi = 1.16. Fig. 2 shows the representative XRD patterns for (a) the single-phase Bi2−xTi2O7−1.5x powder synthesized using the co-precipitation method, to be refined using the Rietveld analysis method; (b) the Bi2−xTi2O7−1.5x thin film deposited on a Si substrate, used for ellipsometric spectroscopy; and (c) the Bi2−xTi2O7−1.5x thin film deposited on an FTO substrate, used for Mott–Schottky analysis. The thin film on the Si sample was calibrated versus the Si(400) peak, which appears at 2θ = 69.12°. All of the samples exhibited a single-phase pyrochlore structure with the same d-spacing for the main peaks (e.g., d222 = 2.98 Å). The relative intensities of the peaks were similar to those in the powder samples, thereby confirming that the films were randomly oriented, similar to the polycrystalline powders.
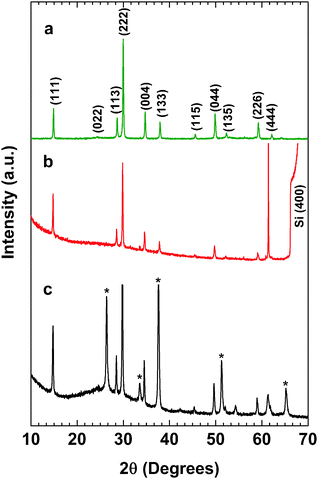 | ||
| Fig. 2 XRD patterns of (a) Bi1.75Ti2O6.62 powders, (b) a Bi1.75Ti2O6.62 thin film on a Si substrate, and (c) a Bi1.75Ti2O6.62 thin film on an FTO substrate. * FTO. | ||
Rietveld analysis was performed for the Bi2−xTi2O7−1.5x sample with Ti/Bi = 1.16 synthesized using the co-precipitation method. The Wyckoff positions of the atoms are summarized in Table S1 (ESI†), and the lattice parameters are summarized in Table 1. The sample had a cubic structure belonging to the Fd3m space group and a lattice parameter of a = 10.35 Å. Bismuth ions (Bi3+) partially occupied 96g, which is of lower symmetry than the normal atomic position (16c) in this space group. Titanium ions (Ti4+) fully occupied the 16d position, and two types of oxygen atoms were present, the first (O) fully occupying the 48f position and the second (O′) partially occupying the 8a position. From Table S1 (ESI†), the numbers of bismuth, titanium, and oxygen atoms deduced from their Wyckoff positions and the corresponding occupancies were 14, 16, and 53 atoms respectively. The chemical composition determined for this structure was Bi1.75Ti2O6.62.
| Sample | Lattice parameters (Å, degree) | |||||
|---|---|---|---|---|---|---|
| a | b | c | α | β | γ | |
| Bi1.75Ti2O6.62 (experimental) | 10.350 | 10.350 | 10.350 | 90.0 | 90.0 | 90 |
| Bi1.75Ti2O6.62 (DFT; aggregated vacancies) | 10.290 | 10.404 | 10.322 | 91 | 90.2 | 90.4 |
| Bi1.75Ti2O6.62 (DFT; separated vacancies) | 10.339 | 10.334 | 10.357 | 90.7 | 88.8 | 88.5 |
| Bi2Ti2O7 (DFT) | 10.328 | 10.328 | 10.328 | 90 | 90 | 90 |
We experimentally confirmed that the non-stoichiometric pyrochlore phase is prevalent in Bi2−xTi2O7−1.5x with x ∼ 0.25 (rich in Ti). Using the DFT/PBE computational method, we systematically investigated the crystal structure of the non-stoichiometric Bi1.75Ti2O6.62 structure and that of the ideal stoichiometric Bi2Ti2O7 structure for comparison. Fig. 1 shows the most relevant relaxed structures, and Table 1 reports their corresponding lattice parameters. For the non-stoichiometric compound, the structure with the lowest energy was obtained for the configuration displaying a direct interaction between 2 Bi and 3 O vacancies (Fig. 1b). This interaction leads to the formation of a small cage in the lattice. Interestingly, upon relaxation, this structure retains very similar lattice parameters (lengths and angles) relative to the stoichiometric structure, in good agreement with the experimental data (Table 1). By contrast, another non-stoichiometric structure displaying well-separated Bi and O vacancies was found to be 0.2 eV less stable than the previous one. In this case, the various atomic positions are strongly displaced upon relaxation from their initial positions, leading to different lattice parameters (especially the angles). The configuration with aggregated vacancies shows less cubic structure distortion (α, β, γ = 91, 90.2, 90.4°) in comparison with the configuration with well-separated vacancies (α, β, γ = 90.7, 88.8, 88.5°). Therefore, we chose to consider the structure with a small cage of defects for the following discussion of the computed material. The formation energy of the stoichiometric Bi2Ti2O7 was calculated to be −1.608 eV per Bi atom, whereas that of Bi1.75Ti2O6.62 was calculated to be −1.783 eV per Bi atom. This confirms that the non-stoichiometric structure is more stable, indicating that it is more favorable to obtain experimentally.
Electronic structure and effective mass
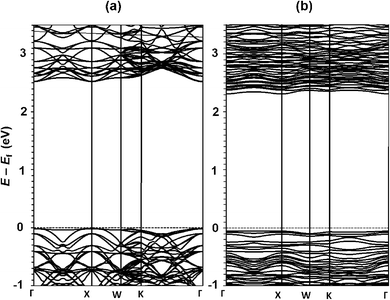
Fig. 3 shows the electronic density of states (DOS) computed for Bi1.75Ti2O6.62 using the HSE06 functional, compared with that for stoichiometric Bi2Ti2O7. The energy dispersion curves of these materials computed using the PBE functional are given in Fig. 4. The electronic analysis reveals that the valence-band states are governed by occupied O 2p orbitals with very weak contributions from Bi 6s orbitals, whereas the conduction-band states are predominantly composed of Ti 3d orbitals. Both compounds are direct (at the Γ or X point) semiconductors (Fig. 4), with bandgap energies of 3.7 eV for Bi2Ti2O7 (Fig. 4a) and 3.4 eV for Bi1.75Ti2O6.62 (Fig. 4b). The lowest-energy bandgaps of these materials originate primarily from O 2p6–Ti 3d0 orbital transitions. By contrast, the DOSs calculated using the PBE functional yield much smaller bandgap energies of 2.5 eV for Bi2Ti2O7 and 2.3 eV for Bi1.75Ti2O6.62, consistent with previous theoretical studies of pyrochlore bismuth titanate.3,41 We also investigated the spin–orbit coupling effect on the electronic structures of Bi2Ti2O7 and Bi1.75Ti2O6.62 using the PBE functional, obtaining small decreases in the bandgaps of 0.1 and 0.2 eV, respectively. By comparing these relative shifts to the values obtained using the HSE06 functional, the bandgaps are predicted to be 3.6 eV for Bi2Ti2O7 and 3.2 eV for Bi1.75Ti2O6.62, in very good agreement with the measured values.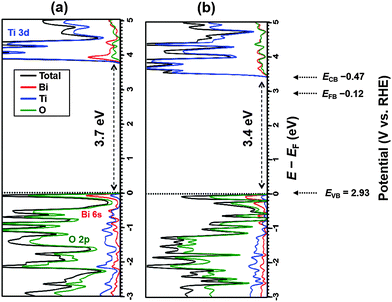 | ||
| Fig. 3 Electronic DOSs obtained using the HSE06 functional for (a) stoichiometric Bi2Ti2O7 and (b) non-stoichiometric Bi1.75Ti2O6.62 material in their most stable configurations, as reported in Fig. 2. Color legend: total DOS in black; DOSs projected onto Bi in red, onto Ti in blue, and onto O atoms in green. Potentials for valence band edge, conduction band edge, and flatband estimated from Mott–Schottky analysis are also represented on the RHE scale (pH 13.2). | ||
The effective mass tensors of photogenerated holes (mh*) and electrons (me*) were computed at the band edges of Bi2Ti2O7 and Bi1.75Ti2O6.62 to evaluate their charge-carrier transport properties. Table 2 reports the values calculated in the three principal crystallographic directions. For Bi2Ti2O7, the effective electron and hole masses were found to be relatively small (0.17, 0.2, and 0.87 for electrons and 0.56, 0.75, and 3.5 for holes in the [001], [010], and [100] directions, respectively). In the case of Bi1.75Ti2O6.62, the effective masses were found to be slightly higher both for electrons (0.3, 0.39, and 1.66, respectively) and for holes (0.45, 36.4, and 14, respectively). In comparison, anatase TiO2 exhibits much lower effective electron and hole masses (0.05m0 and 0.1m0, respectively).18 This reflects the excellent transport properties in the TiO2 system.
| m h* | m e* | |||||
|---|---|---|---|---|---|---|
| Direction | 100 | 010 | 001 | 100 | 010 | 001 |
| Bi1.75Ti2O6.62 | 14 | 36 | 0.45 | 1.7 | 0.39 | 0.30 |
| Bi2Ti2O7 | 3.5 | 0.75 | 0.56 | 0.87 | 0.20 | 0.17 |
Dielectric properties
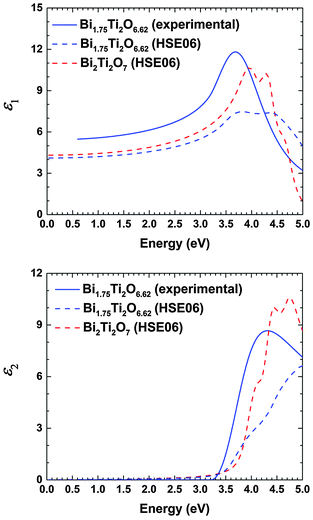
The dielectric constant (εr) is a frequency-dependent parameter and consists of two components: an ionic vibrational polarization component (εvib) and an electronic polarization component (ε∞). At high frequencies relevant to the UV-Vis region considered in our experimental study (1014–1015 Hz), the dielectric constant deduced via spectroscopic ellipsometry contains only the electronic contribution. At lower frequencies (<1013 Hz), the vibrational contribution dominates, which is relevant for Mott–Schottky analysis, as previously discussed.Through retro-simulation of the experimental data, we can deduce the film thickness and also extract the refractive index (n) and the absorption index (k) (Fig. S3, ESI†). To correlate the complex refractive index with the dielectric properties, the following equation is applied:
| ε = ε1 + iε2 = N2 = (n + ik)2 | (4) |
| ε1 = ε∞ = n2 − k2. | (5) |
The ionic contributions εvib were calculated using the DFPT/PBE approach. We obtained a value of 80.1 for the stoichiometric Bi2Ti2O7 compound in all three crystallographic directions. However, for the non-stoichiometric Bi1.75Ti2O6.62 structure, the ionic contributions were 56.6, 76.8 and 87.4 in the xx, yy and zz directions, respectively. Higher dielectric constants were previously reported for these materials (101 and 104),42,43 but those observed here still surpass the dielectric constant value of 45.7 for TiO2.44
Absorption properties
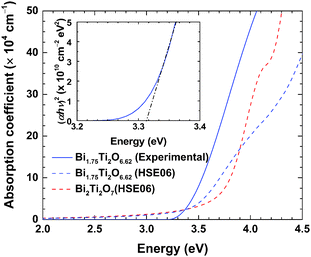
In Fig. 6, the measured and calculated absorption coefficients of non-stoichiometric Bi1.75Ti2O6.62 are plotted, together with the corresponding results calculated for stoichiometric Bi2Ti2O7. The experimental value of the absorption coefficient was deduced from the imaginary part of the dielectric constant measured via spectroscopic ellipsometry. We investigated the bandgap of the non-stoichiometric Bi1.75Ti2O6.62 structure using spectroscopic ellipsometry. The inset of Fig. 6 shows the Tauc plot for the direct transition,45 indicating a bandgap of approximately 3.3 eV. The bandgap values previously reported in the literature are much smaller: theoretically, they have been reported to be 2.63 and 2.89 eV,41 and experimentally, they have been found to be 2.9,46 2.95,5 and 3.0 eV.6 These lower previously reported bandgaps can be explained by the presence of secondary phases (e.g., Bi4Ti3O12) with smaller bandgaps. A reduced bandgap was indeed observed for the sample that contained a Bi4Ti3O12 phase (∼2.95 eV) with a Ti/Bi ratio of 1, as shown in Fig. S2 (ESI†). It has been reported that as the fraction of the Bi4Ti3O12 phase in the sample increases, the color of the powder changes from pale white to yellow.14 Hence, accurate measurements of the bandgap can only be achieved using the single-phase material. From Fig. 6, it can be seen that the calculated absorption coefficient for Bi1.75Ti2O6.62 (dashed blue line) agrees well with the measured one. Both show an onset of absorbance at approximately 3.3 eV, consistent with the observed bandgap energy. It can be seen that the non-stoichiometric structure exhibits a narrowing of the bandgap with respect to the stoichiometric Bi2Ti2O7 structure. This confirms that an accurate description of the absorption properties of the pyrochlore bismuth titanate structure is achievable by considering non-stoichiometric effects, i.e., the presence of (Bi,O) vacancies in the structure.Band positions
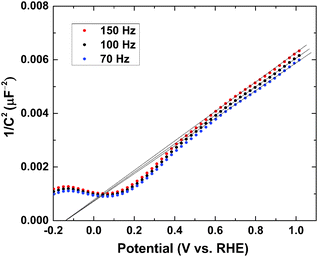
We performed Mott–Schottky measurements of the Bi1.75Ti2O6.62 film on the FTO substrate. A frequency range of 70 to 150 Hz was chosen by analyzing the Bode plot (Fig. S4a, ESI†), and the potential range (0.6–1.0 V vs. RHE) was chosen to be the double-layer region in which there is no faradic current (Fig. S4b, ESI†). Fig. 7 shows the Mott–Schottky plot for the Bi1.75Ti2O6.62 film.We can see from the positive slope that the Bi1.75Ti2O6.62 material has an n-type nature. According to the Mott–Schottky equation,
 | (6) |
The majority carrier concentration (ND) was found to be 3.26 × 1018 cm−3 from the slope of the plot. Next, the density of states in the conduction band (NC) was calculated using eqn (7):
 | (7) |
We could also deduce the difference between the bottom of the conduction band (EC) and EFB using eqn (8):
 | (8) |
The edge of the conduction band was measured to lie at −0.47 V vs. RHE. Consequently, Bi1.75Ti2O6.62 has a more negative conduction band edge than does TiO2, whose conduction band edge has been reported to lie at −0.19 V vs. RHE under similar pH conditions.47 The result is added into Fig. 3 on the RHE scale (pH 13.2). This more negatively located conduction band may allow this material to be applied as an alternative anode material in place of TiO2 in dye-sensitized solar cells to increase the open-circuit potential. The parameters obtained through Mott–Schottky analysis are summarized in Table 3.
| Parameter | Value |
|---|---|
| ε ∞ | 9.8 |
| ε vib(DFPT/PBE) | 73.6 |
| N D | 3.26 × 1018 cm−3 |
| N C | 4.12 × 1018 cm−3 |
| m e* | 0.3 |
| E C | −0.47 V vs. RHE |
| E FB | −0.12 V vs. RHE |
To summarize the comparison with the well-studied material TiO2, higher dielectric constants and higher effective masses were observed in the pyrochlore Bi1.75Ti2O6.62 system. The most prominent difference was evident in the flatband potentials; Bi1.75Ti2O6.62 possesses a more negatively located conduction band, although the bandgap and absorption properties are similar. To take full advantage of these properties, a Bi1.75Ti2O6.62/TiO2 composite may result in better overall performance than either TiO2 or Bi2Ti2O7 alone for photocatalytic reactions.48
Conclusions
A study combining experimental and theoretical methods was conducted to investigate the optoelectronic properties of the non-stoichiometric Bi2−xTi2O7−1.5x structure (x = 0.25), in which a clear distinction between this material and the ideal perfect stoichiometric configuration (x = 0) was observed. Our calculated results for the bandgap and absorption coefficient of the non-stoichiometric structure (Bi1.75Ti2O6.62) exhibited excellent agreement with the bandgap of 3.3 eV measured via ellipsometry, which is narrower than the bandgap computed for the stoichiometric Bi2Ti2O7 material (3.6 eV). The nature of the bandgap was found to be direct as a result of a transition at the Γ or X point. Our calculated static dielectric constants exhibited high values of up to 80.1 for Bi1.75Ti2O6.62. The results indicate that the material is highly anisotropic, with high effective electron and hole masses in certain directions, which may result in lower charge-carrier mobility. The flatband potential and the bottom of the conduction band were measured in 0.1 M NaOH solution (pH 13.2) to be −0.12 and −0.47 V vs. RHE, respectively, more negative than those of the well-known TiO2 compound. This study identified several key parameters of the pyrochlore Bi2−xTi2O7−1.5x material, which may have various potential applications, e.g., may be substituted for or mixed with TiO2 in dye-sensitized solar cells and photocatalytic applications.Acknowledgements
The research reported in this work was supported by the King Abdullah University of Science and Technology.Notes and references
- B. O'Regan and M. Gratzel, Nature, 1991, 353, 737 CrossRef.
- A. Fujishima and K. Honda, Nature, 1972, 238, 37 CrossRef CAS PubMed.
- S. Murugesan, M. N. Huda, Y. Yan, M. M. Al-Jassim and V. Subramanian, J. Phys. Chem. C, 2010, 114, 10598 CAS.
- M. T. Weller, R. W. Hughes, J. Rooke, C. S. Knee and J. Reading, Dalton Trans., 2004, 3032 RSC.
- W. F. Yao, H. Wang, X. H. Xu, J. T. Zhou, X. N. Yang, Y. Zhang and S. X. Shang, Appl. Catal., A, 2004, 259, 29 CrossRef CAS.
- O. Merka, D. W. Bahnemann and M. Wark, Catal. Today, 2014, 225, 102 CrossRef CAS.
- H. Zhou, T.-J. Park and S. S. Wong, J. Mater. Res., 2006, 21, 2941 CrossRef CAS.
- Z. Bian, Y. Huo, Y. Zhang, J. Zhu, Y. Lu and H. Li, Appl. Catal., B, 2009, 91, 247 CrossRef CAS.
- J. Hou, S. Jiao, H. Zhu and R. V. Kumar, J. Solid State Chem., 2011, 184, 154 CrossRef CAS.
- X. H. Xu, W. F. Yao, Y. Zhang, A. Q. Zhou, Y. Hou and M. Wang, Acta Chim. Sin., 2005, 63, 5 CAS.
- Y. Hou, M. Wang, X.-H. Xu, D. Wang, H. Wang and S.-X. Shang, J. Am. Ceram. Soc., 2002, 85, 3087 CrossRef CAS.
- W.-F. Su and Y.-T. Lu, Mater. Chem. Phys., 2003, 80, 632 CrossRef CAS.
- A. L. Hector and S. B. Wiggin, J. Solid State Chem., 2004, 177, 139 CrossRef CAS.
- J. R. Esquivel-Elizondo, B. B. Hinojosa and J. C. Nino, Chem. Mater., 2011, 23, 4965 CrossRef CAS.
- O. Knop, F. Brisse and L. Castelliz, Can. J. Chem., 1969, 47, 971 CrossRef CAS.
- V. Kahlenberg and H. Bohm, Acta Crystallogr., Sect. B: Struct. Sci., 1995, 51, 11 CrossRef.
- I. Radosavljevic, J. S. O. Evans and A. W. Sleight, J. Solid State Chem., 1998, 136, 63 CrossRef CAS.
- T. Le Bahers, M. Rérat and P. Sautet, J. Phys. Chem. C, 2014, 118, 5997 Search PubMed.
- M. Harb, Phys. Chem. Chem. Phys., 2015, 17, 25244 RSC.
- G. Kresse and J. Hafner, Phys. Rev. B: Condens. Matter Mater. Phys., 1994, 49, 14251 CrossRef CAS.
- G. Kresse and J. Furthmüller, Comput. Mater. Sci., 1996, 6, 15 CrossRef CAS.
- G. Kresse and J. Furthmüller, Phys. Rev. B: Condens. Matter Mater. Phys., 1996, 54, 11169 CrossRef CAS.
- G. Kresse and D. Joubert, Phys. Rev. B: Condens. Matter Mater. Phys., 1999, 59, 1758 CrossRef CAS.
- J. P. Perdew, K. Burke and M. Ernzerhof, Phys. Rev. Lett., 1996, 77, 3865 CrossRef CAS PubMed.
- P. E. Blöchl, Phys. Rev. B: Condens. Matter Mater. Phys., 1994, 50, 17953 CrossRef.
- H. J. Monkhorst and J. D. Pack, Phys. Rev. B: Condens. Matter Mater. Phys., 1976, 13, 5188 CrossRef.
- J. Heyd, G. E. Scuseria and M. Ernzerhof, J. Chem. Phys., 2003, 118, 8207 CrossRef CAS.
- J. Heyd, G. E. Scuseria and M. Ernzerhof, J. Chem. Phys., 2006, 124, 219906 CrossRef.
- J. Paier, M. Marsman, K. Hummer, G. Kresse, I. C. Gerber and J. G. Ángyán, J. Chem. Phys., 2006, 125, 249901 CrossRef.
- M. Harb, L. Cavallo and J. M. Basset, J. Phys. Chem. C, 2014, 118, 20784 CAS.
- M. Harb, P. Sautet, E. Nurlaela, P. Raybaud, L. Cavallo, K. Domen, J. M. Basset and K. Takanabe, Phys. Chem. Chem. Phys., 2014, 16, 20548 RSC.
- M. Harb, P. Sautet and P. Raybaud, J. Phys. Chem. C, 2013, 117, 8892 CAS.
- M. Harb, D. Masih, S. Ould-Chikh, P. Sautet, J.-M. Basset and K. Takanabe, J. Phys. Chem. C, 2013, 117, 17477 CAS.
- M. Harb, J. Phys. Chem. C, 2015, 119, 4565 CAS.
- M. Harb, J. Phys. Chem. C, 2013, 117, 25229 CAS.
- M. Harb, P. Sautet and P. Raybaud, J. Phys. Chem. C, 2011, 115, 19394 CAS.
- M. Harb, D. Masih and K. Takanabe, Phys. Chem. Chem. Phys., 2014, 16, 18198 RSC.
- M. Harb, J. Phys. Chem. C, 2013, 117, 12942 CAS.
- M. Gajdoš, K. Hummer, G. Kresse, J. Furthmüller and F. Bechstedt, Phys. Rev. B: Condens. Matter Mater. Phys., 2006, 73, 045112 CrossRef.
- A. Fonari and C. Sutton, http://afonari.com/emc/.
- W. Wei, Y. Dai and B. Huang, J. Phys. Chem. C, 2009, 113, 5658 CAS.
- W. F. Su and Y. T. Lu, Mater. Chem. Phys., 2003, 80, 632 CrossRef CAS.
- Y. Hou, M. Wang, X. H. Xu, D. Wang, H. Wang and S. X. Shang, J. Am. Ceram. Soc., 2002, 85, 3087 CrossRef CAS.
- R. J. Gonzalez, R. Zallen and H. Berger, Phys. Rev. B: Condens. Matter Mater. Phys., 1997, 55, 7014 CrossRef CAS.
- R. G. J. Tauc and A. Vancu, Phys. Status Solidi, 1966, 15, 627 CrossRef.
- A. Kudo and S. Hijii, Chem. Lett., 1999, 1103 CrossRef CAS.
- S. Burnside, J.-E. Moser, K. Brooks, M. Grätzel and D. Cahen, J. Phys. Chem. B, 1999, 103, 9328 CrossRef CAS.
- H. Liu, Y. Chen, G. Tian, Z. Ren, C. Tian and H. Fu, Langmuir, 2015, 31, 5962 CrossRef CAS PubMed.
Footnote |
| † Electronic supplementary information (ESI) available: Supplementary data for absorption and electrochemistry are presented. See DOI: 10.1039/c5tc03134f |
| This journal is © The Royal Society of Chemistry 2015 |

