 Open Access Article
Creative Commons Attribution 3.0 Unported Licence
Magnetic interplay between two different lanthanides in a tris-phthalocyaninato complex: a viable synthetic route and detailed investigation in the bulk and on the surface†
Yanhua
Lan
*a,
Svetlana
Klyatskaya
*a,
Mario
Ruben
ab,
Olaf
Fuhr
ac,
Wolfgang
Wernsdorfer
de,
Andrea
Candini
f,
Valdis
Corradini
f,
Alberto
Lodi Rizzini
g,
Umberto
del Pennino
g,
Filippo
Troiani
f,
Loïc
Joly
b,
David
Klar
h,
Heiko
Wende
h and
Marco
Affronte
fg
aInstitute of Nanotechnology (INT), Karlsruhe Institute of Technology (KIT), 76344 Eggenstein-Leopoldshafen, Germany. E-mail: yanhua.lan@kit.edu; svetlana.klyatskaya@kit.edu
bUniversite de Strasbourg, Institut de Physique et de Chimie des Materiaux de Strasbourg, Campus de Cronenbourg, 23 Rue du Loess, 67034 Strasbourg Cedex 2, France
cKarlsruhe Nano Micro Facility (KNMF), Karlsruhe Institute of Technology (KIT), 76344 Eggenstein-Leopoldshafen, Germany
dUniv. Grenoble Alpes, Inst NEEL, 25 rue des Martyrs, F-38000 Grenoble, France
eCNRS, Inst NEEL, F-38000 Grenoble, France
fCNR Institute of Nanoscience S3, via G. Campi 213A, 41125 Modena, Italy
gUniversità di Modena e Reggio Emilia, Dipartimento di Fisica, Informatica, Matematica, via G. Campi 213A, 41125 Modena, Italy
hFaculty of Physics and Center for Nanointegration Duisburg-Essen (CENIDE), University of Duisburg-Essen, Lotharstraße 1, D-47048 Duisburg, Germany
First published on 20th July 2015
Abstract
Future applications of molecular units in quantum information technologies require a fine control at the single molecule level. This includes the choice of each functional element, the intramolecular interaction and the robustness of molecules when dispersed on a substrate. Keeping these goals in mind, we designed and synthesized a heterometallic phthalocyaninato-complex including two different lanthanides in each moiety, namely [PcDyPcTbPc*] (Pc being phthalocyanines; and Pc* being 2,3,9,10,16,17,23,24-octahexyl-substituted phthalocyanines). Full magnetic characterization was performed down to the mK temperature range on bulk microcrystals by means of AC susceptibility, DC magnetization (including microSQUID) and specific heat measurements. A weak, yet sizeable, interaction between the two lanthanides is clearly detected by different techniques, altering the magnetic behavior of the single lanthanide as observed in the parent [LnPc2] complexes. Isolated [PcDyPcTbPc*] molecules dispersed on HOPG and the Au surface by liquid phase deposition are proven to maintain their main chemical and magnetic features by combined XPS, XAS and XMCD analysis and to lie with one Pc ligand flat to the surface. Opening of a small but sizable hysteresis loop at 1.8 K is directly observed on both Tb and Dy sites proving the retention of magnetization at the single molecule level.
Introduction
Bis-phthalocyanines of lanthanides, LnPc2 complexes, are attracting much interest since they have been shown to be prototypical molecular units for the realization of hybrid nanodevices and surface studies.1 In this simple molecular unit, the lanthanide is sandwiched between two phthalocyanines with a well-defined ligand field that in turn gives rise to axial magnetic anisotropy with a huge energy barrier – in the case of [TbPc2]− as demonstrated in the earlier work of Ishikawa et al.2 In its neutral form [LnPc2]0 one unpaired electron is delocalized in the two Pc ligands. The neutral derivative is robust enough to be sublimed or deposited by liquid phase. It is typically adsorbed laying with the Pc flat on metal surfaces due to van der Waals interactions3,4 or by π–π stacking on the graphitic substrate.5 Scanning tunneling microscopy (STM) studies on [TbPc2] on Au(111) surfaces revealed the Kondo effect mostly localized on the organic ligand,6 while X-ray magnetic dichroism (XMCD) on TbPc2 showed that coupling is possible with magnetic Ni,7a Co7b and Mn7c substrates while preserving the magnetic anisotropy of the single Ln ion. Because of the high anisotropy barrier, one expects to find an opening of the hysteresis loop in magnetization cycles at low temperature, with both quantum tunnelling and relaxation processes related to different features of the single lanthanide, also at a single molecule level as previously observed in Fe4.8 XMCD actually detects the element specific magnetization of individual magnetic centers even when isolated on surfaces, although it turns out that the measurement time is relatively long9 and the open hysteresis loop can only be observed at very low temperature.10 [TbPc2] molecules have also been used to fabricate hybrid spintronic devices such as molecular spin valves with carbon nanotubes11 or graphene12 or single molecule transistors.13 Here single electrons and even nuclear spin states have been addressed. The read out of an individual spin and coherent manipulation has been clearly demonstrated a new method to encode quantum bits with molecular spin.14The next step on this line is the realization of two-qubit gates. To this end, molecules comprising two distinguishable magnetic centers weakly coupled among them have been suggested as possible candidates.15 Two different magnetic centers are required if one wants to address them independently so as to engineer a universal CNOT quantum logic gate. Recently compound [CeEr] prepared by Aromí and co-workers16 is deemed to meet the qugate requirements, in which both ions have a doubly degenerate magnetic ground state and can be addressed individually. Their isotopes have mainly zero nuclear spin, which enhances the electronic spin coherence. So far there are several reports concerning the preparation of heterodinuclear lanthanide complexes.17 Of them, two examples17a,b are related to complexes of phthalocyanines or its substituted derivatives. The synthesis and the magnetic properties of homometallic dinuclear [PcLnPcLnPc] complexes have been reported by Ishikawa18 first, and then by Yamashita and co-workers,19 along with preliminary XMCD studies on homometallic [PcLnPcLnPc] on the surface;20 however, the physical properties of heterometallic complexes of this class towards its deposition onto substrates have not been reported yet. With the aim to realize molecular spintronic devices with two-qubit gates, we have designed and synthesized an asymmetric heterometallic phthalocyaninato-Dy(III)–Tb(III) complex with one of the Pc rings decorated with flexible long hydrocarbon chains.
By exploiting a divergent stepwise protocol, we report here the synthesis, single crystal structure and detailed magnetic studies on [PcLn1PcLn2Pc*] with Ln1 ≠ Ln2 (1) and Ln1 = Ln2 (2). We start presenting thermodynamic properties measured on bulk micro-crystals by AC susceptibility and DC magnetization microSQUID and heat capacity to demonstrate that a weak ferromagnetic coupling is established when Ln1 = Tb and Ln2 = Dy. Secondly, we report X-ray photoelectron spectroscopy (XPS), X-ray absorption spectroscopy (XAS) and XMCD measurements of [PcDyPcTbPc*] molecules, hereafter named [Dy,Tb], dispersed on Au(111) and HOPG surfaces to prove the robustness of this molecule and to show the opening of a hysteresis loop at 1.8 K. The results demonstrate that the main magnetic features of the molecule are preserved also when they are dispersed on the substrate.
Experimental
Synthesis
The complexes PcLn1PcLn2Pc* (Scheme 1) were synthesized in a divergent stepwise protocol. First, the reaction of 1,2-dicyano-4,5-di(hexyl)benzene (3) with lithium in dry methanol led to the di-lithium salt of the Pc ligand with 2,3,9,10,16,17,23,24-octahexyl substituents, Pc* (4). In the presence of Ln(acac)3, the reaction mixture was worked up by the in situ fusing with excess of [Ln1Pc2] (5 or 6) affording the targeted crude product. Pure complex 1 as a dark green solid was separated from the crude mixture by column chromatography (basic alumina oxide) with an eluent of CH2Cl2/MeOH (10![[thin space (1/6-em)]](https://www.rsc.org/images/entities/char_2009.gif) :
:![[thin space (1/6-em)]](https://www.rsc.org/images/entities/char_2009.gif) 1). The complexes (1) and (2) are composed of three Pc2− ligands and two Ln3+ ions, resulting in a neutral complex with a closed shell π-electron system. 1% of (1) diluted sample was prepared by mixing 1 and 2 in a ratio of 1
1). The complexes (1) and (2) are composed of three Pc2− ligands and two Ln3+ ions, resulting in a neutral complex with a closed shell π-electron system. 1% of (1) diluted sample was prepared by mixing 1 and 2 in a ratio of 1![[thin space (1/6-em)]](https://www.rsc.org/images/entities/char_2009.gif) :
:![[thin space (1/6-em)]](https://www.rsc.org/images/entities/char_2009.gif) 100 in CH2Cl2. With slow evaporation of the resulting solution, dark green needles were grown for micro-SQUID measurements. Single crystals of 1 suitable for X-ray diffraction analysis were obtained by slow diffusion of EtOH into a solution of complex (1) in hexane as fine dark green needles. In order to steer a preferential absorption side of the heteronuclear complex, only one of the Pc-rings, Pc*, is decorated with flexible long hydrocarbon chains. Further details on synthesis and chemical characterization are reported in the ESI.†
100 in CH2Cl2. With slow evaporation of the resulting solution, dark green needles were grown for micro-SQUID measurements. Single crystals of 1 suitable for X-ray diffraction analysis were obtained by slow diffusion of EtOH into a solution of complex (1) in hexane as fine dark green needles. In order to steer a preferential absorption side of the heteronuclear complex, only one of the Pc-rings, Pc*, is decorated with flexible long hydrocarbon chains. Further details on synthesis and chemical characterization are reported in the ESI.†
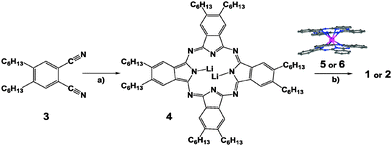 | ||
| Scheme 1 Synthesis of [Pc–Ln1–Pc–Ln2–Pc*] complexes, Ln1 = Dy, Ln2 = Tb (1) Ln1 = Ln2 = Y (2), (a) Li/MeOH; (b) Ln(acac)3; [Ln1Pc2]0 (5 – Ln = Tb, 6 – Ln = Y); 1-chloconaphthalene, reflux. | ||
Physical characterization
The dichroic XMCD signal (expressed in %) is evaluated by taking the difference between the two XAS spectra obtained with different X-ray circular polarizations (σ↑↓–σ↑↑) and dividing by the height of the average of the two polarizations (edge jump). Hence, the XMCD value expressed in percentage (%) does not depend on the amount of the material analyzed and thus the signal of the ML can be directly compared with that obtained on the thick films, whilst the quantification of the dichroic signal in terms of absolute magnetic moments is less straightforward. According to that reported in the literature for Tb3+ and Dy3+ ions, we simply assume here that the area of the XMCD curve is proportional to the magnetization. We also checked that the shape of the dichroic signal does not change with the magnetic field, therefore the height of the M5 peak can be considered proportional to the area of the dichroic signal. We can therefore obtain fast detection of the dichroic signal by simply measuring the edge (E) and pre-edge (P) intensities, when the magnetic field is swept under isothermal conditions:
| [(Eσ↑↓ – Pσ↑↓) − (Eσ↑↑–Pσ↑↑)]/1/2[(Eσ↑↓–Pσ↑↓) + (Eσ↑↑–Pσ↑↑)] |
Results and discussion
Structural description
Complex (1) crystallizes in the monoclinic space group P21/c with four molecules per unit cell (Table S1, ESI†). The terbium and dysprosium ions occupy central positions in the complex and are eightfold coordinated by the isoindole nitrogen atoms (Niso) of the phthalocyanine ligands: Tb–N2, N4, N6, N8 (Pc* in gray) and N10, N12, N14, N16 (Pc in orange); Dy–N10, N12, N14, N16 (Pc in orange) and N18, N20, N22, N24 (Pc in red). Both outer Pc and Pc* ligands of 1 are equally distorted from planarity and, therefore, adopt a biconcave shape. The central terbium ion lies 1.782 Å from the Niso mean plane of the Pc ligand and 1.262 Å from the Niso mean plane of the Pc* ligand bearing peripheral substituents, whereas dysprosium ion lies 1.262 Å from the Niso mean plane of the outer Pc ligand (in red, Fig. 1) and 1.727 Å from the Niso mean plane of the middle Pc ligand (in orange, Fig. 1). The calculated distances between the three Niso mean planes are 2.984 and 3.150 Å respectively. The intramolecular distance between Dy and Tb ions in the same unit cell is 3.508 Å, which is slightly smaller than for the homo-nuclear [PcLnPcLnPc] complex (3.52 Å).18a The twist angles between the outer rings Pc/Pc* and the center Pc ring were determined to be 46.4° and 32.2° respectively, (Fig. S3a, ESI†), causing a pseudo fourfold axis (the direction of the uniaxial magnetic anisotropy) perpendicular to the Pc rings.Complex (1) crystallizes with molecules of hexane in the crystal lattice. The shortest intermolecular Dy–Tb distance along the a axis was determined to be 14.40 Å, while being 17.95 Å within two neighboring columns, Fig. S2 (ESI†). Each molecule of (1) is rather well separated from the neighboring molecule due to the n-hexyl chains with all Dy–Tb-axes pointing collinearly. The sizes of (1) were estimated to be ∼15 Å (non-substituted Pc) and 27 Å (the Pc-ring with hexyl chains), on the basis of the distance between two hydrogen atoms of n-hexyl chains at both ends and between the hydrogen atoms of the upper non-substituted Pc rings, respectively. The height of ∼7 Å is determined as the distance between overlapping hydrogen atoms at meta-positions of upper and lower rings (Fig. S3b, ESI†). In the crystal structure, (1) is arranged in columns along the a axis in a π–π stack arrangement (3.54 Å, Fig. S2, ESI†).
Magnetic susceptibility
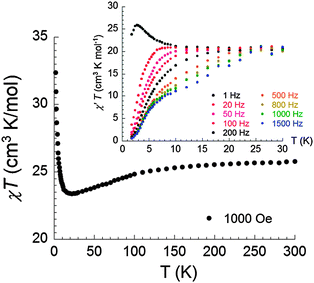
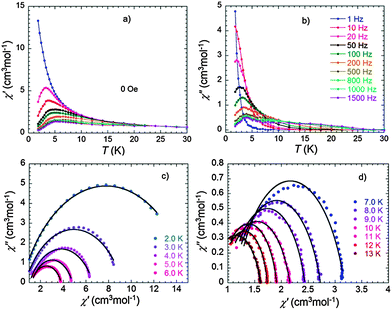
The static magnetic susceptibility of (1) was measured on a polycrystalline sample in the temperature range 1.8–300 K in an applied magnetic field of 1000 Oe. The χT value of 25.77 cm3 K mol−1 at 300 K is very close to the expected value of 25.99 cm3 K mol−1 for the system containing one isolated Dy3+ (J = 15/2, g = 4/3, 6H15/2, C = 14.17 cm3 K mol−1) and one Tb3+ ion (J = 6, g = 3/2, 7F6, C = 11.82 cm3 K mol−1) (Fig. 2). Upon cooling, the χT product slightly decreases to reach a minimum value of 23.38 cm3 K mol−1 at 22 K as a consequence of thermal depopulation of the Stark sublevels of the anisotropic Ln3+ ions. Below 22 K, the χT product sharply increases to reach 32.37 cm3 K mol−1 at 1.8 K, indicative of ferromagnetic coupling between Dy3+ and Tb3+ ions. The presence of ferromagnetic interactions between the two Ln3+ ions is also evident in the in-phase AC magnetic susceptibility at low frequency (Fig. 2 inset). This observation is consistent with the results reported for the homometallic dinuclear Tb-phthalocyaninato-complexes.19The dynamic properties of (1) were also investigated using temperature and frequency dependent AC susceptibility measurements. The strong frequency dependence of both in-phase and out-of-phase components observed in zero DC field below 30 K manifests slow magnetization dynamics (Fig. 3a and b). Taking the maximum of the χ′′(T) curve as a criterion to characterize the relaxation, the blocking temperature at 1000 Hz is detected at 3.9 K. Besides the well-defined maxima in the out-of-phase components in the low temperature range, a broad maximum can also be observed when the frequency was increased up to 800 Hz at higher temperature (Fig. S4a, ESI†).
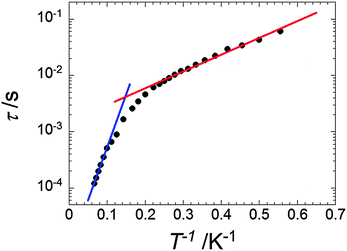
The relaxation time (τ) against 1/T was extracted from the frequency sweeping AC data between 1.8 and 15 K and is plotted in Fig. 4 and Fig. S7 (ESI†). The nonlinear relaxation plot suggests the presence of multiple relaxation pathways. Data analysis24 revealed that the thermal variation of τ can be approximated by two exponential laws, characteristics of thermally activated regimes, with ΔE1 = 6.9 K and τ1 = 1.5 × 10⁻³ s in the temperature range of 1.8–5.0 K and ΔE2 = 43.2 K and τ2 = 6.9 × 10⁻⁶ s between 10 and 15 K. Two activated regimes have also been observed in the case of homometallic [PcTbPcTbPc] complexes.19
For both [TbPc2] and [DyPc2] complexes only one relaxation time is observed with one characteristic activation energy and saturation at low temperature due to the presence of quantum tunneling. The observation of the thermally activated regime with a low energy barrier (ΔE1 = 6.9 K) denotes the partial suppression of quantum tunneling – with respect to the single [LnPc2] complexes (see below) and the presence of low energy barrier that, interestingly, is comparable to the splitting of the Ising doublet due to the intramolecular interaction.
To see if it is possible to further characterize these relaxation processes, an Argand plot of the in-phase versus out-of-phase susceptibilities was constructed. If only one single relaxation process is active, the plot would have a semicircular shape with a vanishing α value. Fitting the data using a generalized Debye model leads instead to a α value of 0.26–0.30 between 2 and 5 K (Fig. 3c and Table S2, ESI†) and 0.13–0.24 above 10 K (Fig. 3d and Table S2, ESI†), suggesting that relaxation mechanism operating in the two temperature regimes is more complex than single activated processes.
Low temperature magnetization
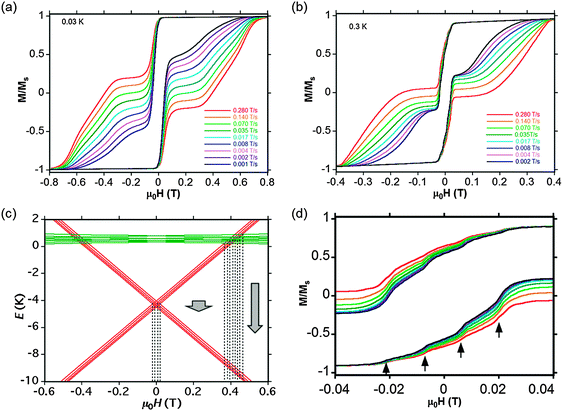
Isothermal magnetization was measured at very low temperature on small crystals of both (1) and 1% of (1) diluted in [Y,Y] (2) by micro-SQUID as a function of magnetic field applied along the principal anisotropy axis. Opening of hysteresis loops is evident due to blocking of magnetization at the typical sweeping rates used in these experiments (Fig. 5a and b and Fig. S9, ESI†). The general behavior of (1) is similar to those reported for homometallic [PcLnPcLnPc] complexes.18,19 The intramolecular interactions between Dy3+ and Tb3+ have some clear influence on the step height and width of the hysteresis loops. For comparison, the behavior (i.e. the sum of the two contributions) of isolated [TcPc2] and [DyPc2] complexes is also reported in Fig. S10 (ESI†), showing clear differences.An approximate Zeeman diagram of the ground states of [Dy,Tb] (1) is calculated25 (Fig. 5c) based on the energy splitting of 4.8 K obtained from point-dipole calculations (see below). The red levels correspond to the ferromagnetic state, with Tb and Dy pointing in the same direction, whereas the green levels correspond to the antiferromagnetic alignment. The dotted lines represent the tunnel transitions at avoided level crossings and the big arrows correspond to direct relaxation between energy levels, which becomes faster and faster at higher fields. The nuclear spin of Dy is neglected for clarity, because the hyperfine coupling of Dy is much smaller than that of Tb and some isotopes of Dy have no nuclear spin.
The Zeeman diagram reveals that the large step at zero field corresponds to a co-tunneling process where both Tb and Dy flip their magnetic moments. Four steps are visible at this low field transition (Fig. 5d), which are due to the four nuclear spin states of the Tb ion. Such “hyperfine steps” were also observed for the [TbPc2] complexes (Fig. S11b, ESI†).2b However, because of intramolecular coupling of Tb–Dy, the field separation between these steps are about two times smaller than for the [TbPc2] complexes.
The crossing between the ferromagnetic ground state and the antiferromagnetic excited state induces a fast relaxation at about 0.4 T (Fig. 5c), which is confirmed by the hysteresis loops of the 100% sample, showing clearly the step at about the same field (Fig. 5a). This is not seen in the diluted sample because the direct relaxation processes are enhanced by small disorder, reversing all spins before reaching 0.4 T (Fig. 5d).
Specific heat
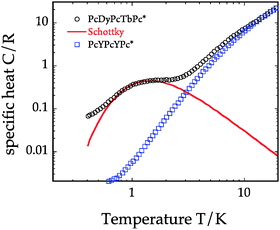
In order to get quantitative evaluation on the strength of the coupling we have measured specific heat at low temperature. The specific heat of non-magnetic [Y,Y] (2) can be taken as reference since it shows only pure lattice contribution down to the lowest temperatures (Fig. 6). An anomaly with a maximum around 1.2 K is well visible for [Dy,Tb] (1) instead. This shifts with the magnetic field (Fig. S12, ESI†). A fit with a simple two-level Schottky C(T) gives an effective energy gap of 3.8 K. In the point-dipole approximation, an energy splitting of ≈4.8 K can be estimated between two configurations of the two Ising spins of Dy and Tb separated by 3.5 Å. The agreement between the two values is reasonably good taking into account that we neglect the degeneracy of the levels. Heat capacity measurements on 10% [Dy,Tb] (1) diluted in the non-magnetic [Y,Y] (2) sample (Fig. S13, ESI†) shows a small, but sizable Schottky anomaly with maximum at essentially the same position (1.2 K) as in the case of the non-diluted (1) derivative, indicating that intermolecular interactions are not particularly relevant here. DFT calculations3 suggest that through-bond exchange interaction may well occur in Ln-phthalocyaninato-complexes. Yet, in this case the neutral molecule (1) has no electrons delocalized over the Pc planes and this pathway is also expected to give small contribution. Thus, we conclude that dipolar Dy–Tb intramolecular interaction is the dominant coupling mechanism.Molecules on the surface
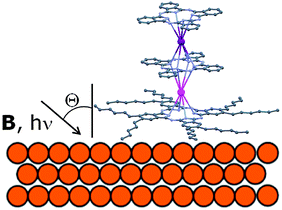
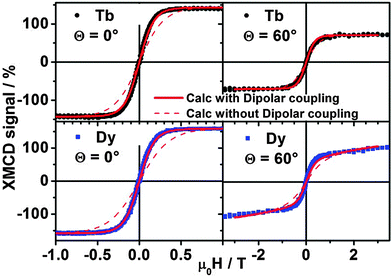
While (micro-)SQUID measurements detect the magnetization of the whole molecule, XMCD measurements are element-sensitive and allow one to discern the magnetization of the different lanthanides. X-ray absorption and magnetic dichroism have been measured on [Dy,Tb] (1) molecules dispersed on HOPG and Au surfaces. Preliminary XPS analysis (Fig. S15, ESI†) demonstrated that molecules are intact after the deposition by liquid phase and the chemical stoichiometry is preserved as reported in Table S3 (ESI†). STM images (Fig. S14b, ESI†) show isolated spots with a size consistent with what determined by X-ray diffraction indicating that the molecules do not aggregate. Note that in such a situation intermolecular interaction can be neglected, while the interaction with different substrates can be significant and needs to be checked. Thus, to further test the integrity of the lanthanide core of the molecule, we compared the Tb-M4,5 and Dy-M4,5 XAS collected on the MLs on Au(111) and on HOPG with the corresponding spectra obtained on the thick films and on the powder (Fig. S16, ESI†). The XAS and XMCD spectra of the powder perfectly match those obtained on the thick films (Fig. S16a, ESI†). This confirms that the (1) core is stable in solution. Secondly, the XAS/XMCD spectra of the ML on gold perfectly match those obtained on MLs on HOPG (Fig. S17, ESI†) for both normal and grazing incidence (θ = 0° and θ = 60°). This shows that the interaction with the gold surface does not affect the valence electronic structure of the core (i.e. Tb and Dy ions remain trivalent). The different intensities of the XMCD signals at 0° and 60° (Fig. S17, ESI†) indicate a strong magnetic anisotropy of the molecules, consistently with the fact that they are flat on the surface, with the Pc plane parallel to the substrate, as actually depicted in Scheme 2. This point is further confirmed by X-ray linear dichroism (XLD) at the Tb M5, Dy M5, and N K edges at θ = 60° (Fig. S18, ESI†).The magnetization loop was derived by measuring the XMCD signal as a function of an applied magnetic field at the Tb and Dy M5 edges for the ML on HOPG (Fig. 7), the ML on gold (Fig. S19, ESI†) and a thick film of derivative (1) (Fig. S20, ESI†). Two different angles are compared: normal incidence (θ = 0°) and grazing incidence (θ = 60°). To evidence the effect of intramolecular Dy–Tb interaction, we evaluated the magnetization of the single ion with the crystal field parameters reported in ref. 18. For comparison we also plotted in Fig. 7 the estimated value of magnetization in the presence of dipolar Dy–Tb interaction, using the Dy–Tb distance value as estimated by X-ray diffraction. The effect of dipolar interaction is small but quite visible. The agreement between the experimental data and the calculated magnetization is remarkable, which confirms that through-space (dipolar) intramolecular interaction is active and that the crystal field parameters are close to those deduced for bulk samples.
In Fig. 8 we plot a zoom of magnetization curves reported in Fig. 7 in a smaller magnetic field range. Sizable opening of hysteresis is visible at both Dy and Tb sites for θ = 0°, although the coercive fields are smaller than what observed in micro-SQUID measurements. That is due in part to the higher temperature and also to the slower sweeping rate in XMCD experiments (minutes for one cycle). Note that the small but finite opening of the hysteresis is visible for θ = 0 for 1 deposited on HOPG but it is vanishingly small for θ = 60° and for MLs of 1 deposited on Au(111) (data reported in Fig. S19, ESI†) and for a TF (Fig. S20, ESI†). The vanishingly small hysteresis observed in 1 on HOPG at θ = 60° and TF (Fig. S20, ESI†) is not surprising due to the presence of a transverse field. In the case of 1 on gold (Fig. S19, ESI†) it is clear that interaction with the metal surface affects somehow the magnetic properties of 1. Thus, we conclude that the magnetic anisotropy of both Dy and Tb is essentially preserved when isolated molecular units are deposited on HOPG while some change can occur when 1 is deposited on gold. It is worth stressing however that it is the first time – to our knowledge – that memory effects are independently observed on two distinct magnetic centers in the same molecular units on the timescale of experiments at synchrotron radiation facility (minutes).
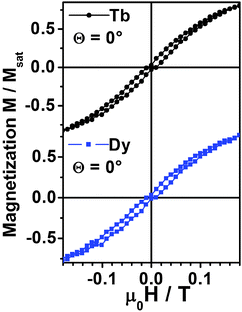 | ||
| Fig. 8 XMCD signal of complex (1) measured at the Tb and Dy M5 edges respectively at 1.8 K as a function of applied magnetic field. This zoom of Fig. 7 evidences the opening of hysteresis loops in the M(H) cycle. | ||
Conclusions
By using a stepwise synthesis, we were able to obtain a heterometallic [Dy,Tb] complex (1) and determine its molecular structure by single crystal X-ray diffraction. The control of the nature of each moiety opens up the possibility to distinguish lanthanides with different magnetic features in the same molecular units. The weak but finite ferromagnetic coupling between the two magnetic centers affects the magnetic properties of this derivative. To show this, we performed a systematic study of DC magnetization, AC susceptibility and specific heat at low temperature in microcrystalline bulk samples. Data analysis shows the presence of two thermally activated regimes and quantum tunneling particularly active at very low temperatures. Due to the intramolecular interaction, mostly of dipolar origin, the low temperature magnetization dynamics is affected by a co-tunneling process.Complex (1) is soluble in solution and we deposited it on HOPG and Au surfaces in order to study how the magnetic features are preserved when molecules are dispersed on the surface. XAS and XMCD experiments, performed at low temperatures, show that these molecules preserve their stoichiometry and the magnetic coupling between the two Ln3+ is still active within isolated molecular units. Opening of a small but sizable hysteresis loop was detected at 1.8 K on isolated molecules dispersed on HOPG. This is a remarkable result since, except for the case of Fe48 and LnPc2 on HOPG,10 few experiments have been reported so far to directly prove the retention of magnetization in isolated molecular objects. We believe that these results may contribute to define strategies to process quantum information at the single molecule level.14
Acknowledgements
This work has been partially supported by the EU by the FP7 FET-Proactive project MoQuaS No. 610449, the SFB TR 88 “3MET” and the Agence Nationale de la Recherche project MolQuSpin, No. ANR-13-BS10. We acknowledge PSI for provision of synchrotron facility and Armin Kleibert for technical assistance. We also thank Prof. Annie K. Powell and Dr Valeriu Mereacre for the allocation of technical equipment.Notes and references
- Y. Lan, S. Klyatskaya and M. Ruben, in Lanthanides and Actinides in Molecular Magnetism, “Bis-Phthalocyaninato Lanthanide(III) Complexes – From Molecular Magnetism to Spintronic Devices”, ed. R. Layfield and M. Murugesu, Wiley-VCH, Weinheim, 2015 Search PubMed.
- (a) N. Ishikawa, M. Sugita, T. Okubo, N. Tanaka, T. Iino and Y. Kaizu, Inorg. Chem., 2003, 42, 2440–2446 CrossRef CAS PubMed; (b) N. Ishikawa, M. Sugita and W. Wernsdorfer, Angew. Chem., Int. Ed., 2005, 44, 2931–2935 CrossRef CAS PubMed; (c) F. Branzoli, P. Carretta, M. Filibian, G. Zoppellaro, M. J. Graf, J. R. Galan-Mascaros, O. Fuhr, S. Brink and M. Ruben, J. Am. Chem. Soc., 2009, 131, 4387–4396 CrossRef CAS PubMed.
- L. Vitali, S. Fabris, A. M. Conte, S. Brink, M. Ruben, S. Baroni and K. Kern, Nano Lett., 2008, 8, 3364–3368 CrossRef CAS PubMed.
- T. Komeda, H. Isshiki, J. Liu, K. Katoh, M. Shirakata, B. K. Breedlove and M. Yamashita, ACS Nano, 2013, 7, 1092–1099 CrossRef CAS PubMed.
- (a) M. Gonidec, R. Biagi, V. Corradini, F. Moro, V. De Renzi, U. del Pennino, D. Summa, L. Muccioli, C. Zannoni, D. B. Amabilino and J. Veciana, J. Am. Chem. Soc., 2011, 133, 6603–6612 CrossRef CAS PubMed; (b) R. Biagi, J. Fernandez-Rodriguez, M. Gonidec, A. Mirone, V. Corradini, F. Moro, V. De Renzi, U. del Pennino, J. C. Cezar, D. B. Amabilino and J. Veciana, Phys. Rev. B: Condens. Matter Mater. Phys., 2010, 82, 224406 CrossRef.
- T. Komeda, H. Isshiki, J. Liu, Y.-F. Zhang, N. Lorente, K. Katoh, B. K. Breedlove and M. Yamashita, Nat. Commun., 2011, 2, 217 CrossRef PubMed.
- (a) A. Lodi Rizzini, C. Krull, T. Balashov, J. J. Kavich, A. Mugarza, P. S. Miedema, P. K. Thakur, V. Sessi, S. Klyatskaya, M. Ruben, S. Stepanow and P. Gambardella, Phys. Rev. Lett., 2011, 107, 177205 CrossRef CAS; (b) D. Klar, S. Klyatskaya, A. Candini, B. Krumme, K. Kummer, P. Ohresser, V. Corradini, V. de Renzi, R. Biagi, L. Joly, J.-P. Kappler, U. Del Pennino, M. Affronte, H. Wende and M. Ruben, Beilstein J. Nanotechnol., 2013, 4, 320–324 CrossRef PubMed; (c) A. Lodi Rizzini, C. Krull, T. Balashov, A. Mugarza, C. Nistor, F. Yakhou, V. Sessi, S. Klyatskaya, M. Ruben, S. Stepanow and P. Gambardella, Nano Lett., 2012, 12, 5703–5707 CrossRef CAS PubMed.
- (a) M. Mannini, F. Pineider, C. Danieli, F. Totti, L. Sorace, Ph. Sainctavit, M.-A. Arrio, E. Otero, L. Joly, J.-C. Cezar, A. Cornia and R. Sessoli, Nature, 2010, 468, 417–421 CrossRef CAS PubMed; (b) L. Malavolti, V. Lanzilotto, S. Ninova, L. Poggini, L. Cimatti, B. Cortigiani, L. Margheriti, D. Chiappe, E. Otero, P. Sainctavit, F. Totti, A. Cornia, M. Mannini and R. Sessoli, Nano Lett., 2015, 15, 535–541 CrossRef CAS PubMed.
- S. Stepanow, J. Honolka, P. Gambardella, L. Vitali, N. Abdurakhmanova, T.-C. Tseng, S. Rauschenbach, S. Tait, L. V. Sessi, S. Klyatskaya, M. Ruben and K. Kern, J. Am. Chem. Soc., 2010, 132, 11900–11901 CrossRef CAS PubMed.
- D. Klar, A. Candini, L. Joly, S. Klyatskaya, B. Krumme, P. Ohresser, J. P. Kappler, M. Ruben and H. Wende, Dalton Trans., 2014, 43, 10686–10689 RSC.
- M. Urdampilleta, S. Klyatskaya, J.-P. Cleuziou, M. Ruben and W. Wernsdorfer, Nat. Mater., 2011, 10, 502–506 CrossRef CAS PubMed.
- A. Candini, S. Klyatskaya, M. Ruben, W. Wernsdorfer and M. Affronte, Nano Lett., 2011, 11, 2634–2639 CrossRef CAS PubMed.
- R. Vincent, S. Klyatskaya, M. Ruben, W. Wernsdorfer and F. Balestro, Nature, 2012, 488, 357–360 CrossRef CAS PubMed.
- S. Thiele, F. Balestro, R. Ballou, S. Klyatskaya, M. Ruben and W. Wernsdorfer, Science, 2014, 344, 1135–1138 CrossRef CAS PubMed.
- G. Aromì, D. Aguila, P. Gamez, F. Luis and O. Roubeau, Chem. Soc. Rev., 2012, 41, 537–546 RSC.
- D. Aguilà, L. A. Barrios, V. Velasco, O. Roubeau, A. Repollés, P. J. Alonso, J. Sesé, S. J. Teat, F. Luis and G. Aromí, J. Am. Chem. Soc., 2014, 136, 14215–14222 CrossRef PubMed.
- (a) K. Katoh, R. Asano, A. Miura, Y. Horii, T. Morita, B. K. Breedlove and M. Yamashita, Dalton Trans., 2014, 43, 7716–7725 RSC; (b) P. Zhu, N. Pan, R. Li, J. Dou, Y. Zhang, D. Y. Y. Cheng, D. Wang, D. K. P. Ng and J. Jiang, Chem. – Eur. J., 2005, 11, 1425–1432 CrossRef CAS PubMed; (c) J.-P. Costes and F. Nicodème, Chem. – Eur. J., 2002, 8, 3442–3447 CrossRef CAS; (d) R. Sato, K. Suzuki, M. Sugawa and N. Mizuno, Chem. – Eur. J., 2013, 19, 12982–12990 CrossRef CAS PubMed.
- (a) N. Ishikawa, T. Iino and Y. Kaizu, J. Phys. Chem. A, 2002, 106, 9543–9550 CrossRef CAS; (b) N. Ishikawa, T. Iino and Y. Kaizu, J. Am. Chem. Soc., 2002, 124, 11440–11447 CrossRef CAS PubMed; (c) N. Ishikawa, S. Otsuka and Y. Kaizu, Angew. Chem., Int. Ed., 2005, 44, 731–733 CrossRef CAS PubMed.
- (a) K. Katoh, T. Kajiwara, N. Nakano, Y. Nakazawa, W. Wernsdorfer, N. Ishikawa, B. K. Breedlove and M. Yamashita, Chem. – Eur. J., 2011, 17, 117–122 CrossRef CAS PubMed; (b) K. Katoh, H. Isshiki, T. Komeda and M. Yamashita, Coord. Chem. Rev., 2011, 255, 2124–2148 CrossRef CAS PubMed; (c) K. Katoh, Y. Horii, N. Yasuda, W. Wernsdorfer, K. Toriumi, B. K. Breedlove and M. Yamashita, Dalton Trans., 2012, 41, 13582–13600 RSC.
- A. Lodi Rizzini, C. Krull, A. Mugarza, T. Balashov, C. Nistor, R. Piquerel, S. Klyatskaya, M. Ruben, P. M. Sheverdyaeva, P. Moras, C. Carbone, C. Stamm, P. S. Miedema, P. K. Thakur, V. Sessi, M. Soares, F. Yakhou-Harris, J. C. Cezar, S. Stepanow and P. Gambardella, Surf. Sci., 2014, 630, 361–374 CrossRef CAS PubMed.
- W. Wernsdorfer, Adv. Chem. Phys., 2001, 118, 99–190 CrossRef CAS PubMed.
- Handbook of X-ray Photoelectron Spectroscopy, Perkin-Elemer Corporation, 1979 Search PubMed.
- I. Letard, P. Sainctavit, J.-P. Kappler, P. Ghigna, D. Gatteschi and B. Doddi, J. Appl. Phys., 2007, 101, 113920 CrossRef PubMed.
- R. J. Glauber, J. Math. Phys., 1963, 4, 294–307 CrossRef PubMed.
- M. Urdampilleta, S. Klayatskaya, M. Ruben and W. Wernsdorfer, ACS Nano, 2015, 9, 4458–4464 CrossRef CAS PubMed.
Footnote |
| † Electronic supplementary information (ESI) available: Full experimental details, crystallographic data, magnetic data, low temperature magnetization measurements, heat capacity measurements, and further spectroscopic data and analysis. CCDC 1054639 (1). For ESI and crystallographic data in CIF or other electronic format see DOI: 10.1039/c5tc02011e |
| This journal is © The Royal Society of Chemistry 2015 |

