 Open Access Article
Creative Commons Attribution 3.0 Unported Licence
Liposome-induced exfoliation of graphite to few-layer graphene dispersion with antibacterial activity†
R.
Zappacosta
a,
M.
Di Giulio
a,
V.
Ettorre
a,
D.
Bosco
b,
C.
Hadad
c,
G.
Siani
a,
S.
Di Bartolomeo
a,
A.
Cataldi
a,
L.
Cellini
*a and
A.
Fontana
*a
aDipartimento di Farmacia, Università ‘G. d'Annunzio’, Via dei Vestini, 66100 Chieti, Italy. E-mail: l.cellini@unich.it; fontana@unich.it
bIstituto di Genetica Molecolare, CNR unità di Chieti, I-66100 Chieti, Italy
cCenter of Excellence for Nanostructured Materials (CENMAT), INSTM, Unit of Trieste, Dipartimento di Scienze Chimiche e Farmaceutiche, Università di Trieste, Via L Giorgieri 1, I-34127 Trieste, Italy
First published on 8th July 2015
Abstract
Few-layer graphene aqueous dispersions are obtained by exploiting liposomes as effective exfoliating agents for graphite. Raman measurements evidence the presence of non-oxidized double layer graphene as well as amphiphilic phospholipid molecules organized in bilayers in the samples. TEM analyses confirmed that the obtained homogeneous graphene nanosheets are embedded in the liposomal bilayer. The as-prepared graphene aqueous dispersion is stable for days and demonstrates significant antibacterial activity against both Gram-positive (Staphylococcus aureus) and Gram-negative (Escherichia coli) strains, with a reduction in the growth of S. aureus and E. coli as high as 60 and 78%, respectively.
Introduction
In recent years a growing interest within the scientific community has been devoted to the study of carbon allotropes and their applications. Among them, graphene and its derivatives, due to their unique physicochemical properties, have aroused interest1–3 in many research fields. As a matter of fact, applications in electronic4–7 and photonic devices,8–10 clean energy,1,11,12 energy storage13 and sensors14,15 have been well demonstrated. In addition, graphene-based materials appear as promising scaffolds in biomedicine.1–3,16–18For application in biomedicine, one of the most important and fundamental goal to be achieved is to make graphene soluble in water. Up to now, most of the research on graphene in the biomedical field has been focused on the production and characterization of hydrophilic graphene oxide (GO), i.e. graphene functionalized with hydroxyl, epoxy and carboxyl groups that render graphene suitable to interface with biological systems. As a matter of fact, the functionalization renders GO-based materials chemically versatile templates with high surface-to-volume ratios and favours the realization of GO-based drug delivery vehicles,19–21 biosensors,22–26 imaging agents19,27 and electromechanical devices for monitoring cellular responses.28
Besides GO demonstrates good biocompatibility with animal cells,29 while stimulating human mesenchymal stem cells to differentiate into osteoblasts,30–32 adipocytes30 and myoblasts,33,34 inducing the differentiation of preosteoblasts into osteoblasts,35,36 neuronal stem cells into neurons37 and pluripotent stem cells into endodermal lineage.38 For this reason GO-based materials have been studied for tissue- and osteo-regeneration.39–41 GO demonstrated to exhibit strong antibacterial activity towards both Gram-positive and Gram-negative bacteria.42,43
Functionalization of graphene to obtain GO has revealed undisputed advantages, but it involves the breakdown of the continuous honeycomb backbone of pristine (non-functionalized) graphene compromising several of the peculiar properties of the original material.
In order to preserve the structural integrity of graphene and use an absolutely green process of exfoliation and functionalization, inspired by Samori et al.44 who demonstrated the excellent ability of fatty acids to exfoliate graphite in organic solvents and Titov's molecular dynamics simulation45 who showed the theoretical insertion of a “graphene sheet in the hydrophobic interior of biological membranes”, in the present study, we proceeded to obtain nanosheets of graphene sandwiched between phospholipid alkyl chains by simply sonicating graphite in liposomal suspensions. The as-prepared aqueous dispersions demonstrate to solubilize as much as 161 μg mL−1 few-layer graphene in line with dispersions obtained with the use of classical surfactants such as sodium cholate but three times more concentrated than dispersions obtained with sodium dodecylbenzene sulfonate.46 The advantage of the present dispersions is that the flakes are relatively small i.e. (in the nanometric range) and ready to be used for different biomedical applications.
Considering that (i) resistance to antibiotics represents the major cause of treatment failure in bacterial infections, (ii) alternative proposals are needed due to overuse or misuse of common antimicrobials that compromises the therapeutic effect of traditional treatments47 and (iii) the proved antibacterial activity of the covalently functionalized oxidized analogue GO, we propose the as-prepared liposomal graphene-loaded aqueous dispersion as an innovative efficacious antibacterial system to overcome the alarming bacterial resistance increase.48,49 Therefore, in the present study, the antibacterial activity of the as-prepared non-covalently functionalized graphene aqueous dispersion against a Gram-positive (Staphylococcus aureus) and a Gram-negative (Escherichia coli) strain is evaluated and compared with that of the GO analogue.
Results and discussion
Graphene (G) dispersion inside liposomal bilayers in aqueous solution
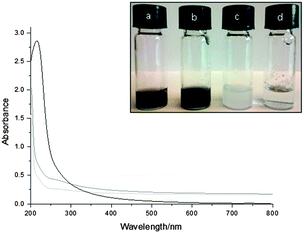
Homogeneous aqueous suspensions of graphene-loaded liposomes (LIPO-G) were prepared by sonication of graphite in the presence of liposomes. The exfoliation was monitored by UV-Vis absorption spectroscopy in the 200–800 nm wavelength range. The observed flat and featureless spectrum is typical for the exfoliated graphitic material,50 absorption from liposomes being negligible above 400 nm (see Fig. 1).Such an observation allowed the use of suspension absorbance at 660 nm as a measure of the concentration of exfoliated graphene loaded in the liposomal bilayer. The quantity of graphene was estimated from the absorbance at 660 nm by using the extinction coefficient (ε = 1390 mg−1 mL m−1) previously determined in water.50 With the designed protocol of graphene exfoliation and dispersion inside the liposomal bilayer, a yield of 15.6 ± 1.0% in PBS ([G] = 0.161 ± 0.010 mg mL−1) and 13.2 ± 0.4% in Milli-Q water ([G] = 0.124 ± 0.010 mg mL−1) was obtained. Whereas a graphene entrapment efficiency of 1.9 ± 0.1% of the investigated liposomes (i.e. [weight of G]/[weight of phospholipids]%) could be calculated in PBS.
Dynamic light scattering experiments revealed that the as-prepared LIPO-G had diameters in the 240–310 nm range (i.e. 238 ± 6 nm for samples in PBS and 307 ± 3 nm for samples in Milli-Q water), which is the typical feature of large unilamellar vesicles (LUV). A diameter of 222 ± 7 nm was measured for POPC liposomes without graphene.
The ζ-potential measurements showed that LIPO-G had an average negative ζ-potential of −15.2 ± 0.3 mV. Pure POPC liposomes without graphene had a comparable ζ-potential (−15.4 ± 0.8 mV) whereas the ζ-potential of pristine graphene in water is −21.8 ± 0.05 mV.51,52 All the above evidence pointed to the perfectly sandwiched graphene in the liposomal bilayer.
Stability of graphene-loaded liposomes
Liposome dimensions (and the relevant polydispersity indices)53 were checked over 48 h (see Fig. S1 in the ESI†) and the corresponding dispersions were demonstrated to be relatively stable over time. It is worth noting that polydispersity of the obtained LIPO-G ranged between 0.25 and 0.30, underlying a fairly homogeneous liposomal population once considered that sonication was the only homogenization step performed.53The ζ-potential is often considered a further measure of the colloidal stability of a suspension, in particular, ζ-potential higher than +15 mV or lower than −15 mV are indicative of stable colloidal samples.54 The ζ-potential for the obtained samples ranged between −15.7 and −14.8 mV during 48 h (see Fig. S2 in the ESI†).
In view of potential administration in a biological environment another parameter to consider for materials intended to be used in biological samples is the stability upon dilution. As reported in Fig. S3 in the ESI,† the stability of the diluted samples overwhelmed that of the as-prepared samples either in terms of dimensions or polydispersity index.
Evidence of graphite exfoliation
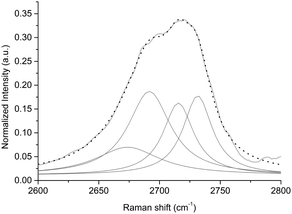
Raman spectroscopy was used to confirm the exfoliation of graphite in few-layer graphene by exploiting POPC phospholipids. The Raman spectra of graphene showed the G peak located at ∼1580 cm−1 and the 2D peak at ∼2700 cm−1 (see Fig. 2). The small D peak located at ∼1350 cm−1 is due to the first-order zone boundary phonons and is indicative of the presence of some defects in the exfoliated graphene (see Fig. 2). It is accepted that Raman spectroscopy could be used to quantify the degree or type of defects of the exfoliated graphene and determine the number of layers by monitoring the shape, width, and position of the 2D peak.55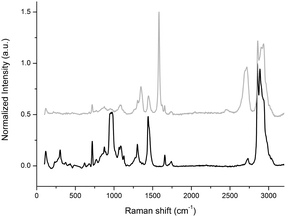 | ||
| Fig. 2 Raman spectra of liposomal suspension (black line) and LIPO-G (grey line). The peak at 1000 cm−1 is due to the silicon wafer. | ||
The Lorentzian fitting of the 2D Raman band allowed us to ascertain that treatment with liposomal suspension caused good exfoliation of graphite into a few-layer graphene.56 As a matter of fact, fitting of 2D peaks recorded over 14 different spots highlighted the presence of double-layer graphene (see Fig. 3 as an example and Fig. S4 and S5 in the ESI†).
Raman spectroscopy is also particularly useful for investigating fluidity and conformational order in a liposomal bilayer57–60 as, in POPC liposomes, the assignment of the peaks is well-established.61–63 According to the literature63,64 Raman intensity ratios I2895/I2855, I2931/I2895 and I1125/I1086 can be considered as good indicators of the molecular order of the lipid bilayer. Indeed, the I1125/I1086 Raman intensity ratio is related to the average number of “trans” bonds in the acyl chain, thus giving a measure of the order in the intra-chain structure. In contrast, the I2895/I2855 Raman intensity ratio, depending on the vibrational coupling between the adjacent POPC alkyl chains, reveals the lateral interactions between lipid chains whereas I2931/I2895 reflects both the inter- and intra-chain order/disorder features.
The inclusion of graphene into the bilayer showed a slight increase of the order of the liposomal system as demonstrated by the increase of both I2931/I2895 (from 0.87 to 0.89) and I2895/I2855 (from 0.84 to 1.05) values. The latter intensity ratio increase was unexpected because interactions with guests penetrating the bilayer is generally associated with a decrease of I2895/I2855.65 Likely, the presence of graphene did not hamper inter-chain interactions and therefore bilayer self-assembly (i.e. the I2931/I2895 ratio did not vary), but favoured additional interactions between alkyl chains of POPC molecules and graphene layers.66,67 Such evidence pointed to the prevailing arrangement of exfoliated graphene inside the core of the bilayer in perfect agreement with coarse-grained dynamic simulations that showed graphene perfectly sandwiched into POPC bilayers and almost not affecting its thickness.45 Graphene bilayers slowly diffused in the membrane interior, but the composite system stayed stable over time. Accordingly, the Raman intensity ratio I1125/I1086 decreased thus denoting a decrease in the average number of “trans” bonds in the alkyl chains of POPC as a consequence of folding of the alkyl chains to promote van der Waals interactions between alkyl chains and the graphene surface.
In order to further confirm the exfoliation degree of graphene, we performed AFM analysis. Fig. 4 reports AFM images of LIPO-G and the corresponding cross-sectional view of samples along the cross line. The samples, prepared by drop-casting a dilute LIPO-G solution onto a silicon wafer, were then dried under vacuum and washed with methanol to get rid of excess liposomes and phospholipids. The cross-sectional AFM view showed that the minimum height of the liposome coated sample is ca. 3–4 nm. Since: (i) the sample is formed of graphene covered with variable amounts of phospholipids and is therefore a difficult sample to be analyzed by AFM due to the dependence of the AFM measurements on the roughness and cleanness of the surface,68 (ii) the thickness of a phospholipid bilayer is around 0.4 nm,69 (iii) stabilizers cannot touch the surface of graphene directly,68,70 and a gap exists between phospholipids and graphene, and (iv) AFM measurements depend strongly on the substrate used for graphene deposition and are distorted by the variability of substrates,68,71,72 these data supported the formation of few-layer graphene, likely with not more than 2–3 layers.
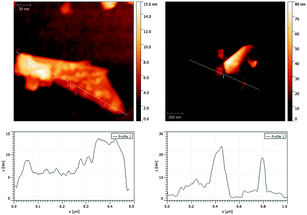 | ||
| Fig. 4 AFM images of LIPO-G (upper images) and cross-section along the cross line (bottom images). Scale bars are: 50 nm (upper left) and 200 nm (upper right). | ||
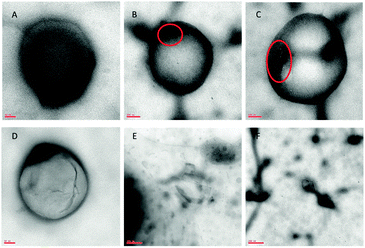
Fig. 5 presents typical TEM images of the analyzed sample. The results showed that vesicles belong to the class of LUVs with a mean diameter of about 150–180 nm for empty liposomes (Fig. 5A) and 240–280 nm for LIPO-G (Fig. 5B–D). While LIPO-G LUVs were easily observed without the use of vesicle staining, empty LUVs were difficult to focalize and visualize on the TEM grid. The loading of graphene did not significantly alter LUV morphology and, during the experiments, LIPO-G LUVs appeared to be able to stand the electron beam for longer time with respect to empty liposomes. Fig. 5B–D clearly evidence the presence of graphene sheets inside the liposomes although, due to the need to eliminate the solvent, the real disposition of graphene with respect to the not dried bilayer was difficult to envisage. Only very few graphene flakes were observed outside the liposomes deposited onto the TEM grid (Fig. 5E and F). In order to ascertain that graphene was inserted inside the liposomes we destroyed the liposomes by addition of 10 μL of a concentrated Triton X-100 aqueous solution to the liposomal solution. The precipitation of graphene flakes was detectable by the eye (see Fig. S6 in the ESI†). The so-obtained solution was deposited onto a copper grid and visualized by TEM. Several very small (ca. 100 nm) graphene flakes could be detected this time on the grid (Fig. 6).
The size and size distribution of LUVs in the as-prepared dispersion were also checked by DLS experiments and the results were found to be in good agreement with TEM measurements (see previously reported data).
Antimicrobial activity
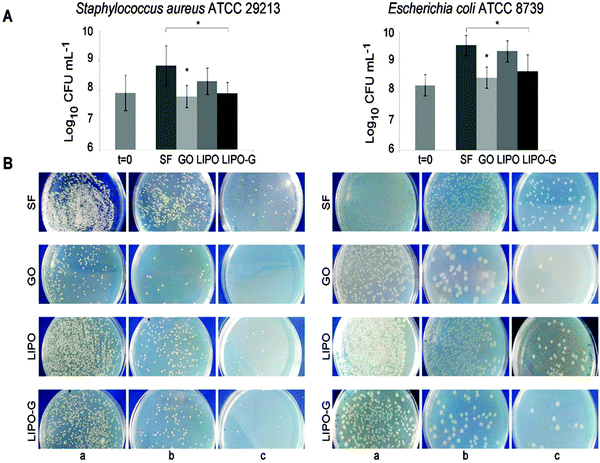
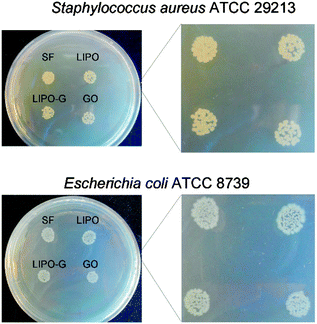
Staphylococcus aureus and Escherichia coli were used to evaluate the antibacterial effect of graphene oxide (GO) and LIPO-G at the same concentration, 50 μg mL−1. The saline (SF) and liposome suspension (LIPO) without graphene were used as controls. The antibacterial activity of LIPO-G, compared to that recently reported73 for GO with respect to the control LIPO and SF, respectively, after 2 h of contact, is shown in Fig. 7.The number of colony forming units of S. aureus ATCC 29213 and E. coli ATCC 8739 was slightly reduced in the presence of both GO and LIPO-G when compared to the CFUs detected with saline and LIPO. This reduction was significant (P < 0.05) in S. aureus after GO and LIPO-G treatment vs. SF, as well as in E. coli after GO and LIPO-G treatment vs. SF (Fig. 7A). The reduction of CFUs is clearly observed on TSA and LB agar plates (Fig. 7B) where the colony count was performed.
Fig. 8 displays the reduction of bacterial growth with the drop methodology. After 24 h of incubation in the presence of GO and LIPO-G, both S. aureus and E. coli colonies were reduced with respect to the controls.
The microscopic analysis of bacterial colonies confirmed the goodness of the reading. In fact, the observed bacteria do not aggregate with each other underlying that each counted colony is derived from one singular bacterial cell (see Fig. S7 in the ESI†).
The percentage of reduction of bacterial growth in the presence of GO and LIPO-G, obtained by colony count (see Fig. 7), is reported in Table 1.
| Strain | CFU mL−1 | % Ra | CFU mL−1 | % Rb | % Rc | |||
|---|---|---|---|---|---|---|---|---|
| t = 0 | SF | GO | LIPO | LIPO-G | ||||
| a Bacterial growth reduction GO vs. SF. b Bacterial growth reduction LIPO-G vs. LIPO. c Bacterial growth reduction LIPO-G vs. SF. | ||||||||
| SA | 8.21 × 10⁷ | 6.97 × 10⁸ | 6.30 × 10⁷ | 91.0 | 2.02 × 10⁸ | 8.06 × 10⁷ | 60.1 | 88.4 |
| EC | 1.55 × 10⁸ | 3.45 × 10⁹ | 2.81 × 10⁸ | 91.9 | 2.16 × 10⁹ | 4.65 × 10⁸ | 78.5 | 86.5 |
Values of bacterial growth reduction of 91.0% for S. aureus and 91.9% for E. coli were recorded after treatment with GO with respect to the control (SF) in agreement with literature data.73 Instead reduction of 60.1% for S. aureus and 78.5% for E. coli were recorded after treatment with LIPO-G with respect to control (LIPO). It is worth noting that treatment with LIPO-G, with respect to SF, induced a reduction of 88.4% and 86.5%, respectively, for S. aureus and E. coli, highlighting an antimicrobial activity comparable to that reported for hydrophilic GO. These data are particularly interesting because they point out the ability of liposomes to mediate the antimicrobial activity of the hydrophobic and non-covalently functionalized graphene.
No significant selectivity of LIPO-G is detected for Gram-positive or Gram-negative bacteria although an almost complete inhibition of growth of Gram-positive bacteria is monitored with respect to t = 0. This information is particularly interesting as GO evidenced instead a killing effect.
As far as the mechanism of antibacterial activity is concerned, it is likely, following previously published papers,42,43 and the observed affinity of pure liposomes and LIPO-G for the external membrane of the cell wall of Gram-negative organisms, that damage to the membrane was involved. Indeed, pure liposomes demonstrated to stimulate mostly the growth of Gram-negative bacteria with respect to Gram-positive bacteria due to the similar phospholipid composition of the external membrane of their cell wall. Analogously, graphene non-covalently functionalized with phospholipids reduced the growth of Gram-negative bacteria twice as much as that of Gram-positive bacteria.
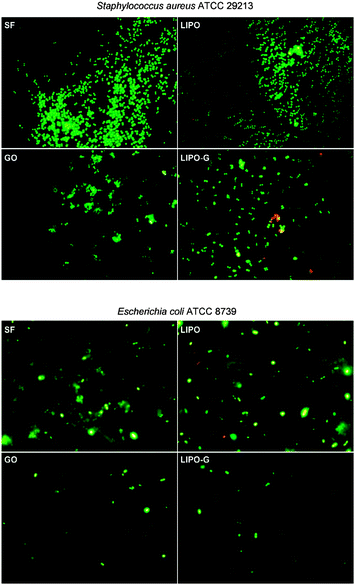
The bacterial viability is reported, by using live/dead staining, in Fig. 9. Both Staphylococcus aureus and Escherichia coli cells were uniformly viable as indicated by a green fluorescence with only a few red dead cells.
Taken together these data confirmed that the main effect obtained after contact with GO and LIPO-G was bacterial growth inhibition and a very low killing effect. In fact, after 2 h of incubation, the bacteriostatic effect was clearly detectable by the smaller number of bacteria per field with respect to the bacterial population in the controls. Moreover, these treated bacteria appeared almost totally viable with only a few dead red cells strongly suggesting the bacteriostatic effect of GO and LIPO-G on both S. aureus and E. coli.
Experimental
Materials
Graphite powder (99.99%, 200 mesh) was purchased from Alfa Aesar and 1-palmitoyl-2-oleyl-sn-glycero-3-phosphocholine (POPC) was purchased from Avanti Polar Lipids, Inc. (Alabaster, AL). Graphene oxide (GO) used for comparative antibacterial activity determination was prepared by using the modified Hummers method.40,74Unless otherwise stated, reagents were of analytical grade and used as received. All aqueous solutions were prepared using Ultrapure Milli-Q water (electric resistance >18.2 MΩ cm−1) from a Millipore Corp. model Direct-Q 3 system.
Apparatus
Sonication was performed by using an ultrasonic bath (Transsonic 310 Elma, 35 kHz). UV-Vis spectra were recorded on a Jasco V-550. Measurement of vesicle size and ζ-potential values was performed by using a 90Plus/BI-MAS Zeta Plus multiangle particle size analyzer (Brookhaven Instruments Corp.). Raman spectra were recorded on an Invia Renishaw microspectrometer (50 or 100×) and a laser source at 532 nm (power 5%, 3 or 5 accumulations/measurement). TEM observations were carried out on a Zeiss electron microscope M109 operated at 80 kW working voltage. The surfaces were imaged at a scan rate from 0.1 to 1.95 Hz. Images were acquired using a Gatan camera (U.S.) and processed by Nanoscope Analysis software. AFM analysis was performed on a Nanoscope V (Digital Instruments Metrology Group, model MMAFMLN) in tapping mode in air at room temperature, using an n-type silicon μmash® SPM probe (HQ:NSC15/AL BS) with 12–18 μm tip height and <40° cone angle (resonant frequency of 325 kHz and force constant of ∼40 N m−1). The collected images were then analyzed using WsXm 4.0 software (Nanotec Electronica S. L.) and Gwyddion 2.39.Preparation and processing of graphene-loaded liposomes
Liposomes were prepared according to the following protocol. 40 mg of POPC, dissolved in 4 mL of chloroform, were put in a round-bottomed flask and dried in a rotary evaporator under reduced pressure at 40 °C to form a thin lipid film on the inside wall of the flask. The phospholipid film was kept at 4 °C overnight before rehydration with 5 mL of Milli-Q water or PBS buffer (pH 7.4, 304 mOsm) in order to obtain a 0.8% w/w aqueous solution of phospholipid, a concentration that is above the critical aggregation concentration value of POPC (0.1% w/w). 5 mg of graphite powder was added to the resulting liposome suspension and sonicated for 2 h. The resulting mixture was centrifuged at 5000 rpm for 15 min to sediment unexfoliated particles or thick flakes of graphite and the supernatant, which was the final LIPO-G suspension, was collected.The exfoliation yield and the encapsulation efficiency of LIPO-G were calculated by UV-Vis spectrophotometry by determining the amount of graphene present in the supernatant after liposomal centrifugation.
The liposomal suspension was characterized by using UV-Vis spectroscopy, dynamic light scattering (DLS) experiments, ζ-potential measurements, transmission electron microscopy (TEM), Raman spectroscopy and AFM. The samples for Raman characterization were obtained by dropping the liposomal suspension on a wafer surface (we used n-type doped prime SiO2 wafers) and leaving the sample in the oven at 40 °C for 24 h in order to dry the aqueous solution. TEM samples were prepared by dropping a small drop of liposomal suspension (about 5 μL) on a carbon coated copper grid. Solvent was removed by keeping the grid at 30 °C for 60 h in an incubator in the presence of silica gel in order to ensure a total absence of moisture. The choice of using a low drying temperature for a relatively long time is correlated with the need to avoid high temperature and thus graphene sheet folding. AFM samples were prepared by drop-casting the solution onto silicon wafer substrates, drying under vacuum and washing the sample with methanol to remove excess liposomes and phospholipids.
Bacterial culture
Staphylococcus aureus ATCC 29213 and Escherichia coli ATCC 8739 were used in the present study. Staphylococcus aureus and E. coli were cultured in Trypticase Soy broth (TSB, Liofilchem, Italy) and Luria Bertani broth (LB, Oxoid, Italy) media, respectively, and incubated at 37 °C overnight under aerobic conditions. Cultures were diluted 1![[thin space (1/6-em)]](https://www.rsc.org/images/entities/char_2009.gif) :
:![[thin space (1/6-em)]](https://www.rsc.org/images/entities/char_2009.gif) 10 (v/v) in the respective TSB and LB media and refreshed for 2 h at 37 °C in an orbital shaker under aerobic conditions to obtain an exponential growth phase with a homogeneous bacterial population. Subsequently, the broth-cultures were washed in PBS (pH 7.2) and adjusted to an optical density (Abs600) of 0.12 corresponding to approximately 5 × 10⁷ CFU mL−1 and used for the experiments.
10 (v/v) in the respective TSB and LB media and refreshed for 2 h at 37 °C in an orbital shaker under aerobic conditions to obtain an exponential growth phase with a homogeneous bacterial population. Subsequently, the broth-cultures were washed in PBS (pH 7.2) and adjusted to an optical density (Abs600) of 0.12 corresponding to approximately 5 × 10⁷ CFU mL−1 and used for the experiments.
Antimicrobial activity
The standardized broth-cultures of S. aureus ATCC 29213 and E. coli ATCC 8739 were incubated with the same final concentration of 50 μg mL−1 GO, used as a comparison for the antibacterial activity of pristine graphene, and graphene-embedded in liposomal suspension (LIPO-G); as controls, bacteria were incubated with fresh isotonic saline solution (SF) and an equally concentrated POPC liposomal suspension (LIPO) at 37 °C at 250 rpm in an orbital shaker for 2 h. The loss of bacterial viability was evaluated by counting the colony forming units (CFUs) using a Colony Counter Star-Count STC 1000 (VWR International PBI Srl, Via San Giusto, Milan, Italy). Briefly, a series of 10-fold cell dilutions (100 μL) were spread onto Trypticase Soy Agar (TSA, Liofilchem, Italy) plates for S. aureus and onto LB agar (LB, Oxoid, Italy) plates for E. coli and incubated for 24 h at 37 °C. The cell growth inhibition was detected by comparing the colony counts between GO vs. SF and LIPO-G vs. LIPO.All experiments were performed in duplicate, and repeated for at least three independent experiments. The significance of the differences recorded in the experiments performed with SF, GO, LIPO, LIPO-G was evaluated using Student's t-test. Probability levels <0.05 were considered statistically significant.
The inhibition of CFU formation was also performed by dropping 10 μL of test substances (i.e. SF, GO, LIPO, LIPO-G) on agar plates with 10 μL of standardized bacterial suspensions. Plates were incubated at 37 °C for 24 h (see Table 1).
After treatment with SF, GO, LIPO, LIPO-G for 2 h, the bacterial viability was also evaluated using a Live/Dead Kit (Molecular Probes Inc., Invitrogen, Italy) as indicated by the manufacturer and visualized under a fluorescence Leica 4000 DM microscope (Leica Microsystems Spa, Milan, Italy). Ten fields of view randomly chosen for each slide were observed. Microscopic observations were repeated for three independent experiments.
Conclusions
We present a facile and prompt exfoliation protocol for graphite by exploiting 2 h of sonication of graphite in POPC large unilamellar vesicle aqueous solution. Spectrophotometry was used to quantify the exfoliated graphene. Raman spectroscopy demonstrated the prevailing formation of double-layer graphene and AFM confirmed the formation of few-layer graphene. TEM pointed out that sonication allows the formation of nanometric few-layer graphene sheets embedded in liposomes. The corresponding aqueous solution demonstrated to form a solution stable for hours and with significant antibacterial activity. In particular, data evidenced that liposome-embedded graphene reduces the growth capability of bacteria. In particular, it almost completely inhibits the microbial growth of Gram-positive bacteria whereas Gram-negative bacterial growth is reduced to a mere three-fold.Acknowledgements
The authors thank Dr Patrizia De Marco and Dr Antonello Di Crescenzo of the University “G. d'Annunuzio” of Chieti-Pescara for useful discussion on Raman and TEM analyses, and Prof. Maurizio Prato of the University of Trieste for useful discussion. The authors wish to thank University ‘G. d'Annunzio’ of Chieti-Pescara, University of Trieste, MIUR (PRIN 2010–11, prot. 2010N3T9M4 and FIRB, prot. RBAP1095CR) and POR FESR Abruzzo 2007–2013 for financial support. R.Z. thanks Regione Abruzzo (Reti per l'alta formazione – P.O. F.S.E. Abruzzo 2007–2013) that funded her annual postdoctoral fellowship.Notes and references
- M. J. Allen, V. C. Tung and R. B. Kaner, Chem. Rev., 2010, 110, 132 CrossRef CAS PubMed.
- A. K. Geim, Science, 2009, 324, 1530 CrossRef CAS PubMed.
- A. C. Ferrari, F. Bonaccorso, V. Fal'ko, K. S. Novoselov, S. Roche, P. Bøggild, S. Borini, F. H. L. Koppens, V. Palermo, N. Pugno, J. A. Garrido, R. Sordan, A. Bianco, L. Ballerini, M. Prato, E. Lidorikis, J. Kivioja, C. Marinelli, T. Ryhänen, A. Morpurgo, J. N. Coleman, V. Nicolosi, L. Colombo, A. Fert, M. Garcia-Hernandez, A. Bachtold, G. F. Schneider, F. Guinea, C. Dekker, M. Barbone, Z. Sun, C. Galiotis, A. N. Grigorenko, G. Konstantatos, A. Kis, M. Katsnelson, L. Vandersypen, A. Loiseau, V. Morandi, D. Neumaier, E. Treossi, V. Pellegrini, M. Polini, A. Tredicucci, G. M. Williams, B. Hee Hong, J.-H. Ahn, J. Min Kim, H. Zirath, B. J. van Wees, H. van der Zant, L. Occhipinti, A. Di Matteo, I. A. Kinloch, T. Seyller, E. Quesnel, X. Feng, K. Teo, N. Rupesinghe, P. Hakonen, S. R. T. Neil, Q. Tannock, T. Löfwander and J. Kinaret, Nanoscale, 2015, 7, 4598 RSC.
- T. Cohen-Karni, Q. Qing, Q. Li, Y. Fang and C. M. Lieber, Nano Lett., 2010, 10, 1098 CrossRef CAS PubMed.
- P. Begum, R. Ikhtiari and B. Fugetsu, Carbon, 2011, 49, 3907 CrossRef CAS PubMed.
- K. Bourzac, Nature, 2012, 483, S34 CrossRef PubMed.
- C. Schmidt, Nature, 2012, 483, S37 CrossRef PubMed.
- F. Bonaccorso, Z. Sun, T. Hasan and A. C. Ferrari, Nat. Photonics, 2010, 4, 611 CrossRef CAS PubMed.
- N. Savage, Nature, 2012, 483, S38 CrossRef CAS PubMed.
- S. Zhu, S. Tang, J. Zhang and B. Yang, Chem. Commun., 2012, 48, 4527 RSC.
- X. Huang, X. Qi, F. Boey and H. Zhang, Chem. Soc. Rev., 2012, 41, 666 RSC.
- J.-Y. Hong and J. Jang, J. Mater. Chem., 2012, 22, 8179 RSC.
- L. Dai, Acc. Chem. Res., 2013, 46, 31 CrossRef CAS PubMed.
- Y. Song, W. Wei and X. Qu, Adv. Mater., 2011, 23, 4215 CrossRef CAS PubMed.
- Y. Liu, X. Dong and P. Chen, Chem. Soc. Rev., 2012, 41, 2283 RSC.
- S. Sayyar, E. Murray, B. C. Thompson, J. Chung, D. L. Officer, S. Gambhir, G. M. Spinks and G. G. Wallace, J. Mater. Chem. B, 2015, 3, 481 RSC.
- H. Zhang, G. Grüner and Y. Zhao, J. Mater. Chem. B, 2013, 1, 2542 RSC.
- C. Chung, Y.-K. Kim, D. Shin, S.-R. Ryoo, B. H. Hong and D.-H. Min, Acc. Chem. Res., 2013, 46, 2211 CrossRef CAS PubMed.
- X. M. Sun, Z. Liu, K. Welsher, J. T. Robinson, A. Goodwin, S. Zaric and H. J. Dai, Nano Res., 2008, 1, 203 CrossRef CAS PubMed.
- Z. Liu, J. T. Robinson, X. M. Sun and H. J. Dai, J. Am. Chem. Soc., 2008, 130, 10876 CrossRef CAS PubMed.
- K. Yang, S. A. Zhang, G. X. Zhang, X. M. Sun, S. T. Lee and Z. A. Liu, Nano Lett., 2010, 10, 3318 CrossRef CAS PubMed.
- Y. Wang, Z. H. Li, D. H. Hu, C. T. Lin, J. H. Li and Y. H. Lin, J. Am. Chem. Soc., 2010, 132, 9274 CrossRef CAS PubMed.
- S. J. He, B. Song, D. Li, C. F. Zhu, W. P. Qi, Y. Q. Wen, L. H. Wang, S. P. Song, H. P. Fang and C. H. Fan, Adv. Funct. Mater., 2010, 20, 453 CrossRef CAS PubMed.
- C. H. Lu, H. H. Yang, C. L. Zhu, X. Chen and G. N. Chen, Angew. Chem., Int. Ed., 2009, 48, 4785 CrossRef CAS PubMed.
- X. H. Zhao, R. M. Kong, X. B. Zhang, H. M. Meng, W. N. Liu, W. H. Tan, G. L. Shen and R. Q. Yu, Anal. Chem., 2011, 83, 5062 CrossRef CAS PubMed.
- H. X. Chang, L. H. Tang, Y. Wang, J. H. Jiang and J. H. Li, Anal. Chem., 2010, 82, 2341–2346 CrossRef CAS PubMed.
- C. Peng, W. B. Hu, Y. T. Zhou, C. H. Fan and Q. Huang, Small, 2010, 6, 1686 CrossRef CAS PubMed.
- R. Kempaiah, A. Chung and V. Maheshwari, ACS Nano, 2011, 5, 6025 CrossRef CAS PubMed.
- P. Nguyen and V. Berry, J. Phys. Chem. Lett., 2012, 3, 1024 CrossRef CAS.
- W. C. Lee, C. H. Lim, H. Shi, L. A. Tang, Y. Wang, C. T. Lim and K. P. Loh, ACS Nano, 2011, 5, 7334 CrossRef CAS PubMed.
- Y. Luo, H. Shen, Y. Fang, Y. Cao, J. Huang, M. Zhang, J. Dai, X. Shi and Z. Zhang, ACS Appl. Mater. Interfaces, 2015, 7, 6331 CAS.
- T.-H. Kim, S. Shah, L. Yang, P. T. Yin, Md. K. Hossain, B. Conley, J.-W. Choi and K. B. Lee, ACS Nano, 2015, 9, 3780 CrossRef CAS PubMed.
- B. Chaudhuri, D. Bhadra, L. Moroni and K. Pramanik, Biofabrication, 2015, 7, 1 CrossRef CAS PubMed.
- S. H. Ku and C. B. Park, Biomaterials, 2013, 34, 2017 CrossRef CAS PubMed.
- C. Zhao, X. Lu, C. Zanden and J. Liu, Biomed. Mater., 2015, 10, 015019 CrossRef PubMed.
- R. Subbiah, P. Du, S. Y. Van, M. Suhaeri, M. P. Hwang, K. Lee and K. Park, Biomed. Mater., 2014, 9, 065003 CrossRef PubMed.
- S. Y. Park, J. Park, S. H. Sim, M. G. Sung, K. S. Kim, B. H. Hong and S. Hong, Adv. Mater., 2011, 23, H263 CrossRef CAS PubMed.
- G. Y. Chen, D. W. Pang, S. M. Hwang, H. Y. Tuan and Y. C. Hu, Biomaterials, 2012, 33, 418 CrossRef CAS PubMed.
- B. C. Thompson, E. Murray and G. G. Wallace, Adv. Mater., 2015 DOI:10.1002/adma.201500411.
- V. Ettorre, P. De Marco, S. Zara, V. Perrotti, A. Scarano, A. Di Crescenzo, M. Petrini, C. Hadad, D. Bosco, B. Zavan, L. Valbonetti, G. Spoto, G. Iezzi, A. Piattelli, A. Cataldi and A. Fontana, ACS Appl. Mater. interfaces Search PubMed , submitted.
- X. Zhou and F. Liang, Curr. Med. Chem., 2014, 21, 855 CrossRef CAS.
- O. Akhavan and E. Ghaderi, ACS Nano, 2010, 4, 5731 CrossRef CAS PubMed.
- W. B. Hu, C. Peng, W. J. Luo, M. Lv, X. Li, D. Li, Q. Huang and C. Fan, ACS Nano, 2010, 4, 4317 CrossRef CAS PubMed.
- S. Haar, A. Ciesielski, J. Clough, H. Yang, R. Mazzaro, F. Richard, S. Conti, N. Merstorf, M. Cecchini, V. Morandi, C. Casiraghi and P. Samori, Small, 2015, 11, 1691 CrossRef CAS PubMed.
- A. V. Titov, P. Kral and R. Pearson, ACS Nano, 2009, 4, 229 CrossRef PubMed.
- W. Du, X. Jiang and L. Zhu, J. Mater. Chem. A, 2013, 1, 10592 CAS.
- D. P. Speert, Can. J. Infect. Dis., 1996, 7, 169 CAS.
- A. J. Huh and Y. J. Kwon, J. Controlled Release, 2011, 10, 128 CrossRef PubMed.
- W. Gao, S. Thampiwatana, P. Angsantikul and L. Zhang, Wiley Interdiscip. Rev.: Nanomed. Nanobiotechnol., 2014, 6, 532 CrossRef CAS PubMed.
- U. Khan, A. O'Neil, M. Lotya, S. De and J. N. Coleman, Small, 2010, 6, 864 CrossRef CAS PubMed.
- E. Sawosz, S. Jaworski, M. Kutwin, A. Hotowy, M. Wierzbicki, M. Grodzik, N. Kurantowicz, B. Strojny, L. Lipińska and A. Chwalibog, Int. J. Nanomed., 2014, 9, 3913 CAS.
- Z. Jin, T. P. McNicholas, C.-J. Shih, Q. H. Wang, G. L. C. Paulus, A. J. Hilmer, S. Shimizu and M. S. Strano, Chem. Mater., 2011, 23, 3362 CrossRef CAS.
- J. Pereira-Lachataignerais, R. Pons, P. Panizza, L. Courbin, J. rouch and O. López, Chem. Phys. Lipids, 2006, 140, 88 CrossRef CAS PubMed.
- P. C. Hiemez and R. Rajagopalan, Principles of Colloid, Surface Chemistry, Marcel Dekker, New York, USA, 1997 Search PubMed.
- A. C. Ferrari, J. C. Meyer, V. Scardaci, C. Casiraghi, M. Lazzeri, F. Mauri, S. Piscanec, D. Jiang, K. S. Novoselov, S. Roth and A. K. Geim, Phys. Rev. Lett., 2006, 97, 187401 CrossRef CAS.
- I. Calizo, D. Teweldebrhan, W. Bao, F. Miao, C. N. Lau and A. A. Balandin, J. Phys.: Conf. Ser., 2008, 109, 012008 CrossRef.
- J. S. Vincent, S. D. Revak, C. D. Cochrane and I. W. Levin, Biochemistry, 1993, 32, 8228 CrossRef CAS.
- B. J. Litman, E. N. Lewis and I. W. Levin, Biochemistry, 1991, 30, 313 CrossRef CAS.
- H. Takeuchi, Y. Nemoto and I. Harada, Biochemistry, 1990, 29, 1572 CrossRef CAS.
- F. Lhert, D. Blaudez, C. Heywang and J.-M. Turlet, Langmuir, 2002, 18, 512 CrossRef CAS.
- R. G. Snyder, H. L. Strauss and C. A. Elliger, J. Phys. Chem., 1982, 86, 5145 CrossRef CAS.
- D. Aslanian, M. Negrerie and R. Chambert, Eur. J. Biochem., 1986, 160, 395 CrossRef CAS PubMed.
- B. P. Gaber and W. L. Peticolas, Biochim. Biophys. Acta, Biomembr., 1977, 465, 260 CrossRef CAS.
- M. Picquart and T. Lefèvre, J. Raman Spectrosc., 2003, 34, 4 CrossRef CAS PubMed.
- M. Di Foggia, S. Bonora and V. Tugnoli, J. Therm. Anal. Calorim., 2013, 111, 1871 CrossRef CAS.
- Z. Derzkot and K. Jacobson, Biochemistry, 1980, 19, 6050 CrossRef.
- J. S. Vincent and I. W. Levin, Biophys. J., 1991, 59, 1007 CrossRef CAS.
- F. Giannazzo, S. Sonde, V. Raineri, G. Patanè, G. Compagnini, F. Aliotta, R. Ponterio and E. Rimini, Phys. Status Solidi C, 2010, 7, 1251 CAS.
- R. Zappacosta, A. Fontana, A. Credi, A. Arduini and A. Secchi, Asian J. Org. Chem., 2015, 4, 262 CrossRef CAS PubMed.
- C. Chen, W. Zhai, D. Lu, H. Zhang and W. Zheng, Mater. Res. Bull., 2011, 46, 583 CrossRef CAS PubMed.
- H. W. C. Postma, A. Sellmeijer and C. Dekker, Adv. Mater., 2000, 12, 1299 CrossRef CAS.
- Z. Su, Q. Fu, H. Li and K. Li, Nano, 2014, 12, 1450066 Search PubMed.
- S. Liu, T. H. Zeng, M. Hofmann, E. Burcombe, J. Wei, R. Jiang, J. Kong and Y. Chen, ACS Nano, 2013, 5, 6971 CrossRef PubMed.
- T. Rattana and S. Chaiyakun, Procedia Eng., 2012, 32, 759 CrossRef CAS PubMed.
Footnote |
| † Electronic supplementary information (ESI) available: Stability measurements; Raman fitting; precipitation of graphene embedded in liposomes; and Gram staining images. See DOI: 10.1039/c5tb00798d |
| This journal is © The Royal Society of Chemistry 2015 |

