 Open Access Article
Creative Commons Attribution 3.0 Unported Licence
Urine-activated origami microbial fuel cells to signal proof of life
Jonathan
Winfield
*a,
Lily D.
Chambers
b,
Jonathan
Rossiter
b,
John
Greenman
c and
Ioannis
Ieropoulos
*a
aBristol BioEnergy Centre, Bristol Robotics Laboratory, University of the West of England, Bristol, UK. E-mail: jon.winfield@brl.ac.uk; ioannis.ieropoulos@brl.ac.uk
bBristol Robotics Laboratory, University of Bristol, Bristol, UK
cMicrobiology Department, University of the West of England, Bristol, UK
First published on 20th February 2015
Abstract
The adaptability and practicality of microbial fuel cells (MFCs) are highly desirable traits in the search for alternative sources of energy. An innovative application for the technology could be to power portable emergency locator transmitters (ELTs). Such devices would ideally need to be lightweight, robust and fast-in terms of response. Urine is an abundant resource, and with MFCs, could be the ideal fuel for powering ELTs, with the compelling advantage of also indicating proof of life. We developed novel origami tetrahedron MFCs (TP-MPFCs) using photocopier paper to test different urine-based inoculants. When inoculated with urine extracted from the anode chambers of working MFCs a stack of 6 abiotic MFCs produced a usable working voltage after just 3 h 15 min; enough to energise a power management system. The anodes of established TP-MFCs were then removed and air-dried for 7 days before being inserted into new paper reactors and refrigerated. After 4 weeks, these MFCs displayed an immediate response to fresh urine and achieved a functional working voltage in just 35 minutes. Two paper MFCs connected in parallel were able to transmit 85 radio signals and in a series configuration 238 broadcasts over 24 hours. These findings demonstrate that simple, inexpensive, lightweight paper MFCs can be employed as urine-activated, “proof of life” reporting systems.
1. Introduction
Since its discovery in China over 2000 years ago,1 paper has been instrumental in helping to shape and advance human knowledge and culture. Whilst there is now an environmental drive towards paperless systems, the cellulose-based material is still commonplace in everyday life and waste is still an issue. For example, in the UK, millions of tonnes of consumed paper and cardboard are not recovered and of the material that is recovered, over half has to be exported overseas for recycling.2 Waste control, treatment and energy consumption are all global concerns and one technology that has attracted interest as a solution to combatting these problems is the microbial fuel cell (MFC). MFCs employ microorganisms to produce electricity as a direct result of the utilisation of organic pollutants. The capacity to generate power from waste has resulted in a dynamic MFC field and great progress has been made over recent years. Not only have power and treatment efficiencies improved but potential target environments are widening. MFCs can operate in mild ambient conditions but also in extreme surroundings such as high temperature,3 salinity,4 acidity5 and alkalinity.6 At the macro-scale MFCs can be configured into stacks of multiples to bolster the voltage,7 while at the nanoscale the biofilm can be customised with biogenic particles to improve electron flow.8 Despite these and other exciting developments, MFCs are still often built using expensive or toxic materials.This is counter to the drive for technological scale-up and wider market acceptance where cost, sustainability and minimisation of waste are very important.9 Recently, advances towards this goal have been reported using green technology such as biodegradable electronics10 and biocompatible systems that can be incorporated into living tissue.11 The incorporation of sustainable paper into power producing devices would therefore be an important development, particularly if waste-paper could be used. To date there has been progress regarding the use of treated paper particularly in terms of diagnostic tools. For example Lee (2005)12 developed a urine activated paper battery using the reactions of chemical electrodes. Esquivel et al. (2014)13 demonstrated a microfluidic fuel cell also using chemical anolyte and catholyte. Paper-based enzymatic fuel cells have recently been reported utilising glucose for power production14 or designed to detect DNA in origami-style systems.15 In terms of MFCs, drip-activated, multi-layered paper reactors for diagnostic applications have been reported.16,17 These have employed single culture anodes (Shewanella oneidensis) with ferricyanide cathodes in both individual16 and stacked configurations.17 Moqsud and co-workers used filter paper as the proton exchange membrane (PEM) in an acrylic anode chamber, which worked as efficiently as commercially available PEMs.18 A further consideration is to focus on the development of inexpensive paper-based fuel cells for robust, long term operation. To the authors’ knowledge, there have been no reports to date of monolithic MFCs built using untreated paper creating an internal anode chamber with sustainable open-to-air cathodes. The development of such paper-based MFCs would open the prospect for novel applications such as transportable, light-weight, back-up power supplies. These systems would require rapid start up and ideally a stable output over days or even weeks, in order to comply with protocols of emergency technologies. Should such a device be operated in a remote location, an easily accessible fuel would be essential and urine has been demonstrated to be an efficient substrate for electricity production in MFCs.19–21 The power produced via the introduction of a biological fluid such as urine could also be channelled to signal ‘proof of life’ by activating a portable emergency locator transmitter (ELT) device. However, in the scenario suggested, assuming that the operator was carrying dry paper MFCs to be used in the event of an emergency, urine would either need to be utilised as the source of electro-active bacteria (i.e. inoculant) or the MFCs would need to have already been inoculated with the constituent bacteria in dormant mode. The robustness of the biofilm is an important consideration22 and the current study therefore investigates the feasibility of both these possibilities using novel paper-based MFCs: (i) post-deployment inoculation and (ii) deployment of pre-inoculated in dormant state. The initial step was to assess different paper types and whether they can simultaneously be used as both PEM and reactor body. Inoculation, start-up and reactivation using urine-based inoculants and fresh urine were subsequently investigated, and demonstrated operation of these novel monolithic paper microbial fuel cells.
2. Experimental
2.1 MFC construction
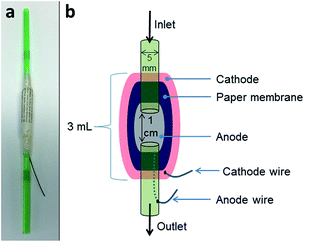
Two MFC designs were used in this study. Firstly tubular straw MFCs were developed in order to gauge the initial performance of 6 different types of paper as PEM. Secondly, tetrahedron shaped MFCs were fabricated to investigate paper MFCs as an immediate and stable source of power. Details on both are given below.Fig. 1a shows a MFC with newspaper as membrane prior to being coated with cathode. For the cathode a piece of wire was firstly adhered to the outside of the paper membrane using wire glue (Anders Products, MA, USA). Next, conductive synthetic latex was prepared as previously described23 and this was painted over the surface of the paper. A schematic of the tubular MFCs is highlighted in Fig. 1b. The MFCs were inoculated for a week using the anolyte (1% tryptone and 0.5% yeast extract [Oxoid Ltd, UK]) removed from established cubic MFCs. After 7 days, the MFCs were fed sterile TYE (tryptone 1%, yeast extract 0.5%). Feeding involved injecting 2 mL of feedstock into each straw daily. MFCs were monitored to observe which of the untreated paper-types (if any) would be suitable as a substitute proton exchange membrane.
2.2 Inoculation experiment
Three types of inoculum were tested using TP-MFCs; (i) Urinoc A: urine removed from the anode chambers of established cubic MFCs mixed with fresh urine (50/50 ratio), (ii) Urinoc B: primary wastewater effluent (Wessex Water, Saltford, UK) mixed with fresh urine (50/50 ratio) and (iii) Urinoc C: fresh urine. All urine samples were provided by healthy volunteers on a normal diet with no history of urinary tract or renal disease. Duplicate MFCs were injected with 15 mL of each inoculum-type and left for 3 days under 3 kohm load; they were then periodically topped up with fresh urine (no more than 1 hour old). Experiments were performed under identical conditions at ambient temperature conditions (22 ± 1 °C).2.3 Scanning electron microscopy
Clean paper samples (1 cm × 1 cm) were prepared for microscopy by gold sputter coating using an Emscope SC500 sputter coating unit. Observation and image capture was performed using a Philips XL30 environmental scanning electron microscope.2.4 Stack and refrigeration experiments
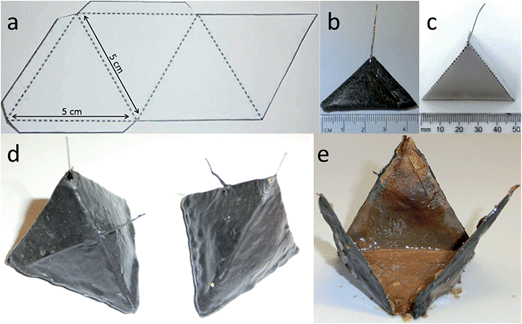
Six TP-MFCs were constructed without any inoculation and were connected together electrically in parallel. These were injected with Urinoc A on day one before being fed with fresh human urine. Following 12 weeks of operation the MFCs were disassembled and the 6 anodes removed (Fig. 2e). The electrodes were then air-dried for 7 days, before being inserted into 6 new TP-MFCs and refrigerated at 3 to 5 °C. At both 4 weeks and 8 weeks of refrigeration MFCs were removed and fed with fresh urine.2.5 Polarisation experiments
Polarisation sweeps were performed using an automated computer-controlled variable resistor.24 Sixty resistance values were applied from 1 MΩ down to 3 Ω using a sample rate of 5 min. The MFCs were topped up with anolyte (TYE for the tubular MFCs and urine for the TP-MFCs) an hour before the polarisation sweeps.2.6 Data collection
MFC output was recorded in millivolts (mV) against time using an Agilent LXI (34972A) data acquisition/switch unit with a 2 min sample rate. Recorded data were processed and analysed using the GraphPad Prism 6 software package (GraphPad, San Diego, CA, USA). Current (I) in amperes (A) was calculated using Ohm's law; I = V/R, where V is the measured voltage in volts (V) and R is the known value of the external resistive load in ohms (Ω). Power (P) in watts (W) was calculated by multiplying voltage with current: P = I × V.2.7 Energy harvesting, power management and transceiver
For the experiment with the TP-MFC stack, a power management system (PMS) consisting of an inductor-based energy harvesting board (EH4295, Advanced Linear Devices Inc., CA, USA), a bridge rectifier, a capacitor (6.3 mF) and a custom made comparator board with added hysteresis were used as previously described.23 In order to kick-start the energy harvesting board, an input of 60 mV at a resistance of 950 ohm was required. When this point was reached, the capacitor began charging up to 3.1 V before discharging through a load down to 2.1 V. For the later experiments a radio transceiver (Easy-Radio 400TRS LPRS, UK) with a 250 m range was employed using the same PMS system but without the comparator board. For the purposes of the experiment the receiver was approximately 4 m from the MFC stack. In the latter case of the transceiver, the capacitor reached 3.1 V before discharging to 2.4 V resulting in one transmission being broadcast at which point the charge cycle started again. Each transmission resulted in the sending of text to a desktop computer.3. Results and discussion
3.1 Comparing different paper types
Six widely available and inexpensive paper types were trialled as proton exchange membranes for microbial fuel cells. The surface structure of each is detailed in Fig. 3, which highlights the intertwined threads of cellulose making up the material. A filler pigment can be seen in the newspaper (Fig. 3d) and copier paper (Fig. 3e) samples. EDX analysis indicated that the newspaper filler was calcium carbonate and the photocopier paper was kaolinite. The threads of the tissue sample were much less densely packed and the material was visibly more porous (Fig. 3f). In order to test the various paper-types out as membranes, small scale tubular MFCs were developed using conductive latex cathodes that helped waterproof the material. The MFCs with paper-tissue membranes were inferior to the other paper types from the outset and by the third week could only attain a maximum open circuit voltage of 12 mV. Power curves generated after this period demonstrate that the tissue MFCs produced negligible output (Fig. 4) whilst of the other five paper types the photocopier paper generated the highest power. These preliminary results highlight that whilst porosity is important for proton exchange, a material that is too porous i.e. the tissue paper, cannot maintain sufficient separation between the anode and the cathode and a short-circuit effect occurs. Using the knowledge that simple photocopier paper can be used as the medium for proton exchange in combination with the waterproofing conductive latex cathode, novel reactor shapes and designs were trialled with the 3D tetrahedron shaped MFCs detailed in the following section.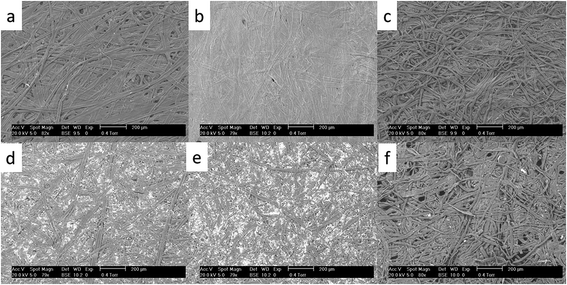 | ||
| Fig. 3 SEM images showing different paper types used as membrane: (a) brown compostable bag, (b) cigarette paper, (c) filter paper, (d) newspaper, (e) photocopier paper, (f) tissue paper. | ||
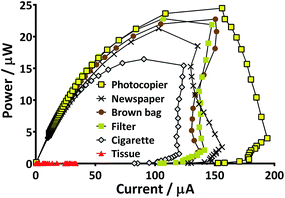 | ||
| Fig. 4 Comparison of power curves produced from six paper types as membrane. Curves presented are from the peak performing MFC of each type. | ||
3.2 Urine as inoculum
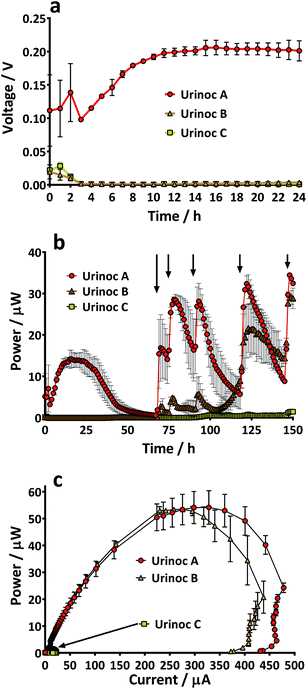
There are many factors that make paper a desirable material for MFCs; low cost, light-weight, disposable and biodegradable. However, it would be unfortunate if the pliability of the material could not be utilised as well. The absorbent nature and the potential to leak could limit paper from being used as structural material but the use of a waterproofing cathode material in the current study meant that novel shapes and structures could be tested. Several designs were considered but the tetrahedron, a platonic solid, displayed several beneficial characteristics. For example it was simple to construct and the reactor could be built from a single piece of material. In addition the natural tapering resulted in an internal anode space that was fully enclosed by the cathode-covered walls thus maximising surface area and limiting oxygen diffusing into the chamber. Furthermore, the design ensured that the electrodes and membrane were in close proximity which enhances power generation.25 Previous work with paper-based MFCs has focussed on a diagnostic application but by fashioning an anode chamber it was envisaged that the lightweight reactors might generate longer term electricity in addition to rapid start-up. For utilisation as back-up power supplies in the event of emergency they would ideally be transported as inactive shells that could be activated as and when required. An ideal fuel for such a system is urine and yet the consideration of reactor start-up in such a scenario needs to be addressed. Urine is often assumed to be sterile until reaching the urethra, but the bladders of healthy individuals do contain a constituent microbiota,26 and so potentially the desirable, electro-active organisms may already be present. For this reason and to look at the speed of start-up of paper membrane MFCs, three urine-based inoculum types were tested. When the TP-MFCs were fed with the inoculant containing urine that had previously been the anolyte from established MFCs (Urinoc A), an instant working voltage was recorded (Fig. 5a). Despite showing an initial peak on injection, both the wastewater with urine (Urinoc B) and fresh urine only (Urinoc C) did not respond well in the first 24 hours because they did not yet develop a sufficient proportion of electro-active micro-organisms (Fig. 5a). The MFCs were fed with fresh urine 3 days after being injected with inoculum, and following each subsequent feed, an improvement can be seen in both the Urinoc A and Urinoc B MFCs to the extent that after approximately 150 hours they are comparable (Fig. 5b). On the contrary, the MFCs inoculated with fresh urine displayed little improvement over the first week of operation. Power curves produced after 2 weeks highlight that the MFCs inoculated with Urinoc A and Urinoc B are performing to a similar level whilst the MFCs inoculated with urine alone remain inferior (Fig. 5c). These results confirm that paper-based MFCs can demonstrate quick start-up using urine-based inocula. However, whilst urine has been reported to be an efficient mediator in activating chemical-based paper batteries6 it is not sufficient alone to start-up MFCs without an alternative source of micro-organisms. The inoculation process can be accelerated by scraping bacteria from the anodes of existing MFCs.27 The current study supports this and shows for the first time that a urine-based anolyte extracted from the anode chamber of established MFCs can effect an instant response from a previously abiotic anode chamber. In order to examine how quickly the power generated by sterile MFCs might be used to energise a power management system (PMS), and ultimately a working application, a stack of 6 TP-MFCs was constructed.3.3 Start-up: a stack of TP-MFCs
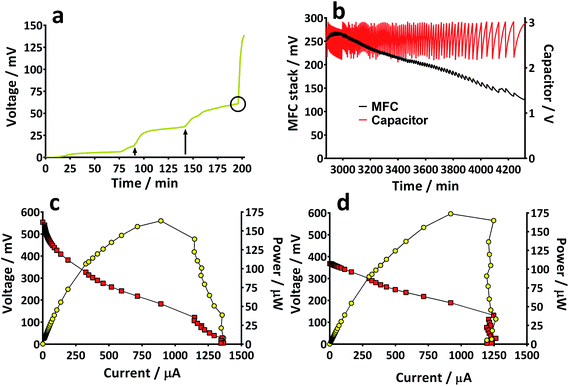
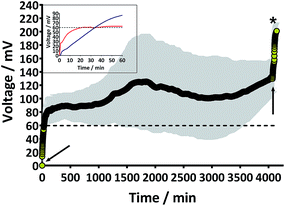
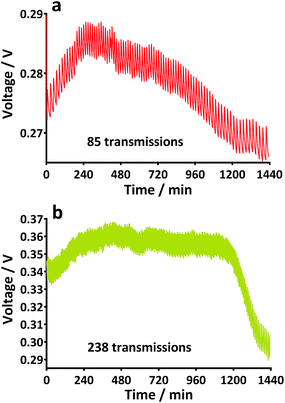
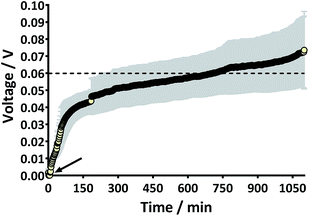
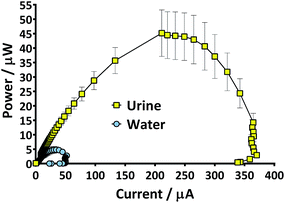
Prior to the introduction of Urinoc A the 6 MFCs had not been used or even leak-tested and so were dry and abiotic. The 6 MFCs were connected electrically in parallel before being attached to the PMS. For the energy harvesting board to become operational, 70 μA at an operating voltage of 60 mV is required, with an additional draw from the custom-made hysteresis board. From the outset, the PMS was connected to the stack and so the MFCs were under immediate load prior to being injected with Urinoc A. Following the introduction of inoculant, the voltage increased as the microbial consortia became acclimatised to the load conditions (Fig. 6a). The MFCs were topped up twice with inoculant on day one (as indicated by arrows in Fig. 6a) as the media quickly soaked into the reactor materials. After 3 h 16 min the stack reached the required voltage necessary to start the PMS, thus boosting the voltage and enabling the capacitor charge/discharge cycle to begin. Each discharge corresponds to the lighting of an LED and become more frequent as the MFCs stabilised. Fig. 6b shows the stack and capacitor voltage over the third day with the MFCs being topped up just once at the beginning of the day with fresh urine. Here the lightweight, inexpensive paper-based reactors continued to fire the load over twenty four hours albeit less frequently, as the anolyte became depleted. A polarisation sweep was performed on day 5 and Fig. 6c shows the polarisation and power curves produced from the six MFCs in parallel. The peak power produced (163 μW) is lower than the theoretical maximum based on the individual performances (Fig. 5c) when peak power was approximately 50 μW per MFC. However, in order to demonstrate the speed with which a completely abiotic stack could generate power, none of the MFCs had been previously tested and simply due to natural variation there may have been one (or more) underperforming reactors. This aspect is worthy of attention as the stack, even when not performing optimally, maintained the ability to energise the PMS rapidly and as long as fuel (urine) was fed approximately every three days, it was able to maintain continuous charge/discharge cycles. After operating for 2 months the TP-MFCs began to show fouling on the cathode and some leakage through the material was observed. However, despite the material's degradation, the stack continued to perform to the same level as in the earlier stages of the experiment. Fig. 6d shows the power and polarisation curves produced on day 61 and highlights that the point of maximum power is comparable to that produced on day 5 (Fig. 6c). This demonstrates not only that the paper MFCs can operate for a respectable period of time, particularly considering the cost and nature of the materials used, but also that the start-up was indeed rapid given the similarity in the power output between day 5 and that produced on day 61. In a realistic scenario, a lightweight MFC stack might be called upon for a single use operation or even as back-up in a remote location, e.g. as the power source for an emergency transmitter which will be explored in the next section. The results displayed in this section were generated by inoculating using urine-based anolyte extracted from the anode chambers of established MFCs, which was a rich source of electro-active microorganisms. However, on a remote mission it might be difficult to access such an efficient feedstock/inoculant and freshly produced urine might be the only available source of fuel. As discussed earlier, fresh urine could not activate abiotic MFCs and so the next line of experiments examined the robustness of anodic biofilms particularly in their response to desiccation and refrigeration.3.4 Activation with urine
4. Conclusions
This paper reports the development of lightweight paper-based MFCs with sustainable air cathodes. The use of a ubiquitous, readily available source of paper can advance the technology and it is envisaged that novel designs and stack configurations can be developed perhaps even using waste materials. Using a tetrahedron shaped design the inexpensive reactors could be stored for up to 8 weeks in cold storage before being reactivated at room temperature by freshly produced urine. The MFCs fuelled by urine were able to transmit radio broadcasts through a transceiver. The use of urine as fuel in order to broadcast a proof of life status will be highly attractive to a range of disciplines including medical, military, scientific exploration and space travel.Acknowledgements
The authors would like to thank The Leverhulme Trust for their financial support through Project Grant RPG-362. In addition, the authors would like to acknowledge Dr David Patton for his assistance with SEM and Dr Wax for help with the graphical abstract. Ioannis Ieropoulos is an EPSRC Career Acceleration Fellow supported by grant numbers EP/I004653/1 and EP/L002132/1.References
- P. H. Aitken, Some Notes on the History of Paper, Bibliographical Society, London, 1913.
- L. Wang, R. Templer and R. J. Murphy, Energy Environ. Sci., 2012, 5, 8281 CAS.
- K. C. Wrighton, P. Agbo, F. Warnecke, K. A. Weber, E. L. Brodie, T. Z. De Santis, P. Hugenholtz, G. L. Andersen and J. D. Coates, ISME J., 2008, 2, 1146 CrossRef CAS PubMed.
- X. C. Abrevaya, N. Sacco, P. J. D. Mauas and E. Corton, Extremophiles, 2011, 15, 633 CrossRef CAS PubMed.
- M. Malki, A. L. De Lacey, N. Rodrequez, R. Amils and V. M. Fernandez, Appl. Environ. Microbiol., 2008, 74, 4472 CrossRef CAS PubMed.
- C. Wu, L. Zhuang, S. Zhou, F. Li and J. He, Int. J. Syst. Evol. Microbiol., 2011, 61, 882 CrossRef CAS PubMed.
- I. Ieropoulos, J. Greenman and C. Melhuish, Int. J. Energy Res., 2008, 32, 1228 CrossRef CAS.
- X. Jiang, J. Hu, A. M. Lieber, C. S. Jackan, J. C. Biffinger, L. A. Fitzgerald, B. R. Ringeisen and C. M. Lieber, Nano Lett., 2014, 14, 6737 CrossRef CAS PubMed.
- M. Irmia-Vladu, Chem. Soc. Rev., 2014, 43, 588 RSC.
- C. J. Bettinger and Z. Bao, Adv. Mater., 2010, 22, 651 CrossRef CAS PubMed.
- M. Berggren and A. Richter-Dahlfors, Adv. Mater., 2007, 19, 3201 CrossRef CAS.
- K. B. Lee, J. Micromech. Microeng., 2005, 15, S210 CrossRef CAS.
- J. P. Esquivel, F. J. Del Campo, J. L. Gomez de la Fuente, S. Rojas and N. Sabate, Energy Environ. Sci., 2014, 7, 1744 CAS.
- C. W. N. Villarrubia, C. Lau, G. P. M. K. Ciniciato, S. O. Garcia, S. S. Sibbett, D. N. Petsez, S. Babanova, G. Gupta and P. Atanassov, Electrochem. Commun., 2014, 45, 44 CrossRef PubMed.
- Y. Wang, L. Ge, C. Ma, Q. Kong, M. Yan, S. Ge and J. Yu, Chem.–Eur. J., 2014, 20, 12453 CrossRef CAS PubMed.
- A. Fraiwan, S. Mukherjee, S. Sundermier, H. Lee and S. Choi, Biosens. Bioelectron., 2013, 49, 410 CrossRef CAS PubMed.
- A. Fraiwan and S. Choi, Phys. Chem. Chem. Phys., 2014, 16, 26288 RSC.
- M. A. Moqsud, K. Omine, N. Yasufuku, M. Hyodo and Y. Nakata, Waste Manage., 2013, 33, 2465 CrossRef CAS PubMed.
- I. Ieropoulos, J. Greenman and C. Melhuish, Phys. Chem. Chem. Phys., 2012, 14, 94–98 RSC.
- G. Zang, G. Sheng, W. Li, Z. Tong, R. J. Zeng, C. Shi and H. Yu, Phys. Chem. Chem. Phys., 2012, 14, 1978 RSC.
- P. Kuntke, K. M. Smiech, H. Bruning, G. Zeeman, M. Saakes, T. H. J. A. Sleutels, H. V. M. Hamelers and C. J. N. Buisrnan, Water Res., 2012, 46, 2627 CrossRef CAS PubMed.
- M. Sharma, S. Bajracharya, S. Gildemyn, S. A. Patil, Y. Alvarez-Gallego, D. Pant, K. Rabaey and X. Dominguez-Benetton, Electrochim. Acta, 2014, 140, 191 CrossRef CAS PubMed.
- J. Winfield, L. D. Chambers, A. Stinchcombe, J. Rossiter and I. Ieropoulos, J. Power Sources, 2014, 249, 327 CrossRef CAS PubMed.
- N. Degrenne, F. Buret, B. Allard and P. Bevilacqua, J. Power Sources, 2012, 205, 188 CrossRef CAS PubMed.
- H. Liu, S. Cheng and B. E. Logan, Environ. Sci. Technol., 2005, 39, 5488 CrossRef CAS.
- D. A. Lewis, R. Brown, J. Williams, P. White, S. K. Jacobson, J. R. Marchesi and M. J. Drake, Front. Cell. Infect. Microbiol., 2013, 3, 41 Search PubMed.
- J. R. Kim, B. Min and B. E. Logan, Appl. Microbiol. Biotechnol., 2005, 68, 23 CrossRef CAS PubMed.
- F. F. Ajayi and P. R. Weigele, Bioresour. Technol., 2012, 116, 86 CrossRef CAS PubMed.
- K. B. Lee, J. Micromech. Microeng., 2006, 16, 2312 CrossRef CAS.
- J. E. Mink, R. M. Qaisi, B. E. Logan and M. M. Hussain, NPG Asia Mater., 2014, 6, e89 CrossRef CAS.
| This journal is © The Royal Society of Chemistry 2015 |

