 Open Access Article
A polyoxometalate coupled graphene oxide–Nafion composite membrane for fuel cells operating at low relative humidity†
Yong
Kim
a,
Kriangsak
Ketpang
a,
Shayapat
Jaritphun
b,
Jun Seo
Park
b and
Sangaraju
Shanmugam
 *a
*a
aDepartment of Energy Systems Engineering, Daegu Gyeongbuk Institute of Science and Technology (DGIST), 50-1 Sang-Ri, Hyeonpung-Myeon, Dalseong-Gun, Daegu 711-873, Republic of Korea. E-mail: sangarajus@dgist.ac.kr
bDepartment of Chemical Engineering and Research Center of Chemical Technology, Hankyoung National University, Anseong, Gyeonggi 456-749, Republic of Korea
First published on 10th March 2015
Abstract
Polymer electrolyte fuel cells operating at elevated temperature and low relative humidity (RH) have been investigated by utilizing a polyoxometalate coupled graphene oxide–Nafion membrane. A phosphotungstic acid (PW) coupled graphene oxide–Nafion (Nafion/PW-mGO) membrane showed enhanced proton conductivity compared with pristine and recast Nafion membranes. The Nafion/PW-mGO hybrid membrane exhibited a maximum power density of 841 mW cm−2, whereas the pristine Nafion membrane showed a power density of 210 mW cm−2 operated at 80 °C under 20% RH. In comparison, our hybrid membrane showed a 4-fold higher maximum fuel cell power density when operated at 80 °C under 20% RH, than that of a state-of-the-art pristine membrane (Nafion-212). The remarkably enhanced performance of the Nafion/PW-mGO composite membrane was mainly attributed to the reduction of ohmic resistance by the hygroscopic solid acids, which can retain water in their framework through hydrogen bonding with protons at elevated temperatures and facilitates proton transport through the membrane.
Introduction
Polymer electrolyte fuel cells (PEFCs) are attracting tremendous interest as one of the most promising clean power generation systems as an alternative to the use of fossil energy sources.1 Researchers have made great efforts to develop fuel cells for commercialization based on hydrogen energy to reduce the amount of oil being used and to decrease the emission of global warming pollutants.1 However, a profound drawback of the current PEFC technology is that the Nafion membrane has low water retention capacity at temperatures above 80 °C or inability to operate under low humidity for extended periods.2–6 The proton conductivity of the Nafion membrane is very sensitive to the water content and is maximum when the membrane is fully saturated with water.7,8 The retention of water within the membrane at and above 80 °C is a key parameter to achieve Nafion based membranes with high proton conductivity. At elevated temperature and low relative humidity (RH) operation, the proton conductivity of the Nafion membrane decreases dramatically by orders of magnitude due to the dehydration of the membrane, thus the operation of PEFCs at low RH is limited. So, the current Nafion and other membranes cannot meet the requirements for the practical applications of PEFCs thereby impeding commercialization of this technology.9,10Several approaches were adopted to alter and improve the physical and chemical properties of the Nafion membrane. One promising approach to enhance the performance of membranes is to increase the ion-exchange capacity (IEC) by adding ionic groups to the polymer, resulting in an increase in its proton conductivity. However, the membrane with a high IEC value exhibits poor mechanical properties due to its excessive swelling behavior. Yet another approach to improve the proton conductivity of Nafion membranes at low humidity is to include inorganic fillers such as silica,11–13 titania,13–15 zirconia,16 and clay,17 which provides both hygroscopic and proton conductive properties to the membrane. Hygroscopic inorganic fillers narrow the hydrophilic channels and retain water in the Nafion matrix, facilitating the conduction of protons.11,12,16 Another advantage of inorganic fillers is their high thermal stability over 100 °C owing to the electrostatic attraction within the electrical double layer.15 Nevertheless, incorporating inorganic materials into Nafion reduces the proton conductivity owing to a decrease in the number of sulfonate groups per unit volume of each domain.13
Polyoxometalates (POMs) are well defined metal–oxygen cluster compounds, which has received much attention in recent years due to their high acid strength and thermal stability.18,19 The protons present in POMs form hydrogen bonds with water in the crystal structure and exist as H3O+ or H5O2+, so it is a prospective material in the field of proton exchange fuel cells for high proton conductive membranes with Nafion.19–22 The Nafion/polyoxometalate composite membrane can improve the proton conductivity, but embedded polyoxometalate can be leached out from the membrane due to its high solubility in water.22 As this problem remains, new approaches are needed. To address this serious issue, one of the promising approaches is the construction of a nanostructured hybrid, in which ionic clusters are coupled with the graphene oxide surface with a linker forming strong electrostatic coupling between POM and GO materials.
Herein, we introduce a rational design of a nanohybrid consisting of phosphotungstic acid, H3[PW12O40]·29H2O (PW) coupled with a covalently modified reduced graphene oxide with 3-aminopropyl-triethoxysilane (APTES), through an electrostatic interaction between the PW and the graphene oxide surface via a silane linker, amine group (mGO). The linker, APTES, is a strong base, so that it makes a strong electrostatic interaction with PW caused by Brønsted acid and Brønsted base states. Further, the silane group attaches with the hydroxyl group and the carboxyl group on the reduced graphene oxide (rGO) through the condensation reaction as depicted in Fig. 1.
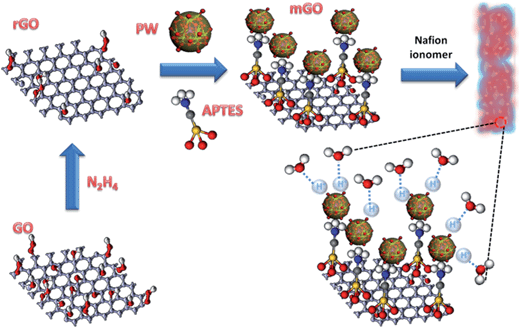 | ||
| Fig. 1 Schematic representation of fabrication of the phosphotungstic acid modified reduced graphene oxide–Nafion composite membrane. | ||
Results and discussion
The formation of the PW-mGO nanohybrid was first characterized by FT-IR, TEM and CV techniques. The FT-IR spectra of GO, rGO, mGO, and PW-mGO showed characteristic individual functional group vibration peaks as shown in Fig. 2a. The successful hybridization of APTES onto reduced graphene oxide was confirmed by its characteristic stretching peaks of –NH2 and Si–O in the range of 2000 to 700 cm−1.23 The absorption peaks at 3275 cm−1, 1574 cm−1, and 774 cm−1 are attributed to the –NH2 functional group.23 The Si–O–C peak (1045 cm−1) and Si–O–Si peak (1119 cm−1), overlapped and gave rise to a broad peak, indicating the successful hybridization of APTES onto the reduced graphene oxide through the condensation reaction. The FT-IR spectra of pure PW displayed four M–O characteristic stretching peaks at 1080 (P–O), 983 (W = Ot), 891 (W–Ob–W) and 803 cm−1 (W–Oc–W). Compared with pure PW, peaks of the hybrid composite, PW-mGO (Fig. 2b), at 1036 (P–O), 972 (W = Ot), 884 (W–Ob–W) and 806 cm−1 (W–Oc–W) indicated a red shift, which may be ascribed to the strong interaction between the amine group on the modified graphene oxide and PW due to strong adsorption via electrostatic binding between them. The TEM morphology analysis of the PW-mGO hybrid reveals that the PW clusters dispersed uniformly with a cluster size of 1–2 nm on the graphene sheet (Fig. 3a). The well dispersed state of individual PW clusters suggests that the PW is strongly attached to the carbon framework of graphene. Moreover, TEM-HAADF images further show that the size of PW clusters was in the range of 1–2 nm (Fig. 3b and c). The loading of PW coupled on the surface of mGO was determined by thermogravimetric analysis (Fig. S1†). The thermograms showed that GO was completely decomposed at 700 °C. Based on thermogravimetric analysis of mGO and PW-mGO, the contents of APTES and PW in mGO and PW-mGO were found to be 9 and 15 wt%, respectively.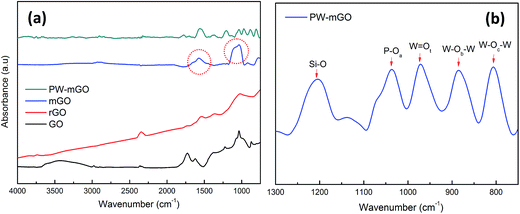 | ||
| Fig. 2 (a) FT-IR spectra of GO, rGO, mGO, and PW-mGO, the red circles marked are –NH2 and Si–O–Si bonds and (b) metal-oxide stretching peak information of PW-mGO. | ||
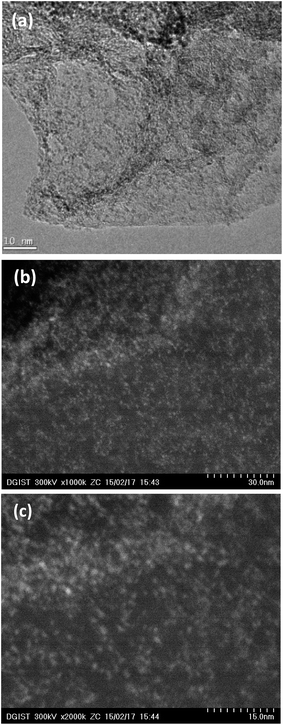 | ||
| Fig. 3 (a) TEM and (b and c) STEM-HAADF images of the PW-mGO hybrid. Bright spots represent PW clusters are well dispersed on the graphene oxide surface. | ||
Fig. 4a shows the cyclic voltammograms (CVs) of pure PW and PW-mGO hybrid electrodes in a potential window of −0.75 to −0.25 V at a scan rate of 25 mV s−1. The anodic and cathodic peak potentials and peak separation are listed in Table 1. A significant peak shift to a more negative potential was observed for the PW-mGO electrode when compared with pure PW. The observed negative peak shift might be due to PW energy level stabilization, which is due to a strong interaction with the graphene oxide surface as expected. This phenomenon was seen as the same reason from FT-IR data, which described a red shift caused by coating APTES on the rGO surface. Fig. 4b presents the CVs of PW-mGO at different scan rates (from 10 to 500 mV s−1). The anodic and cathodic peak currents increased with increasing scan rates. The peak separation potential values gradually increased with increasing scan rates, indicating that the electrochemical redox process is a surface dominant electron transfer phenomenon. Generally, the POM modified electrode films are usually unstable when applied in aqueous media during the electrochemical studies, which is due to their high solubility in aqueous solution, resulting in a decay of current. So, we evaluate the electrochemical stability of the PW-mGO hybrid electrode in 1 M H2SO4 by the continuous CV cycling stability test performed with a scan rate of 50 mV s−1 for 200 cycles (Fig. S2a†). The decay of the first reduction peak current was found to be only 4.5%, indicating the good electrochemical stability of the PW-mGO hybrid, which is due to the strong coupling between the amino group of APTES and PW (Fig. S2b†).
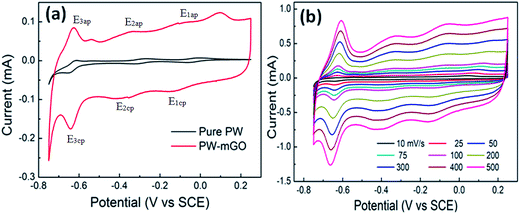 | ||
| Fig. 4 (a) The comparison of CV of pure PW and PW-mGO at 25 mV s−1 scan rate in 1 M H2SO4 electrolyte and (b) the effect of scan rate on the PW-mGO hybrid electrode. | ||
| Electrodes | E 1ap (mV) | E 1cp (mV) | ΔE1 (mV) | E 3ap (mV) | E 3cp (mV) | ΔE2 (mV) | E 3ap (mV) | E 3cp (mV) | ΔE3 (mV) |
|---|---|---|---|---|---|---|---|---|---|
| a E 1ap – first anodic peak potential, E1cp – first cathodic peak potential, and ΔE – peak separation. | |||||||||
| Pure PW | −8 | −59 | 51 | −272 | −309 | 37 | −611 | −649 | 38 |
| PW-mGO | −86 | −140 | 54 | −350 | −370 | 20 | −632 | −638 | 6 |
| Peak shift | 78 | 81 | 78 | 61 | 21 | 11 | |||
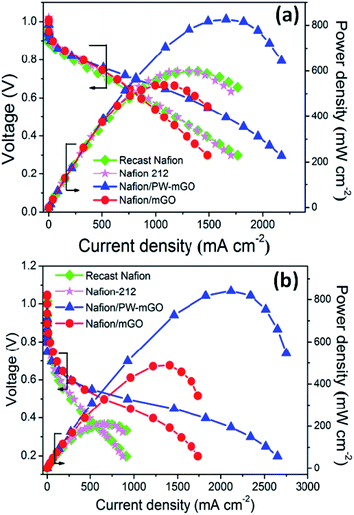
After successful fabrication of the PW-mGO nanohybrid, the PW-mGO is incorporated into the Nafion ionomer forming a composite membrane. The optimum PW-mGO nanohybrid loading in the composite membrane was found to be 1 wt% of the Nafion ionomer based on the proton conductivity and fuel cell performance studies (Fig. S3a and b†). The composite membranes were further evaluated for the fuel cell performance test and the results were compared with those of recast Nafion and Nafion-212 membranes. The catalyst loading on gas diffusion layers was kept identical for all the MEA studies. Fig. 5a compares the polarization plots of recast Nafion, Nafion-212, Nafion/mGO and Nafion/PW-mGO composite membranes at 80 °C under ∼100% RH and ambient pressure. The open circuit voltage was roughly 0.99–1.03 V for all membranes, indicating a very small amount of H2 gas permeability from the anode to the cathode through the membrane (Fig. 5). Nafion/mGO and Nafion/PW-mGO composite membranes delivered a maximum power density of 537 and 826 mW cm−2, respectively. The Nafion-212 and recast Nafion membranes delivered a maximum power density of 599 and 598 mW cm−2, respectively. The power density of Nafion/PW-mGO was 1.38 fold higher than the Nafion-212 membrane (Fig. 5a). Furthermore, the Nafion/PW-mGO composite membrane also provided higher current density than the Nafion-212 and recast Nafion membranes. Generally, it is known that the fuel cell performance is closely related to the issue of water management. The Nafion/mGO membrane limited the availability of water at the anode, electro-osmotic drag of water from the anode to the cathode and insufficient water back-diffusion from the cathode to the anode causes the MEA to dehydrate owing to non-smooth and homogeneous state of membranes.
The fuel cell performance was further evaluated at 80 °C under 20% RH for all membranes (Fig. 5b). The Nafion/mGO and Nafion/PW-mGO composite membranes exhibited a maximum power density of 488 and 841 mW cm−2, respectively. The Nafion-212 and recast Nafion membranes delivered a maximum power density of 210 and 208 mW cm−2, respectively. The maximum power density of Nafion/mGO and Nafion/PW-mGO membranes was approximately 2.3- and 4.0-fold higher than the pristine Nafion-212 membrane, respectively (Table 2). The results of the fuel cell performance of Nafion/mGO and Nafion/PW-mGO composite membranes clearly showed an improved performance at low humidity, especially, the Nafion/PW-mGO composite membrane exhibited a remarkable enhancement of the fuel cell performance when operated at low RH compared to Nafion-212 and recast Nafion membranes. Even though, the Nafion/mGO composite membrane showed a lower maximum power density under fully RH conditions, they exhibited improved current density and power density under low humidity fuel cell operation. This can be attributed to the presence of oxygen functional groups, such as hydroxyl and carboxylic on the GO surface, which can be easily hydrated.24–27 These acidic functional groups and intermolecular hydrogen bonding can provide more proton conduction pathways in addition to Nafion sulfonic acid groups.24–27 It is obvious that Nafion/PW-mGO and Nafion–mGO exhibit substantially lower ohmic resistance than Nafion-212 and recast Nafion membranes (Table 2). The superior fuel cell performance could be exclusively attributed to the Nafion/PW-mGO composite membrane, as the electrode (anode and cathode) composition and preparation were kept identical for all membrane electrode assemblies. The maximum fuel cell power density of our Nafion/PW-mGO membrane operating at low humidity was compared with various Nafion composite membranes as listed in Table 3.28–35 The Nafion/PW-mGO composite membrane exhibited remarkably higher maximum power density under low RH compared with Nafion/TiO2 nanotube,15 Nafion/CsPMo,32 and Nafion/GO.34 Eventually, our composite membrane, Nafion/PW-mGO, showed the highest power density and to the best of the authors' knowledge, this is the highest maximum power density observed for Nafion composite membranes at low RH.
| Membranes | 80 °C, 100% RH | 80 °C, 20% RH | 100 °C, 100% RH | ||||||
|---|---|---|---|---|---|---|---|---|---|
| PD at 0.6 V | MR at 0.6 V | MPD | PD at 0.6 V | MR at 0.6 V | MPD | PD at 0.6 V | MR at 0.6 V | MPD | |
| a PD – power density (mW cm−2); MR – membrane resistance (Ohm cm2); MPD – maximum power density (mW cm−2). | |||||||||
| Recast Nafion | 526 | 0.13 | 599 | 80 | 0.12 | 209 | 453 | 0.16 | 490 |
| Nafion-212 | 556 | 0.14 | 598 | 90 | 0.10 | 210 | 462 | 0.18 | 500 |
| Nafion/mGO | 516 | 0.15 | 537 | 170 | 0.01 | 488 | 453 | 0.11 | 466 |
| Nafion/mGO-PW | 782 | 0.09 | 827 | 173 | 0.01 | 841 | 596 | 0.08 | 616 |
| Membranes | Max. power density/mW cm−2 | Conditions/%RH, T °C | Reference |
|---|---|---|---|
| NRE-212 | 210 | 20, 80 | This study |
| Recast Nafion | 208 | ||
| Nafion/mGO | 488 | ||
| Nafion/PW-mGO | 841 | ||
| Nafion/TiO2 nanoparticles | 327 | 25, 80 | 28 |
| Nafion/TiO2 nanotube | 641 | 18, 80 | 15 |
| Nafion/MZP | 350 | 18, 70 | 29 |
| Nafion/S-ZrO2 | 600 | 30, 70 | 30 |
| Nafion/SiO2 | 128 | 70, 110 | 31 |
| Nafion/SiO2-PWA | 216 | 70, 110 | 31 |
| Nafion/CsPMo | 420 | 35, 80 | 32 |
| Nafion/CsPW | 350 | 35, 80 | 32 |
| Nafion/modified PTA | 210 | 35, 120 | 33 |
| Nafion/GO | 600 | 40, 80 | 34 |
| Nafion/F-GO | 150 | 25, 120 | 26 |
| Nafion/graphite oxide | 212 | 25, 100 | 23 |
| Sulfonated GO paper | 100 | 25, 40 | 35 |
The fuel cell performance of composite membranes was evaluated and compared with recast Nafion and pristine Nafion-212 membranes under ∼100% RH at 100 °C and under ambient conditions (Fig. S4†). The Nafion-212 and Nafion/PW-mGO composite membranes provided the maximum power density of 489 and 616 mW cm−2, respectively. The power density of Nafion/PW-mGO and Nafion/mGO composite membranes at 0.6 V was 591 and 452 mW cm−2, respectively. The Nafion-212 and recast Nafion membranes delivered power density values of 463 and 453 mW cm−2, respectively, at the same potential. At 100 °C, the fuel cell performance of the Nafion/PW-mGO composite membrane was substantially higher than those of the recast Nafion and Nafion-212 membranes under 100% RH. The current density of the composite membranes was also higher than Nafion-212 and recast Nafion membranes. Next we compared the practical power density at 0.6 V of the Nafion/PW-mGO membrane at a cell operating temperature of 100 °C and was ultimately 1.3 times higher than that of the Nafion-212 membrane. The higher PEFC performance of the Nafion/PW-mGO composite membrane was obviously due to the hygroscopic properties and strong acid strength of PW cluster compounds, which can retain water at temperature higher than 100 °C.
To clarify the high performance of the composite membrane toward the Nafion-212 membrane, the proton conductivity of Nafion/mGO and Nafion/PW-mGO composite membranes was investigated by comparing with the conductivity results obtained from the Nafion-212 membrane. It has been demonstrated that the morphology of the Nafion membrane is composed of a hydrophobic PTFE back bone and a hydrophilic perfluoro sulfonic acid group (ionic cluster).5,8 The proton conductivity of the Nafion membrane highly depends on the water content adsorbed in the membrane. At low water content (low RH), the proton conductivity is low because insufficient water is absorbed in the ionic cluster, resulting in a lack of connectivity between ionic clusters. On the other hand, as more water is absorbed in the membrane (100% RH), the ionic cluster expands and eventually the expanded ionic clusters are connected to each other, yielding a great increase of proton conductivity.5,8Fig. 6 shows the proton conductivity of Nafion-212, Nafion/mGO, and Nafion/PW-mGO membranes under different RH conditions. The proton conductivity of the Nafion-212 membrane under 100% RH of humidified conditions was 98 mS cm−1 at 80 °C. The proton conductivity of the Nafion-212 membrane decreases as the RH value decreases; at 25% RH, the conductivity of the Nafion membrane was 6.5 mS cm−1. However, the Nafion/mGO composite membrane showed enhanced proton conductivity at all relative humidities and the proton conductivity under 100% RH conditions was 117 mS cm−1 at 80 °C, and at 25% RH, the conductivity of the Nafion/mGO membrane was 9.2 mS cm—1; it is expected that the end functional group of graphene oxide, which was adhered to APTES containing the amine group, was attracted to water via hydrogen interactions. It has been reported that the Nafion–graphene oxide composite membrane showed higher proton conductivity than the pristine Nafion membrane which was due to the hydrogen bonding with water leading to the formation of functional groups on the graphene oxide such as hydroxyl, carboxyl, and epoxy groups.26,27 The modified graphene oxide functioned similarly in the membrane and the high proton conductivity of the composite membrane is attributed to a Grotthus type mechanism, wherein reorganization of hydrogen bonds plays a vital role in hydrated graphene.26,27 The proton conductivity of the Nafion/PW-mGO composite membranes is the highest among these membranes at all RH values (Fig. 6). Under fully humidified conditions, the Nafion/PW-mGO composite membrane exhibits a maximum proton conductivity of 159 mS cm−1, and at 25% RH, it exhibits a conductivity of 10.4 mS cm−1. The presence of phosphotungstic acid clusters provides more facile hopping of protons, thereby increasing the proton transport. In other words, the Nafion/PW-mGO composite membrane has enhanced water-holding capacity due to the strong absorption of water on heteropolyanion clusters possessing hydronium ions, so that it serves to retain the proton conductivity.36 Generally, the polyoxometalates are capable of sustaining a large number of water molecules in their hydration sphere, and they behave like pseudo-liquids, so that the proton migration can be as effective as in aqueous electrolyte solutions.19 This effect is much influenced by the total hydration number at low hydration levels of the composite membrane. To verify the improved proton conductivity of the Nafion/PW-mGO composite membrane, the water uptake and ion exchange capacity were estimated. The proton conductivity of the membrane depends to a large extent on the amount of water uptake and ion exchange capacity.37 The water uptake of recast Nafion, Nafion/mGO, and Nafion/PW-mGO membranes was found to be 27, 32 and 37%, respectively, and the ion exchange capacity (IEC) of recast Nafion, Nafion/mGO, and Nafion/PW-mGO membranes was 0.88, 0.88 and 0.84 mmol g−1 at room temperature. The IEC of the Nafion/PW-mGO composite membrane was found to be lower than that of the Nafion membrane. The lower IEC value of the composite membrane can be attributed to the absence of the exchange of sodium ions during the titration, which could be due to the decrease of the number of ionic channels in the composite membrane.
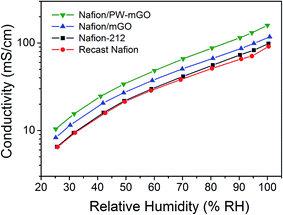 | ||
| Fig. 6 Proton conductivity of Nafion-212, Nafion/mGO, and Nafion/PW-mGO composite membranes measured under different relative humidities at 80 °C. | ||
Fig. S5a† presents the fuel cell durability studies of Nafion/PW-mGO and Nafion-212 membranes for 120 h under 18% RH at 80 °C. The OCV of the Nafion/PW-mGO and Nafion-212 membranes decreased from 1.03 to 0.95 V and 1.01 to 0.58 V, respectively. The Nafion/PW-mGO membrane showed a stabilized OCV within 10 h of operation, then the rate of OCV decrease is minimum. On the other hand, the Nafion-212 membrane showed a steep decrease in OCV and reached 0.5 V within a span of 120 h, indicating that PW clusters are strongly anchored to the mGO surface, thus providing better conductivity and exhibiting stable fuel cell performance.
The mechanical properties of the composite membrane were determined using a tensile test and compared with those of the recast Nafion membrane and the results are shown in Fig. S5b.† The Young's modulus of Nafion/PW-mGO and recast Nafion membranes was 243 and 159 MPa, respectively. On the other hand, the tensile strength of Nafion/PW-mGO and recast Nafion membranes was 13 and 11 MPa, respectively. The composite membrane exhibited higher maximum stress at break and Young's modulus than the recast Nafion membrane. This suggests that introducing the PW-mGO nanohybrid filler into the Nafion ionomer improves the mechanical properties of the composite membrane compared with the pristine Nafion membrane.
Conclusions
We successfully incorporated functionalized reduced GO with phosphotungstic acid into a Nafion membrane, which acts as a water resource at low relative humidity. The PW-mGO hybrid had a strong electrostatic interaction with both the counter cations on mGO and phosphotungstic acid. Also, phosphotungstic acid possesses a high amount of water molecules with their acidic properties and water bound conditions. Compared to Nafion-212 and Nafion/PW-mGO composite membranes, the Nafion/PW-mGO composite membranes exhibited remarkably better PEFC performance with operation under low RH.Experimental details
Preparation of graphene oxide
Graphene oxide (GO) was synthesized from graphite powder by a modified Hummers method.38 One gram of graphite powder (Sigma Aldrich) was thoroughly ground with sodium chloride (50 g, Daejung, Seoul, Korea) and the mixture was washed with de-ionized (DI) water and ethanol 5–10 times to remove sodium chloride. After drying, 4 mL of H2SO4 (Sigma Aldrich, 99%) was added and mixed with 0.84 g of K2S2O8 (Kanto, Japan) and P2O5 (Kanto, Japan) at 80 °C (375 rpm) for 4.5 h. After the mixture was cooled for 10–20 minutes, 167 mL of DI water was added and the mixture was stirred overnight at room temperature. The mixture was then filtered and washed using DI water and ethanol, and subsequently dried for 1 h. The collected powder was added to 40 mL of H2SO4 with 5 g of KMnO4 (Aldrich) in a two-neck flask placed in an ice bath and stirred slowly until the contents were completely dissolved. Then, 84 mL of DI water was added into the mixture, which was stirred for 2 h at 35 °C. Finally, more DI water (167 mL) was added along with 10 mL of H2O2 (Samchun, Korea) and the reaction was terminated via stirring for 30 minutes in an ice bath. The resulting mixture was centrifuged until reaching pH 7, and then a brown powder was collected after drying in a vacuum oven.Preparation of reduced graphene oxide (rGO)
Graphene oxide (GO, 1 g) was dispersed in 250 mL of DI water for 30 minutes. Five mL of hydrazine hydrate (Aldrich) was added into the mixture, which was then stirred for 4 h at 100 °C under a nitrogen atmosphere. Finally, the resulting mixture was filtered and washed until reaching pH 7, and then dried at 40 °C for 24 h in a vacuum oven.Preparation of modified graphene oxide (mGO)
Reduced graphene oxide (rGO, 0.1 g) was dispersed in 50 mL of toluene (Aldrich) for 30 min. 3-Aminopropyl-triethoxysilane (APTES, 0.1 g) was added into the rGO dispersion and the contents were stirred for another 3 h at 30 °C and for 3 h at 100 °C under a nitrogen atmosphere for the condensation reaction. Finally, the resulting mixture was filtered and dried at 40 °C for 24 h in a vacuum oven after washing residual APTES with toluene.Preparation of the PW-mGO hybrid material
Modified graphene oxide (mGO, 0.1 g) was dispersed in 20 mL water and sonicated in DI water for 30 min by using an ultrasonicator. Aqueous solutions of 20 mg mL−1 of phosphotungstic acid (H3PW12O40, PW) n-hydrate (Kanto, Tokyo, Japan) was added to the mGO dispersion and stirred for 24 h. Finally, the resulting contents were filtered and washed three times with DI water to remove the residual physically adsorbed PW on the mGO, and dried at 60 °C overnight in a vacuum oven.Preparation of the Nafion/PW-mGO composite membrane
PW-mGO or mGO was impregnated into the Nafion ionomer with a mass ratio of 1% and the resultant admixtures were ultra-sonicated for 30 min followed by mechanical stirring for 12 h. The composite membranes were prepared by casting these solutions onto a glass Petri dish and allowed to dry overnight at 80 °C using a vacuum oven. The formed composite membranes were peeled off and further dried at 120 °C for 5 h. For comparison, the Nafion ionomer was cast in a similar manner without any filler materials. The dry membrane thicknesses of all the composite membranes were measured at 5 random points over the surface using a digital micrometer and the average thickness was found to be ∼40 μm. Finally, the membranes were pre-treated by boiling in 5% H2O2, H2O, 0.5 M H2SO4 and H2O in sequence for 1 h in each case.Acknowledgements
This work was supported by the DGIST R&D Program (15-BD-01) of the Ministry of Education, Science and Technology of Korea. Part of this work was also supported by the Basic Science Research Program through the National Research Foundation of Korea (NRF) funded by the Ministry of Education, Science, and Technology (2014R1A1A2057056).References
- B. C. H. Steele and A. Heinzel, Nature, 2001, 414, 345–352 CrossRef CAS PubMed.
- S. M. Haile, D. A. Boysen, C. R. I. Chisholm and R. B. Merle, Nature, 2001, 410, 910–913 CrossRef CAS PubMed.
- Z. Zuo, Y. Fu and A. Manthiram, Polymers, 2012, 4, 1627–1644 CrossRef CAS PubMed.
- E. Aleksandrova, R. Hiesgen, A. Friedrich and E. Roduner, Phys. Chem. Chem. Phys., 2007, 9, 2735–2743 RSC.
- K. A. Mauritz and R. B. Moore, Chem. Rev., 2004, 104, 4535–4586 CrossRef CAS.
- K.-D. Kreuer, S. J. Paddison, E. Spohr and M. Schuster, Chem. Rev., 2004, 104, 4637–4678 CrossRef CAS.
- K. Schmidt-Rohr and Q. Chen, Nat. Mater., 2007, 7, 75–83 CrossRef PubMed.
- C. Wang, V. Krishnan, D. Wu, R. Bledsoe, S. J. Paddison and G. Duscher, J. Mater. Chem. A, 2013, 6, 938–944 Search PubMed.
- H. B. Aiyappa, S. Saha, P. Wadge, R. Benerjee and S. Kurungot, Chem. Sci., 2015, 6, 603–607 RSC.
- X. Liang, F. Zhang, W. Feng, X. Zou, C. Zhao, H. Na, C. Liu, F. Sun and G. Zhu, Chem. Sci., 2013, 4, 983–992 RSC.
- M. K. Mistry, N. R. Choudhury, N. K. Dutta, R. Knott, Z. Shi and S. Holdcroft, Chem. Mater., 2008, 20, 6857–6870 CrossRef CAS.
- H. L. Tang and M. Pan, J. Phys. Chem. C, 2008, 112, 11556–115568 CAS.
- A. K. Sahu, S. D. Bhat, S. Pitchumani, P. Sridhar, V. Vimalan, C. George, N. Chandrakumar and A. K. Shukla, J. Membr. Sci., 2009, 345, 305–314 CrossRef CAS PubMed.
- V. Baglio, A. S. Aricò, A. D. Blasi, V. Antonucci, P. L. Antonucci, S. Licoccia, E. Traversac and F. Serraino Fiory, Electrochim. Acta, 2005, 50, 1241–1246 CrossRef CAS PubMed.
- K. Ketpang, K. Lee and S. Shanmugam, ACS Appl. Mater. Interfaces, 2014, 6, 16734–16744 CAS.
- T. Kim, Y.-W. Choi, C.-S. Kim, T.-H. Yang and M.-N. Kim, J. Mater. Chem., 2011, 21, 7612–7621 RSC.
- W. Zhang, M. K. S. Li, P.-L. Yue and P. Gao, Langmuir, 2008, 24, 2663–2670 CrossRef CAS PubMed.
- Y. Kim and S. Shanmugam, ACS Appl. Mater. Interfaces, 2013, 5, 12197–12204 CAS.
- E. A. Ukshe, L. S. Leoniva and A. I. Korostelua, Solid State Ionics, 1989, 36, 219–223 CrossRef CAS.
- S. Shanmugam, B. Viswanathan and T. K. Varadarajan, J. Membr. Sci., 2006, 275, 105–109 CrossRef CAS PubMed.
- W. Liu, W. Mu, M. Liu, X. Zhang, H. Cai and U. Deng, Nat. Commun., 2014, 5, 3208, DOI:10.1038/ncomms4208.
- V. Ramani, H. R. Kunz and J. M. Fenton, J. Membr. Sci., 2004, 232, 31–44 CrossRef CAS PubMed.
- B. Stuart, Infrared Spectroscopy: Fundamentals and Applications, 2004 Search PubMed.
- R. Kumar, C. Xu and K. Scott, RSC Adv., 2012, 2, 8777–8782 RSC.
- R. Kannan, B. A. Kakade and V. K. Pillai, Angew. Chem., Int. Ed., 2008, 47, 2653–2656 CrossRef CAS PubMed.
- A. Enotiadis, K. Angjeli, N. Baldino, I. Nicotera and D. Gournis, Small, 2012, 8, 3338–3349 CrossRef CAS PubMed.
- H. Zarrin, D. Higgins, Y. Jun, Z. Chen and M. Fowler, J. Phys. Chem. C, 2011, 115, 20774–20781 CAS.
- R. R. Abbaraju, N. Dasgupta and A. V. Virkar, J. Electrochem. Soc., 2008, 155, B1307–B1313 CrossRef CAS PubMed.
- A. K. Sahu, S. Pitchumani, P. Sridhar and A. K. Shukla, Fuel Cells, 2009, 9, 139–147 CrossRef CAS.
- A. D' Epifanio, M. A. Navarra, F. C. Weise, B. Mecheri, J. Farrington, S. Licoccia and S. Greenbaum, Chem. Mater., 2010, 22, 813–821 CrossRef PubMed.
- Z.-G. Shao, P. Joghee and I.-M. Hsing, J. Membr. Sci., 2004, 229, 43–51 CrossRef CAS PubMed.
- M. Amirinejad, S. S. Madaeni, E. Rafiee and S. Amirinejad, J. Membr. Sci., 2011, 377, 89–98 CrossRef CAS PubMed.
- V. Ramani, H. R. Kunz and J. M. Fenton, Electrochim. Acta, 2005, 50, 1181–1187 CrossRef CAS PubMed.
- D. C. Lee, H. N. Yang, S. H. Park and W. J. Kim, J. Membr. Sci., 2014, 452, 20–28 CrossRef CAS PubMed.
- R. Kumar and K. Scott, Chem. Commun., 2012, 48, 5584–5586 RSC.
- J. Zeng and S. P. Jiang, J. Phys. Chem. C, 2011, 115, 11854–11863 CAS.
- K.-D. Kreuer, Chem. Mater., 1996, 8, 610–641 CrossRef CAS.
- W. S. Hummers and R. E. Offeman, J. Am. Chem. Soc., 1958, 80, 1339 CrossRef CAS.
Footnote |
| † Electronic supplementary information (ESI) available: Experimental and additional characterization data including TGA, CV stability and fuel cell performance under 100% RH at 100 °C. See DOI: 10.1039/c5ta00182j |
| This journal is © The Royal Society of Chemistry 2015 |

