 Open Access Article
Creative Commons Attribution 3.0 Unported Licence
A novel chiral phase of achiral hard triangles and an entropy-driven demixing of enantiomers
Anjan P.
Gantapara
a,
Weikai
Qi
ab and
Marjolein
Dijkstra
*a
aSoft Condensed Matter, Debye Institute for Nanomaterials Science, Utrecht University, Princetonplein 5, 3584 CC Utrecht, The Netherlands. E-mail: M.Dijkstra@uu.nl
bDepartment of Chemistry, University of Saskatchewan, 110 Science Place, S7N 5C9, Saskatoon, Canada
First published on 9th September 2015
Abstract
We investigate the phase behavior of a system of hard equilateral and right-angled triangles in two dimensions using Monte Carlo simulations. Hard equilateral triangles undergo a continuous isotropic–triatic liquid crystal phase transition at packing fraction ϕ = 0.7. Similarly, hard right-angled isosceles triangles exhibit a first-order phase transition from an isotropic fluid phase to a rhombic liquid crystal phase with a coexistence region ϕ ∈ [0.733, 0.782]. Both these liquid crystals undergo a continuous phase transition to their respective close-packed crystal structures at high pressures. Although the particles and their close-packed crystals are both achiral, the solid phases of equilateral and right-angled triangles exhibit spontaneous chiral symmetry breaking at sufficiently high packing fractions. The colloidal triangles rotate either in the clockwise or anti-clockwise direction with respect to one of the lattice vectors for packing fractions higher than ϕχ. As a consequence, these triangles spontaneously form a regular lattice of left- or right-handed chiral holes which are surrounded by six triangles in the case of equilateral triangles and four or eight triangles for right-angled triangles. Moreover, our simulations show a spontaneous entropy-driven demixing transition of the right- and left-handed “enantiomers”.
I. Introduction
Chirality plays an important role in nature, chemistry, and materials science. Chirality is present in cholesteric phases, which are nematic liquid crystals with a helical structure of the director field and which are frequently used in optoelectronic applications.1 Recently, chiral nanostructured materials have also received much attention due to their intriguing optical properties such as a huge optical activity, strong circular dichroism, photonic band gaps, and negative refractive indices.2–4 However, despite the huge amount of work devoted to chirality, the underlying microscopic features of the building blocks responsible for the formation of chiral self-assembled structures are extremely subtle and not well-understood. Even the most basic question if particle shape alone can lead to macroscopic chiral structures is still unknown. It has been theoretically demonstrated that an entropy-driven isotropic–cholesteric phase transition exists for hard helical particles, but these predictions have never been verified experimentally or by computer simulations.5–8An intriguing question would be whether or not achiral particles can self-assemble into chiral structures. Very recent experiments by Mason et al. on equilateral triangular colloidal platelets confined to two dimensions show an entropy-driven phase transition from the isotropic liquid to a triatic liquid crystal phase that displays three-fold symmetric orientational order.9 Surprisingly, at sufficiently high densities, small domains of chiral dimer pairs that are laterally shifted to one or the opposite direction, appear spontaneously in the triatic phase. The authors conjectured that the spontaneous local chiral symmetry breaking is due to an increase in rotational entropy and may be explained by a simple rotational cage model.9,10 However, a recent simulation study explained the emergent chirality observed in these experiments by the rounded corners of the particles which lead trivially to two degenerate crystal lattices of chiral dimer pairs at close-packing, thereby casting doubts on the role of rotational entropy in chiral symmetry breaking.11 In addition, these simulations showed that the chiral symmetry breaking is absent for perfect triangles, i.e., no particle corner rounding, which is to be expected as the close-packed structure of perfect triangles is an achiral triangular lattice. These findings are also consistent with a previous simulation study on perfect equilateral triangles, which shows only a simple transition from the isotropic to a liquid crystal phase at packing fraction ϕ = Nap/A = 0.57 with N the number of particles, A the area of the simulation box, and ap the particle area.12
In this paper, we reexamine the phase behavior of hard equilateral triangles in two dimensions by extensive Monte Carlo simulations and free-energy calculations. Surprisingly, we find the spontaneous formation of a novel chiral crystal phase, where the individual particles spontaneously undergo either a clockwise or anti-clockwise rotation with respect to one of the lattice vectors which give rise to a regular lattice of anti-clockwise or clockwise chiral holes. We find a similar chiral crystal phase in a system of right-angled triangles. More surprisingly, we also observe a spontaneous entropy-driven demixing transition of the “enantiomers” into left-handed and right-handed chiral phases. This paper is organized as follows. Section II introduces the model and simulation techniques we use to study the phase behavior of hard equilateral and right-angled isosceles triangles. In Section III, we report the simulation results and discuss the equations of state, free energy calculations and chiral symmetry breaking. In Section IV, we summarize the results.
II. Model and simulation methods
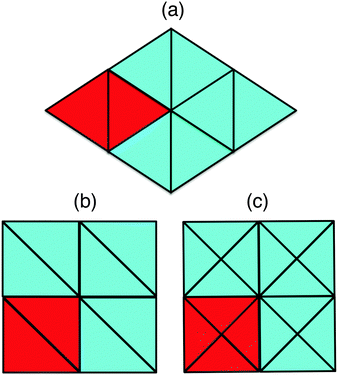
Hard equilateral and right-angled isosceles triangles tile the space in infinitely many ways as the rows and the columns of these triangles can be shifted without affecting their maximum packing density. At finite pressures hard triangles may form liquid crystal phases with orientational (quasi)-long-range order or solid phases with orientational and translational (quasi)-long-range order. To determine the phase behavior of hard equilateral and right-angled triangles, we perform Monte Carlo (MC) simulations and free-energy calculations. We use the separating axis theorem to detect particle overlaps.13 We perform variable-rectangular-box isothermal–isobaric (NPT) Monte Carlo simulations,14,15 in which we fix the number of particles, N = 3000–13![[thin space (1/6-em)]](https://www.rsc.org/images/entities/char_2009.gif) 000, the pressure P, and the temperature T. We compress the system from a low-density isotropic fluid phase to a solid phase by slowly increasing the pressure. We observe that a system of equilateral triangles undergoes a transition from an isotropic fluid phase to a triangular lattice with two particles in the unit cell as shown in Fig. 1a. On the other hand, right-angled triangles never crystallized in our compression runs within the simulation times that we considered, but only small rhombic crystalline domains with either two particles or four particles in the unit cell as shown in Fig. 1(b and c) appeared spontaneously in the system. The presence of two competing crystal structures with comparable free energies hampers most likely the crystallization of the right-angled triangles.
000, the pressure P, and the temperature T. We compress the system from a low-density isotropic fluid phase to a solid phase by slowly increasing the pressure. We observe that a system of equilateral triangles undergoes a transition from an isotropic fluid phase to a triangular lattice with two particles in the unit cell as shown in Fig. 1a. On the other hand, right-angled triangles never crystallized in our compression runs within the simulation times that we considered, but only small rhombic crystalline domains with either two particles or four particles in the unit cell as shown in Fig. 1(b and c) appeared spontaneously in the system. The presence of two competing crystal structures with comparable free energies hampers most likely the crystallization of the right-angled triangles.
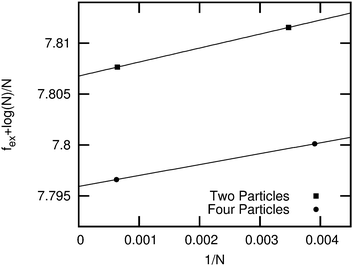
In order to determine the most stable thermodynamic phase of the two candidate crystal structures for right-angled triangles, we employ the Frenkel–Ladd method as described in ref. 16–18 to compute the free energies of both rhombic phases at packing fraction ϕ = 0.91. For more details regarding the implementation of this method, we refer the reader to ref. 16 and 19. We show fex + log![[thin space (1/6-em)]](https://www.rsc.org/images/entities/char_2009.gif) N/N as a function of 1/N in Fig. 2 for both candidate crystal structures. Here fex = Fex/NkBT is the excess free energy per particle, kB denotes Boltzmann's constant, N the number of particles, and T the temperature. We find in agreement with ref. 20 that fex + ln
N/N as a function of 1/N in Fig. 2 for both candidate crystal structures. Here fex = Fex/NkBT is the excess free energy per particle, kB denotes Boltzmann's constant, N the number of particles, and T the temperature. We find in agreement with ref. 20 that fex + ln![[thin space (1/6-em)]](https://www.rsc.org/images/entities/char_2009.gif) N/N is a linear function of 1/N with the intercept at 1/N = 0 corresponding to the excess free energy for the infinite system size. If we extrapolate the excess free energy to the thermodynamic limit (N → ∞), we observe that the rhombic lattice with four particles in the unit cell has a lower free energy than the one with two particles in the unit cell.
N/N is a linear function of 1/N with the intercept at 1/N = 0 corresponding to the excess free energy for the infinite system size. If we extrapolate the excess free energy to the thermodynamic limit (N → ∞), we observe that the rhombic lattice with four particles in the unit cell has a lower free energy than the one with two particles in the unit cell.
Subsequently, we determine the equations of state (EOS) from compression runs using the isotropic fluid phase as initial configuration in NPT Monte Carlo simulations with a variable box shape. Similarly, we obtain the EOS by expanding the stable close-packed crystal structures in NPT Monte Carlo simulations. To characterize the phases at high density, we determine the positional and orientational order at different packing fractions ϕ. To this end, we measure the n-fold bond-orientational and molecular orientational order parameters. The n-fold bond-orientational order parameter is given by
 | (1) |
 | (2) |
![[thin space (1/6-em)]](https://www.rsc.org/images/entities/char_2009.gif) 800 triangles in the canonical ensemble, i.e., the area A of the simulation box is kept fixed. Additionally, we measure the spatial correlation functions for the translational, bond-orientational and molecular orientational order, i.e., g(r), gBO6(r), and gMO6(r), respectively, for various packing fractions in order to determine whether the isotropic phase transforms into a liquid crystal or a crystal phase. The translational correlation function is given by
800 triangles in the canonical ensemble, i.e., the area A of the simulation box is kept fixed. Additionally, we measure the spatial correlation functions for the translational, bond-orientational and molecular orientational order, i.e., g(r), gBO6(r), and gMO6(r), respectively, for various packing fractions in order to determine whether the isotropic phase transforms into a liquid crystal or a crystal phase. The translational correlation function is given by | (3) |
 | (4) |
 is the six-fold local bond orientational order, r0 is the position of the central particles. The six-fold molecular orientational correlation function is defined as
 | (5) |
III. Results
A. Equilateral triangles
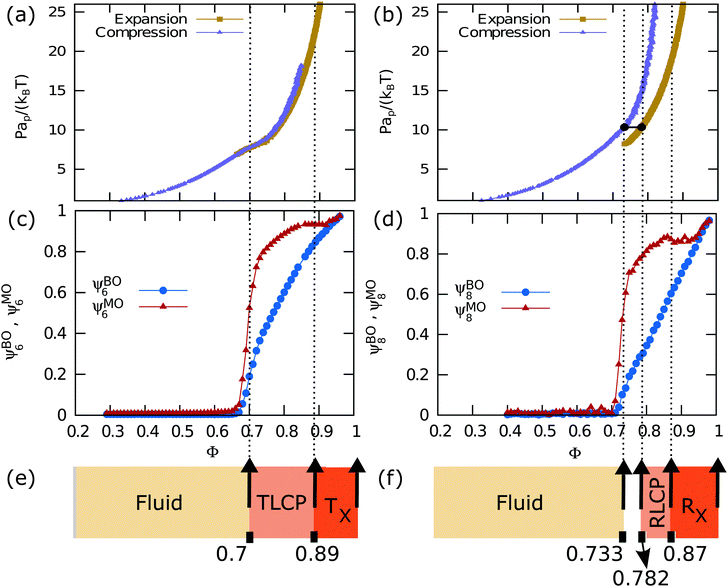
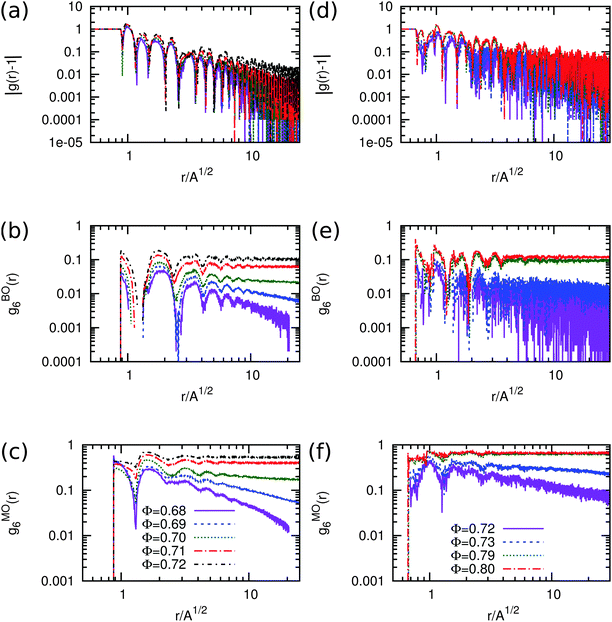
We first discuss our results for equilateral triangles. In Fig. 3(a and c), we show the equation of state (EOS) along with the bond orientational and molecular orientational order parameters as a function of packing fraction ϕ. Fig. 3(a) displays the EOS as obtained from both the compression and expansion runs. We observe that the system undergoes a continuous phase transition from an isotropic fluid phase to an ordered phase with three-fold symmetric orientational order upon compression. In addition, we observe that the close-packed triangular crystal melts continuously in an isotropic fluid phase during our expansion runs. In Fig. 3(c), we plot the 6-fold bond-orientational order parameters ψBO6 and molecular orientational order parameters ψMO6 as a function of packing fraction ϕ. Fig. 3(c) clearly shows that the systems develop bond-orientational and molecular orientational order for ϕ > 0.7 indicating a continuous phase transition from an isotropic fluid to a triatic phase. We note that the bond order parameter value ψBO6 is always lower than that for the molecular order ψMO6 at all packing fractions.In order to characterize the triatic phase in more detail, we also measure the correlation functions for the translational, bond-orientational and molecular orientational order for various packing fractions around the phase transition using Monte Carlo simulations of N = 12![[thin space (1/6-em)]](https://www.rsc.org/images/entities/char_2009.gif) 800 particles in the canonical ensemble. The results are shown in Fig. 4(a–c). The radial distribution function g(r) which indicates the correlations in the translational order show exponential decay for packing fractions ϕ < 0.7, which is to be expected as there is no long-range positional order present in liquid crystals. The 6-fold bond-orientational gBO6(r) and 6-fold molecular orientational gMO6(r) correlation functions show quasi-long-range orientational order for ϕ > 0.7 within the system sizes that we used. The presence of (quasi) long-range bond order and molecular orientational order and the absence of long-range positional order for ϕ > 0.7 are characteristic of liquid crystalline phases.9 Hence, we find that a system of equilateral triangles undergoes a continuous phase transition from an isotropic fluid phase to a triatic liquid crystal phase at packing fraction ϕ = 0.7. Upon further compression, the triatic liquid crystal phase transforms continuously into a crystal phase at a packing fraction ϕ > 0.87.
800 particles in the canonical ensemble. The results are shown in Fig. 4(a–c). The radial distribution function g(r) which indicates the correlations in the translational order show exponential decay for packing fractions ϕ < 0.7, which is to be expected as there is no long-range positional order present in liquid crystals. The 6-fold bond-orientational gBO6(r) and 6-fold molecular orientational gMO6(r) correlation functions show quasi-long-range orientational order for ϕ > 0.7 within the system sizes that we used. The presence of (quasi) long-range bond order and molecular orientational order and the absence of long-range positional order for ϕ > 0.7 are characteristic of liquid crystalline phases.9 Hence, we find that a system of equilateral triangles undergoes a continuous phase transition from an isotropic fluid phase to a triatic liquid crystal phase at packing fraction ϕ = 0.7. Upon further compression, the triatic liquid crystal phase transforms continuously into a crystal phase at a packing fraction ϕ > 0.87.
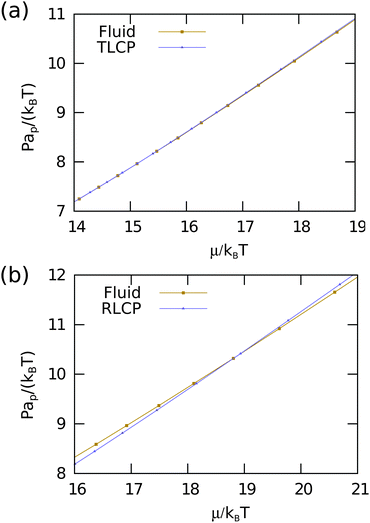
To corroborate our findings, we also compute the free energies for equilateral triangles using the Frenkel–Ladd method.17 We use the Widom particle insertion technique to determine the chemical potential and hence the free energy of the isotropic fluid phase at fixed density. Using thermodynamic integration of the equation of states we compute the free energy per particle f = F/(NkBT) as a function of packing fraction for the isotropic fluid, triatic liquid crystal and triatic crystal phases. Subsequently, we determine the phase behavior. To this end, we first compute the chemical potential μ/kBT of both systems from the free energies and plot the reduced pressure Pap/kBT as a function of chemical potential in Fig. 5(a). The fluid and liquid crystal branch do not cross in the case of equilateral triangles, which supports our finding that the isotropic fluid-triatic liquid crystal phase transition is continuous. In addition, we find that the liquid crystal branch transforms continuously into the solid branch, indicating a continuous triatic liquid crystal-triatic crystal transition.
B. Right-angled isosceles triangles
We now turn our attention to the right-angled isosceles triangles. In Fig. 3(b), we present the equation of state (EOS) as obtained from both the compression and expansion runs. Upon compression of the isotropic fluid phase, we observe no crystallization during our NPT simulations, but only the spontaneous formation of small crystalline domains. In addition, we observe that the rhombic crystal phase with four particles in the unit cell, which is the stable crystal phase according to our free-energy calculations, undergoes a first-order phase transition to an isotropic fluid phase at sufficiently low pressures. The 8-fold bond orientational and molecular orientational order parameters, ψBO8 and ψMO8, as displayed in Fig. 3(d) show that the system develops bond-orientational and molecular-orientational order for ϕ > 0.7. We note again that the bond order parameter value ψBO8 is always lower than that for the molecular order ψMO8 for all values of ϕ.In order to investigate the range of the positional and orientational order of the rhombic phase, we calculate the correlation functions for the translational, bond-orientational and molecular orientational order as a function of packing fraction ϕ. We present the correlation functions in Fig. 4(d–f). Again, we find that the g(r) shows exponential decay for ϕ < 0.79, and becomes only quasi-long-range for ϕ ≥ 0.79. The bond-orientational gBO8(r) and molecular orientational gMO8(r) correlation functions show quasi-long-range orientational order for ϕ ≥ 0.79 for the system sizes that we used. We thus find that a system of right-angled triangles undergoes a first-order phase transition from an isotropic fluid phase to a rhombic liquid crystal phase, and shows subsequently a continuous phase transition to a rhombic solid phase at ϕ = 0.89.
To determine the phase boundaries of the isotropic fluid-rhombic liquid crystal phase transition, we determine the free energies of the two phases using the methods as described above in Section III A. Fig. 5(b) shows the reduced pressure Pap/kBT as a function of the chemical potential μ/kBT for the isotropic fluid, rhombic liquid crystal, and rhombic crystal phase. We find a clear crossover of the fluid and rhombic liquid crystal branch corresponding to a first-order phase transition with a coexistence region ϕ ∈ [0.733, 0.782]. Additionally, the rhombic liquid crystal branch transforms continuously into a rhombic crystal branch, and hence the transition from a rhombic liquid crystal to a rhombic crystal is continuous.
C. Chiral symmetry breaking
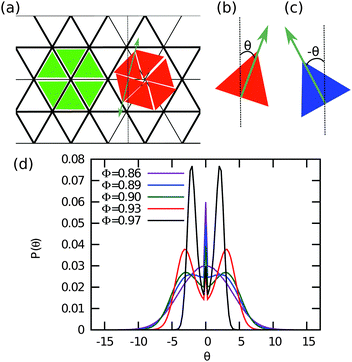
Finally, we investigate whether or not the systems of equilateral and right-angled triangles show chiral symmetry breaking similar to that was reported in the experiments of ref. 9. We perform Monte Carlo simulations of 5000 ≤ N ≤ 12![[thin space (1/6-em)]](https://www.rsc.org/images/entities/char_2009.gif) 000 triangles in the canonical ensemble. We calculate the orientational distribution function P(θ), where θ is the angle that a triangle has with respect to a fixed axis (x-axis) as shown in Fig. 6(b and c). Since the probability distribution to find anti-clockwise or clockwise orientational displacements should be symmetric, i.e., P(θ) = P(−θ), we average the distributions for negative and positive θ to get smoother probability distributions. We plot P(θ) as a function of θ in Fig. 6(d) for equilateral triangles and varying packing fractions ϕ. We clearly observe that the unimodal distribution at low ϕ splits into three distinct peaks at ϕχ = 0.89 for equilateral triangles. The central peak corresponds to particles oriented along the lattice vector while the remaining two peaks correspond to particles, which have either anti-clockwise or clockwise orientational displacements.
000 triangles in the canonical ensemble. We calculate the orientational distribution function P(θ), where θ is the angle that a triangle has with respect to a fixed axis (x-axis) as shown in Fig. 6(b and c). Since the probability distribution to find anti-clockwise or clockwise orientational displacements should be symmetric, i.e., P(θ) = P(−θ), we average the distributions for negative and positive θ to get smoother probability distributions. We plot P(θ) as a function of θ in Fig. 6(d) for equilateral triangles and varying packing fractions ϕ. We clearly observe that the unimodal distribution at low ϕ splits into three distinct peaks at ϕχ = 0.89 for equilateral triangles. The central peak corresponds to particles oriented along the lattice vector while the remaining two peaks correspond to particles, which have either anti-clockwise or clockwise orientational displacements.
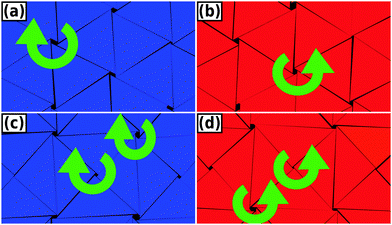
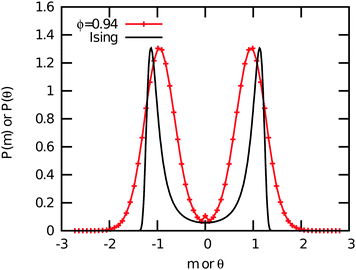
In Fig. 7, we show typical configurations for a system of equilateral triangles at ϕ = 0.97 and ϕ = 0.98. The triangles with a negative θ, which are shifted anti-clockwise, are colored blue, whereas the triangles with a positive θ are colored red. The particles with an orientational displacement corresponding to the central peak in P(θ) are colored green. Surprisingly, we find a clear phase separation between a phase with (blue) triangles that are rotated anti-clockwise and a phase with (red) particles that are twisted clockwise. The two coexisting phases are separated by an interface of (green) particles that show no appreciable twist. We thus find an achiral triatic phase at ϕ < 0.89, whereas the system phase separates into left- and right-handed chiral phases for ϕ > 0.89. Moreover, we find that the peaks corresponding to the two coexisting chiral phases become more pronounced upon increasing ϕ, and hence the interfacial free energy increases with ϕ. We thus find that the phase behavior of hard triangles is remarkably similar to that of the Ising model, which shows spontaneous magnetization and phase coexistence between two magnetic phases at sufficiently low temperatures. We therefore compared the orientational distribution function of the triangles with the probability distribution function of the magnetization of the Ising model in order to investigate if the demixing transition of triangles corresponds to the Ising universality class. In Fig. 10, we show that the order parameter distribution functions do not match, and we conclude that the demixing transition of the enantiomers should correspond to another universality class, e.g., the six-state clock model. Finally, we wish to remark that the value of the most likely rotational shift θ decreases with increasing ϕ as expected since the rotational displacement equals zero for all triangles in the achiral crystal phase at close-packing. A similar chiral symmetry breaking and phase separation is also observed for right-angled triangles (not shown). In this case, the transition from an achiral to a chiral phase occurs at ϕχ = 0.87.
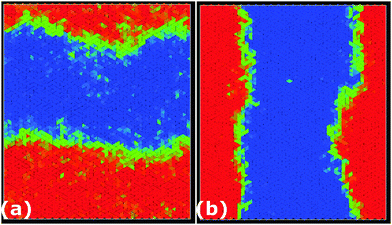 | ||
| Fig. 7 Typical configurations of equilateral triangles at packing fractions ϕ = 0.97 (a) and ϕ = 0.98 (b). The color coding of the particles is the same as in Fig. 6. Left-handed enantiomers are colored blue while right-handed enantiomers are colored red. The remaining particles are colored green. A clear phase boundary can be seen separating the two coexisting right- and left-handed chiral phases. | ||
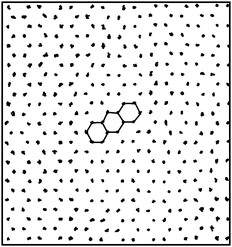
In Fig. 8, we show a close-up look of these chiral configurations for both the equilateral and right-angled triangles. We observe that the collective orientational displacements of the triangles lead to a hexagonal lattice of clockwise or anti-clockwise chiral holes, which are surrounded by six triangles in the case of equilateral triangles. The appearance of these chiral holes due to the collective rotation of six triangles is also illustrated schematically in Fig. 6(a). In the case of right-angled triangles the collective orientational displacements lead to a square lattice of chiral holes, which are surrounded by either four or eight triangles. We used curved arrows to indicate clockwise and anti-clockwise holes in Fig. 8. It is worth mentioning that for long simulation times the system should display either a pure left-handed or right-handed chiral phase, as it costs interfacial free energy to have a phase-separated configuration with the interface. Due to the long equilibration times the system frequently remains phase separated within the simulation times of our Monte Carlo runs. In order to investigate whether or not the “twisted” triangles are still positioned on a regular lattice, we projected the center-of-masses of the equilateral triangles as obtained from 20 different equilibrated configurations at a packing fraction ϕ = 0.91 on a plane in Fig. 9. We find that the center-of-masses of the particles form a regular honeycomb lattice with long-range positional order. In addition, we also computed the lateral shifts between neighboring triangles at high densities as also computed by the authors of ref. 9 and 11. Our results are in agreement with the earlier simulation results of ref. 11 that there is no split in the probability distributions of these lateral shifts for perfect hard triangles.
IV. Phase diagram and conclusions
In summary, we have studied a two-dimensional system of equilateral triangles and right-angled isosceles triangles using large-scale Monte Carlo simulations. We have computed the equations of state, and bond-orientational and molecular orientational order parameters as a function of packing fraction ϕ. In addition, we calculated the free energies as a function of packing fraction for the isotropic fluid phase, the liquid crystal phase, and the solid phase. We also measured the spatial correlation functions for the translational, bond-orientational, and molecular orientational order. We mapped out the phase diagram of both equilateral triangles and right-angled triangles by combining these results. In Fig. 3(e and f) we summarized the phase behavior using different colors. We indicate the different phase transitions by vertical dotted lines as a guide to the eye across the different graphs. We show that hard equilateral triangles and hard right-angled triangles undergo a phase transition from an isotropic phase to a triatic and rhombic liquid crystal phase, respectively. The phase transition from the isotropic to triatic liquid crystal phase is continuous for equilateral triangles, whereas we find a first-order phase transition from the isotropic fluid to the rhombic liquid crystal phase for the right-angled triangles with a coexistence region ϕ ∈ [0.733, 0.782]. With increasing pressure these liquid crystal phases continuously transform to their respective close-packed crystal structures. These close-packed crystalline phases exhibit at sufficiently high packing fractions spontaneous chiral symmetry breaking as the triangles rotate either in the clockwise or anti-clockwise direction with respect to a fixed lattice vector. We denote the chiral triatic phase and the chiral rhombic phase by Tχ and Rχ, respectively, in the phase diagram shown in Fig. 3(e and f). We also observe a spontaneous purely entropy-driven demixing of the “enantiomers” resulting in phase coexistence of the left- and right-handed chiral phase with a clear interface. To the best of our knowledge, our work presents the first observation of a spontaneous macroscopic chiral symmetry breaking and entropy-driven demixing of “enantiomers” of achiral building blocks. The chiral symmetry breaking in the system of rounded hard triangles involves an underlying lattice that is chiral,9,11 however, the chiral symmetry breaking in systems of equilateral triangles and right-angled isosceles triangles occurs due to the formation of chiral clusters of particles, which are twisted around a common center. These chiral particle clusters exhibit either a clockwise or a counter-clockwise twist, and domains of these enantiomeric clusters form a regular achiral honeycomb lattice.Finally, we wish to remark that the isotropic-to-liquid-crystal phase transition points in equilateral triangles as determined in experiments and in an earlier simulation study9,12 are 15% off from our simulation results. Additionally, the EOS as shown in Fig. 1 of ref. 12 does not match with our EOS obtained from our isotensic NPT Monte Carlo simulations. We attribute this discrepancy with earlier simulation results12 to the fact that these molecular dynamics simulations were performed with a fixed box shape, which may lead to non-zero stress. We verified this by Monte Carlo simulations of hard triangles in a fixed box shape, which indeed show that the isotropic-to-liquid-crystal phase transition happens at lower packing fraction compared to simulations with a variable box shape. The mismatch with the experimental9 isotropic–liquid-crystal phase transition point is likely due to the fact that the particle interactions in the experimental system cannot be described by excluded-volume interactions, which may be caused by the presence of depletants, charges, and polydispersity.9,22
References
- P. de Gennes and J. Prost, The Physics of Liquid Crystals, 1993 Search PubMed.
- E. Plum, J. Zhou, J. Dong, V. A. Fedotov, T. Koschny, C. M. Soukoulis and N. I. Zheludev, Phys. Rev. B: Condens. Matter Mater. Phys., 2009, 79, 035407 CrossRef.
- J. B. Pendry, Science, 2004, 306, 1353 CrossRef CAS PubMed.
- A. Chutinan and S. Noda, Phys. Rev. B: Condens. Matter Mater. Phys., 1998, 57, R2006 CrossRef CAS.
- J. P. Straley, Phys. Rev. A: At., Mol., Opt. Phys., 1973, 8, 2181 CrossRef CAS.
- T. Odijk, J. Phys. Chem., 1987, 91, 6060 CrossRef CAS.
- S. Belli, S. Dussi, M. Dijkstra and R. van Roij, Phys. Rev. E: Stat., Nonlinear, Soft Matter Phys., 2014, 90, 020503 CrossRef CAS.
- S. Dussi, S. Belli, R. van Roij and M. Dijkstra, J. Chem. Phys., 2015, 142, 074905 CrossRef PubMed.
- K. Zhao, R. Bruinsma and T. G. Mason, Nat. Commun., 2012, 3, 801 CrossRef PubMed.
- K. Zhao and T. G. Mason, J. Am. Chem. Soc., 2012, 134, 18125 CrossRef CAS PubMed.
- S. P. Carmichael and M. S. Shell, J. Chem. Phys., 2013, 139, 164705 CrossRef PubMed.
- M. Benedict and J. F. Maguire, Phys. Rev. B: Condens. Matter Mater. Phys., 2004, 70, 174112 CrossRef.
- D. Eberly, Intersection of Convex Objects: The Method of Separating Axes, 2008, http://www.geometrictools.com.
- L. Filion, M. Marechal, B. van Oorschot, D. Pelt, F. Smallenburg and M. Dijkstra, Phys. Rev. Lett., 2009, 103, 188302 CrossRef.
- J. de Graaf, R. van Roij and M. Dijkstra, Phys. Rev. Lett., 2011, 107, 155501 CrossRef.
- A. P. Gantapara, J. de Graaf, R. van Roij and M. Dijkstra, Phys. Rev. Lett., 2013, 111, 015501 CrossRef.
- D. Frenkel and B. Smit, Understanding Molecular Simulation, Academic Press, Inc., Orlando, FL, USA, 2nd edn, 2001 Search PubMed.
- M. Dijkstra, Adv. Chem. Phys., 2015, 156, 35 CAS.
- W. Qi, J. de Graaf, F. Qiao, S. Marras, L. Manna and M. Dijkstra, J. Chem. Phys., 2013, 138, 154504 CrossRef PubMed.
- J. Polson, E. Trizac, S. Pronk and D. Frenkel, J. Chem. Phys., 2000, 112, 5339 CrossRef CAS PubMed.
- D. R. Nelson and B. I. Halperin, Phys. Rev. B: Condens. Matter Mater. Phys., 1979, 19, 2457 CrossRef CAS.
- K. Mayoral and T. G. Mason, Soft Matter, 2014, 10, 4471 RSC.
| This journal is © The Royal Society of Chemistry 2015 |

