 Open Access Article
Galvanic replacement synthesis of AgxAu1−x@CeO2 (0 ≤ x ≤ 1) core@shell nanospheres with greatly enhanced catalytic performance†
Dapeng
Liu
a,
Wang
Li
a,
Xilan
Feng
a and
Yu
Zhang
*ab
aKey Laboratory of Bio-Inspired Smart Interfacial Science and Technology of Ministry of Education, School of Chemistry and Environment, Beihang University, Beijing 100191, China. E-mail: jade@buaa.edu.cn
bInternational Research Institute for Multidisciplinary Science, Beihang University, Beijing 100191, P. R. China
First published on 7th September 2015
Abstract
A galvanic replacement strategy has been successfully adopted to design AgxAu1−x@CeO2 core@shell nanospheres derived from Ag@CeO2 ones. After etching using HAuCl4, the Ag core was in situ replaced with AgxAu1−x alloy nanoframes, and void spaces were left under the CeO2 shell. Among the as-prepared AgxAu1−x@CeO2 catalysts, Ag0.64Au0.36@CeO2 shows the optimal catalytic performance, whose catalytic efficiency reaches even 2.5 times higher than our previously reported Pt@CeO2 nanospheres in the catalytic reduction of 4-nitrophenol (4-NP) by ammonia borane (AB). Besides, Ag0.64Au0.36@CeO2 also exhibits a much lower 100% conversion temperature of 120 °C for catalytic CO oxidation compared with the other samples.
1. Introduction
For heterogeneous catalysis, reactions often take place at the surface of catalysts or at the interface of hybrid catalysts, so highly active surface/interface sites will greatly favor enhancing their catalytic activities. However under harsh working conditions these nanocatalysts are apt to lose their activities gradually during cycling caused by serious surface contamination or aggregation and hence a declined adsorption–desorption capability of the substrate molecules. In most cases the noble metal catalysts could show better catalytic stability if these active components were encapsulated by inert shells to form core@shell nanostructures. To date, a series of noble metal@oxide core@shell nanostructures, including Au@TiO2,1 Au@SiO2,2 Au@ZnO,3,4 Au@Cu2O,5,6 Pt@CeO2,7 Au@CeO2 (ref. 8), etc., have been successfully fabricated via direct coating processes or templating strategies. However, the improvement of the catalytic stability is more or less based on sacrificing the catalytic activity of catalysts due to decreased active sites. It is hard to consider the catalytic activity and stability of one catalyst at the same time, so a feasible and effective way has been developed by loading active centers on supports with more open structures such as metal organic frameworks9–13 and porous oxides.14 In consideration of these, they all point to an ideal core@shell nanostructure that contains an active noble metal core with a hollow structure to provide enough void spaces for reactions, has an inert shell with a suitable thickness to prevent mass transfer, and rich porosity to allow the substrate molecules passing through to easily be in contact with the active core sites. More importantly, the good synergistic effects between the core and shell components might further help improve their catalytic performance.The green synthesis of noble metal@CeO2 core@shell hybrid nanocatalysts has been a research highlight in recent years, which brings at least two remarkable advantages: (1) the facile and fast mass production to gram scale in aqueous solution without the addition of any organics; (2) a naked surface/interface as well as strong synergistic effects between the noble metal and CeO2. The key principle during the synthesis should be the auto-redox reaction by activating Ce3+ ions to reduce the high-valence-state noble metal ions, spontaneously forming the final noble metal@CeO2 core@shell hybrid nanostructures.7,15–17 For example, Kayama and coworkers reported good work on Ag@CeO2 nanospheres for a catalytic CO oxidation reaction.16,17 Before long, our group also succeeded in modulating the size of Pt@CeO2 (ref. 7) and Pd@CeO2 (ref. 15) nanospheres and optimizing their size-dependent catalytic properties in catalytic CO oxidation.
Besides the synthesis, creating void spaces in situ in the core@shell nanostructure becomes another challenge to the above-mentioned ideal structure until the development of a hard-templating strategy in combination with selective etching processes, like coordination etching18,19 and galvanic replacement.20–23 For the former, the etching is triggered by some kind of special intermolecular coordination interactions. Meanwhile the entropy-driven process determines the formation of the final products. Typically, the precipitate with a higher Ksp is easy to be converted to another one with a lower Ksp value. Guo's group adopted this similar principle to create a series of transition meal oxide nanocages using Cu2O as the template.18 For the latter, the redox relationship among the different kinds of substrates has also been employed, which is called a galvanic replacement reaction that happens between the oxidative metal ions and the reductive substrate. Xia et al. showed us excellent work on the synthesis of AgAu alloy nanoboxes, nanorattles and multi-walled nanoshells/nanotubes via the galvanic replacement.20,21 Besides noble metals, such a replacement reaction has also been successfully extended to the metal oxide systems. The current representative result confirms that the replacement reaction can be triggered between Mn3O4 and Co2+, resulting in hollow Co3O4 nanocages.22
After careful consideration, the galvanic replacement reaction was thought to be suitable for designing the above-mentioned ideal core@shell structures. It is noticed that the reduction potentials of Ag+/Ag and AuCl4−/Au pairs are 0.80 V and 0.99 V vs. SHE, respectively. Such a potential difference makes it feasible to replace Ag components by Au through the galvanic replacement reaction between AuCl4− and Ag0. Additionally, one AuIII ion could oxidize three Ag0 atoms, resulting in AgxAu1−x alloy nanoframes if the Ag core was etched partially. So the issues are now focused on how to prepare the Ag@CeO2 nanospheres and how to control the replacement reaction to obtain the desired AgxAu1−x@CeO2 nanospheres from the viewpoint of material design.
In this paper, we demonstrate a green auto-redox reaction between AgNO3 and Ce(OH)3 for the synthesis of Ag@CeO2 nanospheres as templates, and then adopt the galvanic replacement strategy to oxidize the Ag core in order to prepare the final AgxAu1−x@CeO2 nanospheres. No organics were introduced into this reaction system during the whole synthetic process as shown in Scheme 1. After systematic structure characterization, the catalytic performance of the AgxAu1−x@CeO2 samples was also evaluated using the two typical model reactions of catalytic reduction of 4-NP by AB and catalytic CO oxidation.
2. Results and discussion
2.1 Structure characterization
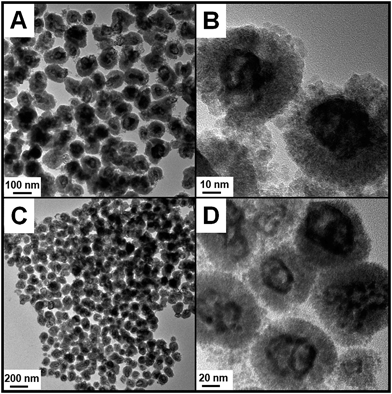
Ag@CeO2 core@shell nanospheres were prepared according to a previous report except for some modification.16,17 Here, we increase the molar ratio of Ce/Ag from 2/3 to 1/1 so as to realize a more compact encapsulation of CeO2 on Ag cores. The transmission electron microscopy (TEM) images in Fig. S1† show that every Ag@CeO2 core@shell nanosphere is composed of an Ag core with an average size of 45 nm and a close-packed shell of 5 nm-sized CeO2 nanoparticles.After introducing HAuCl4 into the solution, the galvanic replacement reaction was triggered. As shown in the TEM image (Fig. 1A), the final products well maintained the original monodispersed sphere-like morphology. However, the enlarged TEM image (Fig. 1B) clearly shows that the initial Ag cores began to become void, indicating the successful etching process. EDX analysis (Fig. S2†) provides the affirmative proof of the presence of an Au signal beside the original ones of Ag and Ce elements. The molar ratio of Ag/Au determined using ICP is 0.64/0.36, so we abbreviate this Ag rich product as Ag0.64Au0.36@CeO2. If the feeding amount of HAuCl4 was further increased, the Au-rich products should be produced. As expected, when the amount of HAuCl4 was increased from 0.3 to 0.6 mL, the initial solid Ag cores were etched more deeply, which left obvious voids without breaking the external morphology of these nanospheres and changed their size as observed from the TEM images (Fig. 1C and D). After the determination using ICP, the Au-rich product was named as Ag0.41Au0.59@CeO2 according to the Ag/Au ratio. From the powder X-ray diffraction (XRD) patterns of the AgxAu1−x@CeO2 samples in Fig. S3,† it can be seen that the diffraction peaks at 2θ = 28.6°, 33.1°, 47.3° and 56.4° are in good accordance with the standard diffraction peaks of the fluorite-phase CeO2 crystals, while the other diffraction peaks at 2θ = 38.2°, 44.3°, 64.5° and 77.6° could be attributed to the noble metal cores. However, owing to the structural similarity between Ag and Au, it is hard to directly distinguish the shift of AgxAu1−x alloys compared with pure Ag or Au. However, the intensity of the peak at 38.2° obviously increased with the larger content of Au. In combination with the EDX spectrum (Fig. S4†), the X-ray photoelectron spectroscopy (XPS) (Fig. S5 and S6†) and ICP analyses can confirm the successful formation of the AgAu alloys instead of the pure Ag cores.
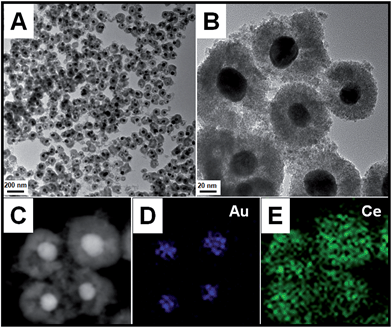
If excess HAuCl4 was added in the reaction solution, the thoroughly replaced product of Au@CeO2 core@shell nanospheres could be obtained. TEM images in Fig. 2A and B show that for each nanosphere the shell part is still built up of sub-5 nm CeO2 nanoparticles. The Au core beneath the shell can be distinguished by their deeper contrast from CeO2. However, a sub-30 nm Au particle as a single core, rather than the initial 45 nm sized Ag, is located in the center of the CeO2 aggregates. The high-angle annular dark-field scanning transmission electron microscopy (HAADF-STEM) images (Fig. 2C–E) effectively show the distribution of the Au and Ce components in the nanospheres and that the Ce element spreads everywhere and Au only exists in the center of the nanosphere. No Ag signal can be detected, indicating that the replacement reaction is quite complete. The XRD pattern of the as-obtained sample (Fig. S3†) matches well with those of Ag@CeO2, Ag0.64Au0.36@CeO2, and Ag0.41Au0.59@CeO2. The XPS spectra (Fig. S7†) identify that the two peaks at 349.9 eV and 340.4 eV correspond well to the Au 3d5/2 and 3d3/2 spin orbit peaks of Au, respectively, while the peaks at 881.9 eV and 900.2 eV can be assigned to Ce 3d5/2 and 3d3/2 spin orbit peaks, respectively.
2.2 Influence on the structure evolution
According to the references, the galvanic replacement of Ag by HAuCl4 proceeds as follows:| Ag + HAuCl4 → Au↓ + AgCl↓ |
Two scenarios often appeared during the similar fabrication of AgxAu1−x alloy nanoframes, that is, (1) Au nucleates independently in the solution rather than on the initial Ag nanostructures; (2) Au crystallizes on the exposed Ag faces or on the edge of the Ag nanostructures. We notice that in our case the Ag@CeO2 template is in a core@shell structure which should not be good for effectively removing the byproduct of AgCl precipitation from the core position during the reaction, so a large excess of NaCl was introduced to dissolve the produced AgCl.24 However, it is unexpected that the original Ag cores disappeared as well and left hollow CeO2 nanospheres. Meanwhile, most of the Au nanoparticles actually nucleated on the outer face of the CeO2 shell as shown in Fig. S8.† Moreover, such a self-nucleation tendency became stronger when further increasing the feeding amount of HAuCl4. The galvanic replacement reaction was obviously out of control. The following reasons are supposed to account for the undesired result. Firstly, the CeO2 shell, as a hard template, limited the core space that couldn't provide enough room to stand the volume expansion during the galvanic replacement reaction. Since the constantly produced AgCl would occupy the core before dissolving, Au had to nucleate on the outer surface of the CeO2 shell. Secondly, referenced to a previous report,16 it is found that the aggregated CeO2 shell of Ag@CeO2 might be not enclosed enough, leaving a possible route for the overflow of Au. So two improvements to the synthesis were developed to optimize the galvanic replacement reaction: (1) increasing the feeding molar ratio of Ce/Ag from 2/3 to 1/1 to make the CeO2 shell packed more compactly so as to prevent Au from overflowing; (2) introducing excess NH4Ac along with NaCl. The co-presence of NH4Ac and NaCl was identified as more effective for the dissolution of the AgCl precipitate to provide enough core space for the growth of Au, though under the more compact CeO2 shell.
2.3 Catalytic test
 | ||
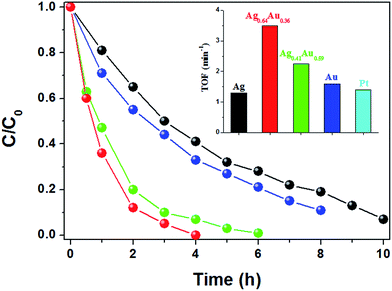
| Fig. 3 Catalytic reduction of 4-NP by Ag@CeO2 (black), Ag0.64Au0.36@CeO2 (red), Ag0.41Au0.59@CeO2 (green) and Au@CeO2 (blue). Inset: calculated TOF compared with Pt@CeO2.7 | ||
In this work, the Ag rich sample of Ag0.64Au0.36@CeO2 shows the optimal catalytic property compared with others. This result firmly proves that composition is a main factor for the catalytic performance. Besides, the hollow core@shell nanostructures of Ag0.64Au0.36@CeO2 and Ag0.41Au0.59@CeO2 are believed to be another key factor to influence their activities, because enough voids would facilitate the contact of 4-NP and AB on the surface of the AgxAu1−x alloy nanoframes more easily, favoring the fast diffusion of the reactants and the final products through the CeO2 shell as described by Tang et al.33
3. Conclusions
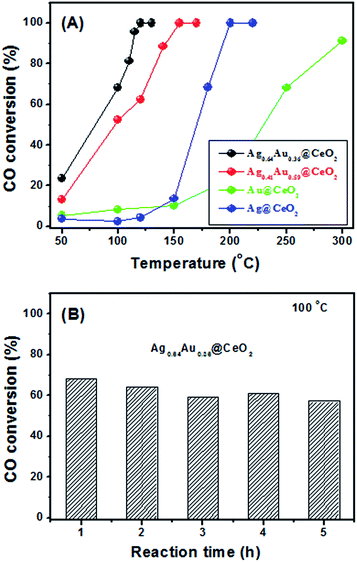
Overall, we have successfully prepared uniform Ag@CeO2 core@shell nanospheres via the auto-redox reaction that was triggered between Ce(OH)3 and AgNO3 in aqueous solution. The whole synthesis process is totally clean without using any organic solvent, redox reagent and surfactant. As a template, the as-prepared Ag@CeO2 core@shell nanospheres can be facilely etched by HAuCl4 to form the AgxAu1−x alloy nanoframes with hollow voids in the initial Ag core position via the in situ galvanic replacement strategy. The detailed catalytic tests show that the catalytic performance of the as-prepared AgxAu1−x@CeO2 catalysts is strongly related to their composition and structure. Among these catalysts, the Ag rich sample of Ag0.64Au0.36@CeO2 exhibits the best catalytic activity, whose catalytic efficiency reaches even 2.5 times higher than our previously reported Pt@CeO2 nanospheres in the catalytic reduction of 4-NP by AB. Moreover, Ag0.64Au0.36@CeO2 exhibits a much lower 100% conversion temperature of 120 °C for catalytic CO oxidation, compared with Ag0.41Au0.59@CeO2 (150 °C), Ag@CeO2 (200 °C) and Au@CeO2 (>300 °C). It is believed that such a fast, green, bottom-up synthetic strategy will be of great significance for the design and preparation of highly active and stable catalysts with complex compositions and hollow nanostructures.Acknowledgements
This work was financially supported by the fundamental research funds for the central universities, and the National Natural Science Foundation of China (Grant No. 51272249, 51372007 and 21301014). The work is also supported by the China Postdoctoral Science Foundation funded project.Notes and references
- J. Du, J. Qi, D. Wang and Z. Tang, Energy Environ. Sci., 2012, 5, 6914 CAS.
- U. Jeong, J. Joo and Y. Kim, RSC Adv., 2015, 5, 55608 RSC.
- H. Sun, J. He, J. Wang, S. Zhang, C. Liu, T. Sritharan, S. Mhaisalkar, M. Han, D. Wang and H. Chen, J. Am. Chem. Soc., 2013, 135, 9099 CrossRef CAS PubMed.
- Y. Xu, L. Chen, X. Wang, W. Yao and Q. Zhang, Nanoscale, 2015, 7, 10559 RSC.
- C. Kuo, T. Hua and M. Huang, J. Am. Chem. Soc., 2009, 131, 17871 CrossRef CAS PubMed.
- L. Zhang, D. A. Blom and H. Wang, Chem. Mater., 2011, 23, 4587 CrossRef CAS.
- X. Wang, D. P. Liu, S. Y. Song and H. J. Zhang, J. Am. Chem. Soc., 2013, 135, 15864 CrossRef CAS PubMed.
- J. Qi, J. Chen, G. Li, S. Li, Y. Gao and Z. Tang, Energy Environ. Sci., 2012, 5, 8937 CAS.
- A. Aijaz, A. Karkamkar, Y. Choi, N. Tsumori, E. Rönnebro, T. Autrey, H. Shioyama and Q. Xu, J. Am. Chem. Soc., 2012, 134, 13926 CrossRef CAS PubMed.
- H. Jiang, T. Akita, T. Ishida, M. Haruta and Q. Xu, J. Am. Chem. Soc., 2011, 133, 1304 CrossRef CAS PubMed.
- X. Gu, Z. Lu, H. Jiang, T. Akita and Q. Xu, J. Am. Chem. Soc., 2011, 133, 11822 CrossRef CAS PubMed.
- Q. Zhu, J. Li and Q. Xu, J. Am. Chem. Soc., 2013, 135, 10210 CrossRef CAS PubMed.
- H. Jiang, B. Liu, T. Akita, M. Haruta, H. Sakurai and Q. Xu, J. Am. Chem. Soc., 2009, 131, 11302 CrossRef CAS PubMed.
- X. Liang, J. Xiao, B. Chen and Y. Li, Inorg. Chem., 2010, 49, 8188 CrossRef CAS PubMed.
- X. Wang, D. P. Liu, J. Li, J. Zhen, F. Wang and H. J. Zhang, Chem. Sci., 2015, 6, 2887 Search PubMed.
- T. Kayama, K. Yamazaki and H. Shinjoh, J. Am. Chem. Soc., 2010, 132, 13154 CrossRef CAS PubMed.
- T. Mitsudome, Y. Mikami, M. Matoba, T. Mizugaki, K. Jitsukawa and K. Kaneda, Angew. Chem., Int. Ed., 2012, 51, 278 CrossRef PubMed.
- J. Nai, Y. Tian, X. Guan and L. Guo, J. Am. Chem. Soc., 2013, 135, 16082 CrossRef CAS PubMed.
- Z. Wang, D. Luan, F. Boey and X. W. Lou, J. Am. Chem. Soc., 2011, 133, 4738 CrossRef CAS PubMed.
- Y. Sun and Y. Xia, J. Am. Chem. Soc., 2004, 126, 3892 CrossRef CAS PubMed.
- Y. Sun, B. Wiley, Z. Li and Y. Xia, J. Am. Chem. Soc., 2004, 126, 9399 CrossRef CAS PubMed.
- M. Oh, T. Yu, S. Yu, B. Lim, K. Ko, M. Willinger, D. Seo, B. Kim, M. Cho and J. Park, Science, 2013, 340, 694 CrossRef PubMed.
- G. Gao, L. Yu, H. Wu and X. W. Lou, Small, 2014, 10, 1741 CrossRef CAS PubMed.
- J. M. Yan, Z. L. Wang, L. Gu, S. J. Li, H. L. Wang, W. T. Zheng and Q. Jiang, Adv. Energy Mater., 2015, 5, 1500107 Search PubMed.
- Y. Ping, J. M. Yan, Z. L. Wang, H. L. Wang and Q. Jiang, J. Mater. Chem. A, 2013, 1, 12188 CAS.
- S. Alayoglu and B. Eichhorn, J. Am. Chem. Soc., 2008, 130, 17479 CrossRef CAS PubMed.
- L. Zhang, L. T. Roling, X. Wang, M. Vara, M. Chi, J. Liu, S. I. Choi, J. Park, J. A. Herron, Z. Xie, M. Mavrikakis and Y. Xia, Science, 2015, 349, 412 CrossRef CAS PubMed.
- J. Yang, D. Shen, L. Zhou, W. Li, X. Li, C. Yao, R. Wang, A. M. El-Toni, F. Zhang and D. Zhao, Chem. Mater., 2013, 25, 3030 CrossRef CAS.
- J. Zhen, D. Liu, X. Wang, J. Li, F. Wang, Y. Wang and H. Zhang, Dalton Trans., 2015, 44, 2425 RSC.
- X. Xia, Y. Wang, A. Ruditskiy and Y. Xia, Adv. Mater., 2013, 25, 6313 CrossRef CAS PubMed.
- H. L. Liu, F. Nosheen and X. Wang, Chem. Soc. Rev., 2015, 44, 3056 RSC.
- X. Hong, D. Wang, S. Cai, H. Rong and Y. Li, J. Am. Chem. Soc., 2012, 134, 18165 CrossRef CAS PubMed.
- G. Li and Z. Tang, Nanoscale, 2014, 6, 3995 RSC.
Footnote |
| † Electronic supplementary information (ESI) available: Detailed synthesis, XRD patterns, EDX and XPS spectra of AgxAu1−x@CeO2 core@shell nanospheres. TEM images of Ag@CeO2, and AgxAu1−x@CeO2 prepared with addition of NaCl. See DOI: 10.1039/c5sc02774h |
| This journal is © The Royal Society of Chemistry 2015 |


