 Open Access Article
Experimental observation of TiN12+ cluster and theoretical investigation of its stable and metastable isomers†
Ke-Wei
Ding‡
a,
Xiao-Wei
Li‡
bc,
Hong-Guang
Xu
d,
Tao-Qi
Li
*a,
Zhong-Xue
Ge
*a,
Qian
Wang
*c and
Wei-Jun
Zheng
 *d
*d
aXi'an Modern Chemistry Research Institute, Xi'an 710065, China. E-mail: thankli64@163.com; gzx204@sina.com
bNational Laboratory of Mineral Materials, School of Materials Science and Technology, China University of Geosciences, Beijing 100083, China
cCenter for Applied Physics and Technology, College of Engineering, Peking University and IFSA Collaborative Innovation Center, Ministry of Education, Beijing 100871, China. E-mail: qianwang2@pku.edu.cn
dState Key Laboratory of Molecular Reaction Dynamics, Institute of Chemistry, Chinese Academy of Sciences, Beijing 100190, China. E-mail: zhengwj@iccas.ac.cn
First published on 11th May 2015
Abstract
TiNn+ clusters were generated by laser ablation and analyzed experimentally by mass spectrometry. The results showed that the mass peak of the TiN12+ cluster is dominant in the spectrum. The TiN12+ cluster was further investigated by photodissociation experiments with 266, 532 and 1064 nm photons. Density functional calculations were conducted to investigate stable structures of TiN12+ and the corresponding neutral cluster, TiN12. The theoretical calculations found that the most stable structure of TiN12+ is Ti(N2)6+ with Oh symmetry. The calculated binding energy is in good agreement with that obtained from the photodissociation experiments. The most stable structure of neutral TiN12 is Ti(N2)6 with D3d symmetry. The Ti–N bond strengths are greater than 0.94 eV in both Ti(N2)6+ and its neutral counterpart. The interaction between Ti and N2 weakens the N–N bond significantly. For neutral TiN12, the Ti(N3)4 azide, the N5TiN7 sandwich structure and the N6TiN6 structure are much higher in energy than the Ti(N2)6 complex. The DFT calculations predicted that the decomposition of Ti(N3)4, N5TiN7, and N6TiN6 into a Ti atom and six N2 molecules can release energies of about 139, 857, and 978 kJ mol−1 respectively.
1 Introduction
Nitrogen-rich and all-nitrogen compounds are potential candidates for high energy density materials (HEDMs).1–6 Despite numerous theoretical and experimental efforts aimed at all-nitrogen compounds, only a few attempts, for example the synthesis of N5+ salts7 and the detection of N4 with a lifetime of only about 1 microsecond,8 have been successful. A less challenging goal might be to produce nitrogen-rich species containing one or more other atoms. Thus, metal-doped nitrogen clusters have drawn increasing attention in recent years because of their diversiform structures and predicted relatively high stabilities.9–11 These clusters can also be considered as good models for understanding the formation and properties of nitrogen-rich compounds at the molecular level.Due to their importance in understanding metal–nitrogen interactions, metal–nitrogen complexes have been extensively investigated by a variety of experimental techniques in recent decades. Andrews and co-workers investigated Fe–N2, Sc–N2, Os–N2, and Ru–N2 complexes with matrix-isolated infrared spectroscopy12–15 and found that an Os atom can insert directly into the dinitrogen bond to form bent NOsN. Duncan and co-workers investigated In–N2 and Al–N2 complexes by photoionization spectroscopy,16,17 and studied Mg+–N2, Ca+–N2, Nb+(N2)n, and V+(N2)n complexes using photodissociation spectroscopy.18–21 Dagdigian and co-workers studied the electronic states of an Al–N2 complex with laser-induced fluorescence spectroscopy.22
Many kinds of binary azides have been prepared and characterized experimentally, and have also been investigated by theoretical calculations. B(N3)3 was isolated in a low-temperature argon matrix and characterized by FTIR spectroscopy;23 recently, it was also identified by a combination of VUV photoelectron spectroscopy and outer valence Green's functional calculations.24 Binary azides of Group 4 elements (such as Ti),25 Group 5 elements (V, Nb, and Ta),26–28 Group 6 elements (Mo and W),29 Group 14 elements (Si and Ge),30–32 Group 15 and 16 elements (P, Bi, Se, and Te)33–36 were synthesized and isolated experimentally, and were characterized by NMR spectroscopy. Some of them were also examined by infrared and/or Raman spectroscopy, and verified by theoretical calculations. Gagliardi and Pyykkö studied the Group 4 tetra-azides M(N3)4 (M = Ti–Hf, Th) by theoretical calculations.37 Li and Duan investigated the structures and stabilities of a series of tri-azides M(N3)3 (M = Sc, Y, La, B, Al, Ga, In, Tl) and tetra-azides M(N3)4 (M = Ti, Zr, Hf, C, Si, Ge, Sn, Pb) using density functional theory calculations.38
Many researchers have used theoretical chemistry to investigate species containing polynitrogen rings. The theoretical calculations of Gagliardi and Pyykkö found that ScN7 has a local minimum with C7v symmetry,9 and that the sandwich structures of N5MN7 (M = Ti, Zr, Hf, Th) are locally stable.10 Other species with polynitrogen rings, such as CsN7Ba39 and MN6 (M = Ti, Zr, Hf, Th),40 were also investigated theoretically. Theoretical calculations also predicted the possible existence of high-energy nitrogen-rich pentazolides with a very large nitrogen-to-element ratio, such as [M(N5)8]2− (M = Cr, Mo, W).11 After that, Duan and Li investigated a series of polynitrogen ring species (ScN6−, TiN6, VN6+, Ca2N6, and ScN6Cu) using density functional theory calculations.41 Jin and Ding calculated the sandwich structures of [N3NiN3]2− and [N3MN5]q [(M, q) = (Ni, 0), (Co, −1), (Fe, −2)] using density functional theory.42,43 Very recently, an investigation of stable high pressure phases of potassium azide using the first-principles method and the evolutionary algorithm suggested that planar N6 rings may be formed in potassium azide at a pressure of 100 GPa.44
Overall, the previous experimental and theoretical studies have shown that metal–nitrogen clusters may exist in the forms of M–(N2)n complexes, binary azides, or polynitrogen ring structures. Whether they are energy-rich or not, they are of great general interest. In this work, we investigated the TiN12+ cluster by laser ablation and photodissociation experiments coupled with density functional calculations, in order to gain an insight into the geometric and electronic properties of the most stable TiN12+ cluster, as well as its neutral counterpart. The relative stabilities of the polyazide and polynitrogen ring isomers were also investigated by density functional calculations.
2 Experimental and theoretical methods
2.1 Experimental method
The experiments were conducted on a home-built apparatus equipped with a laser vaporization cluster source and a reflectron time-of-flight mass spectrometer (RTOF-MS), which has been described elsewhere.45 Briefly, the TiN12+ cluster ions were generated in the laser vaporization source by laser ablation of a rotating and translating disk target of a mixture of Ti and BN (13 mm diameter, Ti![[thin space (1/6-em)]](https://www.rsc.org/images/entities/char_2009.gif) :
:![[thin space (1/6-em)]](https://www.rsc.org/images/entities/char_2009.gif) BN mole ratio = 2
BN mole ratio = 2![[thin space (1/6-em)]](https://www.rsc.org/images/entities/char_2009.gif) :
:![[thin space (1/6-em)]](https://www.rsc.org/images/entities/char_2009.gif) 1) with the second harmonic of a nanosecond Nd:YAG laser (Continuum Surelite II-10). A typical laser power used in this work is about 10 mJ per pulse. Nitrogen gas with ∼4 atm back pressure was allowed to expand into the source through a pulsed valve (General Valve Series 9) to provide nitrogen for cluster formation and to cool the formed clusters. The masses of the generated cluster ions were analyzed with the RTOF-MS. The TiN12+ cluster ions were further investigated via photodissociation experiments. During the photodissociation experiments, the TiN12+ ions were selected with a pulsed mass-gate at the first space focus point of the RTOF-MS, decelerated with a DC electric field, and then dissociated with 266, 532, and 1064 nm photons from another nanosecond Nd:YAG laser (Continuum Surelite II-10). The fragment ions and parent ions were then re-accelerated toward the reflectron zone and reflected to the microchannel plate (MCP) detector. The output from the MCP detector was amplified with a broadband amplifier and recorded with a 200 MHz digital card. The digitalized data were collected on a laboratory computer with home-made software.
1) with the second harmonic of a nanosecond Nd:YAG laser (Continuum Surelite II-10). A typical laser power used in this work is about 10 mJ per pulse. Nitrogen gas with ∼4 atm back pressure was allowed to expand into the source through a pulsed valve (General Valve Series 9) to provide nitrogen for cluster formation and to cool the formed clusters. The masses of the generated cluster ions were analyzed with the RTOF-MS. The TiN12+ cluster ions were further investigated via photodissociation experiments. During the photodissociation experiments, the TiN12+ ions were selected with a pulsed mass-gate at the first space focus point of the RTOF-MS, decelerated with a DC electric field, and then dissociated with 266, 532, and 1064 nm photons from another nanosecond Nd:YAG laser (Continuum Surelite II-10). The fragment ions and parent ions were then re-accelerated toward the reflectron zone and reflected to the microchannel plate (MCP) detector. The output from the MCP detector was amplified with a broadband amplifier and recorded with a 200 MHz digital card. The digitalized data were collected on a laboratory computer with home-made software.
2.2 Computational methods
The theoretical calculations were carried out using GAUSSIAN 09 code.46 Geometry optimization and frequency analysis were performed at the B3LYP/6-31G* level.47,48 The ionization energy of Ti and the bond length of the N2 molecule were calculated to verify the accuracy of our method. The calculated ionization energy of Ti is about 656 kJ mol−1 and the N–N bond length is about 1.10 Å, which are consistent with the experimental values of 658.8 kJ mol−1 and 1.0977 Å.49 The binding energy is defined as (n is the number of N2 molecules):| Eb1 = −[E(TiN2n) − E(Ti) − n × E(N2)]/n (for neutral clusters) |
| Eb2 = −[E(TiN2n+) − E(Ti+) − n × E(N2)]/n (for ionic clusters) |
To gain further insight into the interactions between the N2 molecules and Ti or Ti+, we performed natural bond orbital (NBO) analysis,50 in which the electronic wave function is interpreted in terms of a set of occupied Lewis orbitals and a set of unoccupied non-Lewis delocalized orbitals. For each donor NBO (i) and acceptor NBO (j), the stabilization energy E2 associated with charge transfer i → j is given by
3 Experimental results
Fig. 1 shows a typical mass spectrum of the clusters generated in our experiments. It can be seen that the predominant mass peaks correspond to Ti+ and TiN12+. It is very interesting that there are no mass peaks due to other TiNn+ clusters. This indicates that TiN12+ may have the most stable or symmetric structure in comparison with other clusters. In addition to the mass peak of TiN12+, we also observed weak mass peaks corresponding to TiON8+, TiON10+, and TiO2N9+ in the mass spectrum. The detection of TiON10+ is similar to the formation of TiO+(N2)5 by gas phase clustering of N2 molecules on TiO+ reported by Daly and El-Shall.51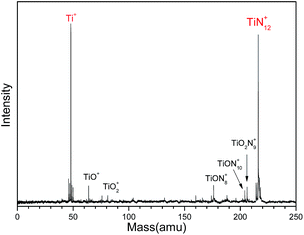 | ||
Fig. 1 Typical mass spectrum of Ti–N clusters generated by laser ablation of a Ti![[thin space (1/6-em)]](https://www.rsc.org/images/entities/char_2009.gif) : :![[thin space (1/6-em)]](https://www.rsc.org/images/entities/char_2009.gif) BN mixture target. BN mixture target. | ||
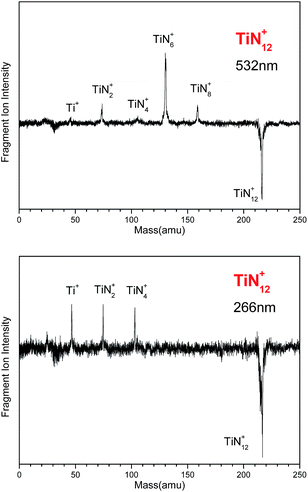
The photodissociation of TiN12+ was conducted using 266, 532 and 1064 nm photons. No fragment ions were observed when TiN12+ was photodissociated by 1064 nm photons. The photodissociation mass spectra of TiN12+ at 532 and 266 nm are shown in Fig. 2. TiN8+, TiN6+, TiN4+, TiN2+ and Ti+ fragment ions were produced when TiN12+ was photodissociated by 532 nm photons, and the TiN6+ fragment had the highest abundance. This indicates that TiN12+ can lose at least 4 nitrogen atoms, and that the main dissociation channel when TiN12+ was photodissociated by 532 nm photons was the loss of 6 nitrogen atoms. The fragment ions observed when TiN12+ was photodissociated by 266 nm photons were TiN4+, TiN2+, and Ti+, which shows that TiN12+ can lose at least 8 nitrogen atoms.
4 Theoretical results
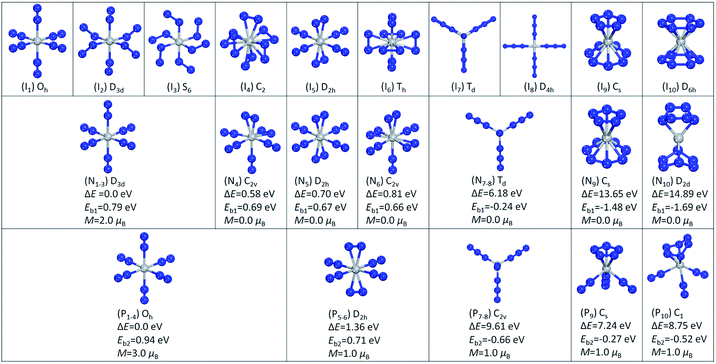
We started with one N2 molecule bonded to Ti and Ti+. We calculated both the end-on linear structure and the side-on triangular structure, and found that for TiN2 the end-on linear geometry is 0.34 eV lower in energy than the side-on geometry, while for TiN2+ the two configurations are almost degenerate. The binding energies of the end-on linear configurations were calculated to be 0.25 and 0.93 eV for TiN2 and TiN2+, respectively. TiN2 was found to have a magnetic moment of 4.0 μB, a Ti–N bond length of 1.94 Å, and a N–N bond length of 1.15 Å. While for TiN2+, the magnetic moment is 3.0 μB, the Ti–N bond length is 2.18 Å, and the N–N bond length is 1.11 Å.To investigate the stable states of TiN12 and TiN12+, we selected six initial geometrical configurations consisting of one Ti and six N2 molecules (Fig. 3, I1–I6), and two structures consisting of one Ti atom and four N3 moieties (Fig. 3, I7 and I8). We also considered structures composed of one Ti atom, one N5 ring and one N7 ring (N5TiN7) (Fig. 3, I9), and one Ti and two N6 rings (N6TiN6) (Fig. 3, I10). After full relaxation, it was found that, for the neutral cluster, the initial structures of I1, I2 and I3 converged to the same structure with D3d symmetry, labeled as N1–3 in Fig. 3, which is the lowest energy geometrical configuration with a magnetic moment of 2.0 μB. While the other optimized isomers, labeled as N4 ∼ N10 in Fig. 3, have much higher energies than isomer N1–3. Their relative energies, calculated with respect to the lowest energy configuration, and symmetries are also given in Fig. 3. In the lowest energy geometry (N1–3), the Ti–N2 distance and N–N bond length are 2.09 and 1.12 Å, respectively. The average binding energy of each N2 molecule with Ti in isomer N1–3 is 0.79 eV, which is larger than that in TiN2. The Ti(N3)4 structure with Td symmetry is 6.18 eV higher in energy than the most stable Ti(N2)6 complex. The linear Ti–N–NN bond angles of the Td structure calculated in this work are in agreement with those obtained from previous theoretical calculations on free gaseous Ti(N3)4.37,38 These bond angles were found to vary in the solid phase due to solid-state effects.25 The N5TiN7 structure has a Ti atom sandwiched by an η5-N5 ring and an η7-N7 ring, similar to that reported by Gagliardi and Pyykkö.10 It is worth mentioning that η5–η7 sandwich structures were also observed in (C5H5)M(C7H7) type compounds, where M is a transition metal.52–54 The N6TiN6 structure exhibits D2d symmetry, in which the two N6 rings are distorted and only two N atoms in each N6 ring interact directly with the Ti atom, with a shorter Ti–N distance of 1.98 Å. The N5TiN7 and N6TiN6 structures are higher in energy than the most stable Ti(N2)6 complex by 13.65 and 14.89 eV respectively. According to the calculated binding energies, the decomposition of Ti(N3)4, N5TiN7, and N6TiN6 into a Ti atom and six N2 molecules could release energies of 139, 857, and 978 kJ mol−1 respectively.
For the cationic TiN12+ cluster, the initial structures of I1, I2, I3 and I4 converged to one structure (P1–4) with Oh symmetry, as shown in Fig. 3. This is the lowest energy configuration of TiN12+ with a Ti+–N2 distance and N–N bond length of 2.17 and 1.11 Å, respectively. The magnetic moment was found to be 3.0 μB. The average binding energy of each N2 with Ti in isomer P1–4 was calculated to be 0.94 eV. The other optimized isomers, namely P5–6, P7–8, P9 and P10 in Fig. 3, were found to be higher in energy than isomer P1–4 by 1.36, 9.61, 7.24 and 8.75 eV, respectively. The structure of Ti(N3)4+ has C2v symmetry. The N5TiN7 and N6TiN6 structures of TiN12+ are not stable. The N5TiN7 structure is rearranged into a N5Ti(N3)(N2)2 type of structure, while the N6TiN6 structure is rearranged into N6Ti(N2)3 after the geometry optimizations. According to the calculated binding energies, the decomposition of Ti(N3)4+, N5Ti(N3)(N2)2+, and N6Ti(N2)3+ can release energies of 382, 156, and 301 kJ mol−1, respectively.
5 Discussion
5.1 Comparison of binding energies
Based on the calculated binding energy of the most stable structure of the TiN12+ cluster (0.94 eV), the energy of a 532 nm photon is able to dissociate two N2 molecules from isomer P1–4, while the energy of a 266 nm photon is able to dissociate four N2 molecules. This is in good agreement with our photodissociation experiment, as the experiment showed that the photodissociation of TiN12+ at 532 nm could remove at least 4 nitrogen atoms (two N2 molecules), and photodissociation at 266 nm could remove at least 8 nitrogen atoms (four N2 molecules). The detection of no photofragments at 1064 nm indicates that the energy barrier for the dissociation of TiN12+ is higher than 1.16 eV. In the experiment, the production of TiN6+, TiN4+, TiN2+ and Ti+ fragments at 532 nm, and the production of TiN2+ and Ti+ fragments at 266 nm are probably due to multiple-photon processes. The good agreement between the experiment and the theoretical calculations validates the theoretical method selected for this work and confirms that the TiN12+ cluster detected in our experiment has the form Ti(N2)6+ with Oh symmetry. This is consistent with the matrix infrared and ultraviolet-visible spectroscopy studies of Ti(CO)6 and Ti(N2)6 by Busby et al.55Although the binding energy of neutral TiN2 (0.25 eV) is smaller than that of TiN2+ (0.93 eV) by 0.68 eV, the Ti–N bond in neutral TiN2 (1.94 Å) is actually shorter (stronger) than that in TiN2+ (2.18 Å), while the N–N bond in neutral TiN2 (1.15 Å) is longer (weaker) than that in TiN2+ (1.11 Å). The decrease in the binding energy for neutral TiN2 compared to TiN2+ is due to the weakening of the N–N bond. Thus, we would like to stress that the calculated binding energies do not reflect the exact Ti–N bond strengths in the clusters. The N–N bond in TiN2+ is weaker than that in the N2 molecule; thus, the Ti–N bond strength in TiN2+ would be larger than the binding energy (0.93 eV). Moreover, the Ti–N bond in neutral TiN2 is stronger than the Ti–N bond in TiN2+. Hence, we obtain the relation: BE[(Ti–N)TiN2] > BE[(Ti–N)TiN2+] > 0.93 eV, where BE[(Ti–N)TiN2] is the Ti–N bond energy in TiN2 and BE[(Ti–N)TiN2+] is the Ti–N bond energy in TiN2+. This also implies that the N–N bond in neutral TiN2 is weaker than those in TiN2+ and N2 by at least 0.68 eV, which can be formularized as: BE[(N–N)TiN2] + 0.68 eV < BE[(N–N)TiN2+] < BE[(N–N)N2], where BE[(N–N)TiN2], BE[(N–N)TiN2+], and BE[(N–N)N2] are the N–N bond energies in TiN2, TiN2+ and N2, respectively.
Similarly, although the average binding energy of the most stable structure of TiN12 (0.79 eV) is smaller than that of TiN12+ (0.94 eV) by 0.15 eV, the Ti–N bonds in neutral TiN12 (2.09 Å) are actually shorter (stronger) than those in TiN12+ (2.17 Å), while the N–N bonds in neutral TiN12 are longer (weaker) (1.12 Å) than those in TiN12+ (1.11 Å). We can also conclude that the Ti–N bond energies of both TiN12 and TiN12+ are larger than 0.94 eV, BE[(Ti–N)TiN12] > BE[(Ti–N)TiN12+] > 0.94 eV.
It is interesting to note that the average binding energy of each N2 with Ti in the ground state of neutral TiN12 is 0.79 eV, which is much larger than that in TiN2, while the average binding energy of each N2 with Ti+ in the ground state of TiN12+ is 0.94 eV, which is nearly the same as that in TiN2+. Considering the bond lengths in TiN2, TiN12, TiN2+, and TiN12+, we can see that the Ti–N bond lengths are in the order TiN2+ ≈ TiN12+ > TiN12 > TiN2, while the N–N bond lengths are in the order TiN2+ ≈ TiN12+ < TiN12 < TiN2. The Ti–N and N–N distances in TiN2+ and TiN12+ are very close to each other, while those in TiN2 and TiN12 are very different from each other. The Ti–N bond in TiN2 is much shorter than those in the other three species, and the N–N bond in TiN2 is much longer than those in the other species. In TiN2, the N–N bond is weakened significantly due to the strong Ti–N2 interaction. This could explain why the calculated binding energies of TiN2+ and TiN12+ are similar while the binding energy of TiN2 is much smaller than that of TiN12. Overall, we have BE[(Ti–N)TiN2] > BE[(Ti–N)TiN12] > BE[(Ti–N)TiN12+] > BE[(Ti–N)TiN2+] > 0.93 eV.
5.2 NBO analyses
To further address the differences in the binding energies, we performed NBO analyses for TiN2, TiN2+, TiN12 and TiN12+ in order to understand the effects of charge and coordination number on the binding and electronic structures. The calculated results are provided in Tables S1–S4.† Based on the NBO data, we note that in neutral TiN2, the Ti lone pairs in the spin-up channel with d-orbital components of 99.51% donate 0.64 electrons to the π-antibonding orbitals between the two N atoms, which have p-orbital components of 99.90% and 99.53%. The corresponding back donations from the N valence lone pairs in two spin channels to the valence non-Lewis lone pairs on Ti total 0.14 electrons, giving rise to the loss of approximately 0.50 electrons on the Ti site, while the N1 and N2 atoms gain 0.45 and 0.05 electrons, respectively. Thus, the Ti–N interaction is very strong and the N–N bond is weakened significantly in neutral TiN2 because of the large charge transfer between Ti and N1. On the other hand, in TiN2+, the charge donation from the lone pair on Ti to the antibonding orbital of N2 is negligible since it is more difficult to transfer electrons from Ti+. Contrarily, about 0.09 electrons are transferred from the lone pair on N1 to Ti. N1 and N2 carry charges of −0.242 and +0.216 respectively, forming a dipole which strongly interacts with Ti+, with a charge of +1.026, resulting in a large binding energy for N2 and Ti+.On going from TiN2 to Ti(N2)6, the enhanced coordination field splits the Ti 3d orbitals to form bonding orbitals between Ti and the six linking N1 atoms in both spin-up and spin-down channels. The bonding orbitals have Ti 4s, Ti 4p and Ti 3d components of 16.66%, 49.92% and 33.34% respectively, resulting in sp3d2 hybridization character, which is consistent with the octahedral ligand field where the Ti atom is located. Therefore, the bonding orbitals between Ti and N1 give rise to a larger binding energy for the N2 molecule in Ti(N2)6 compared to that in TiN2.
Despite their different charges, TiN12 and TiN12+ share some common features: (1) bonding orbitals are formed between Ti and N1, and between Ti+ and N1; and (2) the second order perturbation analysis suggests that there are no obvious stabilization interactions associated with charge transfer between Ti and N2. These two common features result in a reduction in the difference between the binding energies (0.79 versus 0.94 eV) of the N2 molecules in the neutral and charged TiN12.
5.3 Electronic and magnetic properties
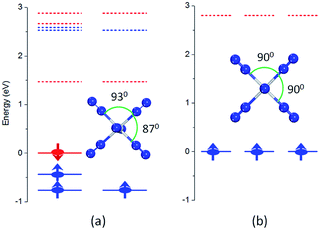
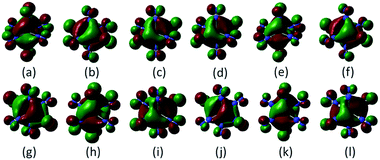
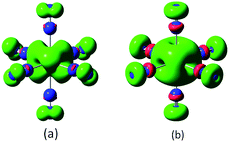
In the lowest energy structure of cationic TiN12, Ti+ is six-fold coordinated with Oh symmetry, in which the five d orbitals of Ti split into three-fold degenerate dxy, dxz and dyz, and two-fold degenerate dx2−y2 and dz2 orbitals. The former three orbitals are occupied by three spin-up electrons, while the latter two fold degenerate orbitals are empty, resulting in a magnetic moment of 3.0 μB. The energy gap between the highest occupied molecular orbitals (HOMOs) and lowest unoccupied molecular orbitals (LUMOs) is 2.8 eV, as shown in Fig. 4(b). However, compared to TiN12+, the neutral TiN12 cluster has one more electron, which would induce the Jahn–Teller effect. The symmetry changes from Oh to D3d, and three electrons are spin-up and one electron is spin-down, leading to a total magnetic moment of 2.0 μB and an energy gap of 1.5 eV, as shown in Fig. 4(a). The three occupied spin-up orbitals, one occupied spin-down orbital, and two-fold degenerate lowest unoccupied molecular orbitals of neutral TiN12 are plotted in Fig. 5(a–f), and the Ti 3d-orbital component percentages are 38.3%, 38.3%, 50.6%, 58.3%, 65% and 65%, respectively. For comparison, the three-fold degenerate HOMOs and the three-fold degenerate LUMOs of TiN12+ are given in Fig. 5(g–l), and the Ti 3d-orbital component percentages are 41.6%, 41.6%, 41.6%, 78.0%, 78.0% and 78.0%, respectively. This suggests that the Ti 3d orbitals make a larger contribution to the frontier orbitals in the charged cluster (TiN12+) compared with the neutral TiN12.As discussed above, TiN12 and TiN12+ have magnetic moments of 2.0 and 3.0 μB, respectively. In order to see how the magnetic moments are distributed in the clusters, spin density isosurfaces are plotted in Fig. 6. They clearly show that the spin density of TiN12+ is more symmetric, and that Ti+ carries a larger net spin moment and more strongly polarizes the contacting N atoms (termed N1 atoms) antiferromagnetically. The non-contacting N atoms (named N2 atoms) are ferromagnetically polarized in both the neutral and charged clusters.
6 Conclusions
The TiN12+ cluster was generated experimentally and was further investigated by photodissociation experiments at 1064, 532, and 266 nm. The results showed that the TiN12+ cluster has very high abundance compared to other TiNn+ clusters. Density functional calculations were conducted to investigate the stable structures of TiN12+ and its corresponding neutral cluster TiN12. The calculated binding energy of the TiN12+ cluster was in good agreement with the photodissociation experiment. The theoretical calculations found that the most stable structure of TiN12+ is Ti(N2)6+ with Oh symmetry and the most stable structure of neutral TiN12 is Ti(N2)6 with D3d symmetry. The Ti–N bond strengths are greater than 0.94 eV in both Ti(N2)6+ and its neutral counterpart. The interaction between Ti and N2 weakens the N–N bond significantly. The C2v azide isomer Ti(N3)4+ is higher in energy than the Oh Ti(N2)6+ isomer by 9.61 eV. The azide isomer Ti(N3)4 and the N5TiN7 and N6TiN6 structures are higher in energy than the most stable Ti(N2)6 complex by 6.18, 13.65 and 14.89 eV respectively, indicating that the N5TiN7 and N6TiN6 isomers are potential candidates for high energy density materials.Acknowledgements
This work was supported by grants from the Knowledge Innovation Program of the Chinese Academy of Sciences (Grant no. KJCX2-EW-H01), and the National Natural Science Foundation of China (NSFC-21273246, NSFC-51471004 and NSFC-11174014).Notes and references
- P. C. Samartzis and A. M. Wodtke, Int. Rev. Phys. Chem., 2006, 25, 527–552 CrossRef CAS PubMed.
- B. M. Rice, E. F. C. Byrd and W. D. Mattson, in High Energy Density Materials, ed. T. M. Klapotke, 2007, vol. 125, pp. 153–194 Search PubMed.
- Y. Li and S. Pang, Chin. J. Explos. Propellants, 2012, 35, 1–8 Search PubMed.
- M. N. Glukhovtsev, H. J. Jiao and P. V. Schleyer, Inorg. Chem., 1996, 35, 7124–7133 CrossRef CAS PubMed.
- D. A. Dixon, D. Feller, K. O. Christe, W. W. Wilson, A. Vij, V. Vij, H. D. B. Jenkins, R. M. Olson and M. S. Gordon, J. Am. Chem. Soc., 2004, 126, 834–843 CrossRef CAS PubMed.
- K. O. Christe, Propellants, Explos., Pyrotech., 2007, 32, 194–204 CrossRef CAS PubMed.
- K. O. Christe, W. W. Wilson, J. A. Sheehy and J. A. Boatz, Angew. Chem., Int. Ed., 1999, 38, 2004–2009 CrossRef CAS.
- F. Cacace, G. de Petris and A. Troiani, Science, 2002, 295, 480–481 CrossRef CAS PubMed.
- L. Gagliardi and P. Pyykkö, J. Am. Chem. Soc., 2001, 123, 9700–9701 CrossRef CAS.
- L. Gagliardi and P. Pyykkö, J. Phys. Chem. A, 2002, 106, 4690–4694 CrossRef CAS.
- M. Straka and P. Pyykko, Inorg. Chem., 2003, 42, 8241–8249 CrossRef CAS PubMed.
- M. M. Doeff, S. F. Parker, P. H. Barrett and R. G. Pearson, Inorg. Chem., 1984, 23, 4108–4110 CrossRef CAS.
- G. V. Chertihin, L. Andrews and M. Neurock, J. Phys. Chem., 1996, 100, 14609–14617 CrossRef CAS.
- G. V. Chertihin, L. Andrews and C. W. Bauschlicher, J. Am. Chem. Soc., 1998, 120, 3205–3212 CrossRef CAS.
- A. Citra and L. Andrews, J. Am. Chem. Soc., 1999, 121, 11567–11568 CrossRef CAS.
- L. R. Brock and M. A. Duncan, J. Chem. Phys., 1995, 102, 9498–9505 CrossRef CAS PubMed.
- L. R. Brock and M. A. Duncan, J. Phys. Chem., 1995, 99, 16571–16575 CrossRef CAS.
- D. L. Robbins, L. R. Brock, J. S. Pilgrim and M. A. Duncan, J. Chem. Phys., 1995, 102, 1481–1492 CrossRef CAS PubMed.
- S. H. Pullins, J. E. Reddic, M. R. France and M. A. Duncan, J. Chem. Phys., 1998, 108, 2725–2732 CrossRef CAS PubMed.
- E. D. Pillai, T. D. Jaeger and M. A. Duncan, J. Am. Chem. Soc., 2007, 129, 2297–2307 CrossRef CAS PubMed.
- E. D. Pillai, T. D. Jaeger and M. A. Duncan, J. Phys. Chem. A, 2005, 109, 3521–3526 CrossRef CAS PubMed.
- X. Yang, I. Gerasimov and P. J. Dagdigian, Chem. Phys., 1998, 239, 207–221 CrossRef CAS.
- I. A. Al-Jihad, B. Liu, C. J. Linnen and J. V. Gilbert, J. Phys. Chem. A, 1998, 102, 6220–6226 CrossRef CAS.
- F. Y. Liu, X. Q. Zeng, H. P. Zhang, L. P. Meng, S. J. Zheng, M. F. Ge, D. X. Wang, D. K. W. Mok and F. T. Chau, Chem. Phys. Lett., 2006, 419, 213–216 CrossRef CAS PubMed.
- R. Haiges, J. A. Boatz, S. Schneider, T. Schroer, M. Yousufuddin and K. O. Christe, Angew. Chem., Int. Ed., 2004, 43, 3148–3152 CrossRef CAS PubMed.
- R. Haiges, J. A. Boatz, T. Schroer, M. Yousufuddin and K. O. Christe, Angew. Chem., Int. Ed., 2006, 45, 4830–4835 CrossRef CAS PubMed.
- R. Haiges, J. A. Boatz, M. Yousufuddin and K. O. Christe, Angew. Chem., Int. Ed., 2007, 46, 2869–2874 CrossRef CAS PubMed.
- R. Haiges, J. A. Boatz and K. O. Christe, Angew. Chem., Int. Ed., 2010, 49, 8008–8012 CrossRef CAS PubMed.
- R. Haiges, J. A. Boatz, R. Bau, S. Schneider, T. Schroer, M. Yousufuddin and K. O. Christe, Angew. Chem., Int. Ed., 2005, 44, 1860–1865 CrossRef CAS PubMed.
- A. C. Filippou, P. Portius, D. U. Neumann and K.-D. Wehrstedt, Angew. Chem., Int. Ed., 2000, 39, 4333–4336 CrossRef CAS.
- P. Portius, A. C. Filippou, G. Schnakenburg, M. Davis and K.-D. Wehrstedt, Angew. Chem., Int. Ed., 2010, 49, 8013–8016 CrossRef CAS PubMed.
- A. C. Filippou, P. Portius and G. Schnakenburg, J. Am. Chem. Soc., 2002, 124, 12396–12397 CrossRef CAS PubMed.
- T. M. Klapötke, B. Krumm, P. Mayer and I. Schwab, Angew. Chem., Int. Ed., 2003, 42, 5843–5846 CrossRef PubMed.
- C. Knapp and J. Passmore, Angew. Chem., Int. Ed., 2004, 43, 4834–4836 CrossRef CAS PubMed.
- T. M. Klapötke, B. Krumm, M. Scherr, R. Haiges and K. O. Christe, Angew. Chem., Int. Ed., 2007, 46, 8686–8690 CrossRef PubMed.
- A. Villinger and A. Schulz, Angew. Chem., Int. Ed., 2010, 49, 8017–8020 CrossRef CAS PubMed.
- L. Gagliardi and P. Pyykkö, Inorg. Chem., 2003, 42, 3074–3078 CrossRef CAS PubMed.
- Q. S. Li and H. X. Duan, J. Phys. Chem. A, 2005, 109, 9089–9094 CrossRef CAS PubMed.
- L. Gagliardi and P. Pyykkö, Theor. Chem. Acc., 2003, 110, 205–210 CrossRef CAS PubMed.
- M. Straka, Chem. Phys. Lett., 2002, 358, 531–536 CrossRef CAS.
- H.-X. Duan and Q.-S. Li, Chem. Phys. Lett., 2006, 432, 331–335 CrossRef CAS PubMed.
- L. Jin and Y.-h. Ding, J. Phys. Chem. A, 2009, 113, 5246–5250 CrossRef CAS PubMed.
- L. Jin and Y.-h. Ding, J. Phys. Chem. A, 2009, 113, 13645–13650 CrossRef CAS PubMed.
- J. Zhang, Z. Zeng, H.-Q. Lin and Y.-L. Li, Sci. Rep., 2014, 4, 4358 Search PubMed.
- Y. C. Zhao, Z. G. Zhang, J. Y. Yuan, H. G. Xu and W. J. Zheng, Chin. J. Chem. Phys., 2009, 22, 655–662 CrossRef CAS.
- M. J. Frisch, G. W. Trucks, H. B. Schlegel, G. E. Scuseria, M. A. Robb, J. R. Cheeseman, G. Scalmani, V. Barone, B. Mennucci, G. A. Petersson, H. Nakatsuji, M. Caricato, X. Li, H. P. Hratchian, A. F. Izmaylov, J. Bloino, G. Zheng, J. L. Sonnenberg, M. Hada, M. Ehara, K. Toyota, R. Fukuda, J. Hasegawa, M. Ishida, T. Nakajima, Y. Honda, O. Kitao, H. Nakai, T. Vreven, J. A. Montgomery Jr, J. E. Peralta, F. Ogliaro, M. Bearpark, J. J. Heyd, E. Brothers, K. N. Kudin, V. N. Staroverov, R. Kobayashi, J. Normand, K. Raghavachari, A. Rendell, J. C. Burant, S. S. Iyengar, J. Tomasi, M. Cossi, J. M. M. N. Rega, M. Klene, J. E. Knox, J. B. Cross, V. Bakken, C. Adamo, J. Jaramillo, R. Gomperts, R. E. Stratmann, O. Yazyev, A. J. Austin, R. Cammi, C. Pomelli, J. W. Ochterski, R. L. Martin, K. Morokuma, V. G. Zakrzewski, G. A. Voth, P. Salvador, J. J. Dannenberg, S. Dapprich, A. D. Daniels, O. Farkas, J. B. Foresman, J. V. Ortiz, J. Cioslowski and D. J. Fox, Gaussian 09, Revision A.02, Gaussian, Inc., Wallingford, CT, 2009 Search PubMed.
- P. C. Hariharan and J. A. Pople, Theor. Chim. Acta, 1973, 28, 213–222 CrossRef CAS.
- V. A. Rassolov, J. A. Pople, M. A. Ratner and T. L. Windus, J. Chem. Phys., 1998, 109, 1223–1229 CrossRef CAS PubMed.
- CRC Handbook of Chemistry and Physics, ed. W. M. Haynes, 95th edn, 2014–2015 Search PubMed.
- A. E. Reed, L. A. Curtiss and F. Weinhold, Chem. Rev., 1988, 88, 899–926 CrossRef CAS.
- G. M. Daly and M. S. El-Shall, J. Chem. Phys., 1994, 100, 1771–1772 CrossRef CAS PubMed.
- W. Noh and G. S. Girolami, Inorg. Chem., 2008, 47, 535–542 CrossRef CAS PubMed.
- S. Büschel, T. Bannenberg, C. G. Hrib, A. Glöckner, P. G. Jones and M. Tamm, J. Organomet. Chem., 2009, 694, 1244–1250 CrossRef PubMed.
- J. Niinistö, T. Hatanpää, M. Kariniemi, M. Mäntymäki, L. Costelle, K. Mizohata, K. Kukli, M. Ritala and M. Leskelä, Chem. Mater., 2012, 24, 2002–2008 CrossRef.
- R. Busby, W. Klotzbuecher and G. A. Ozin, Inorg. Chem., 1977, 16, 822–828 CrossRef CAS.
Footnotes |
| † Electronic supplementary information (ESI) available: NBO data for TiN2, TiN2+, TiN12 and TiN12+. See DOI: 10.1039/c5sc01103e |
| ‡ K.-W. Ding and X.-W. Li contributed equally to this work. |
| This journal is © The Royal Society of Chemistry 2015 |


