
 Open Access Article
 This Open Access Article is licensed under a Creative Commons Attribution-Non Commercial 3.0 Unported Licence
Solid-phase synthesis provides a modular, lysine-based platform for fluorescent discrimination of nitroxyl and biological thiols†
Andrei
Loas
,
Robert J.
Radford
,
Alexandria
Deliz Liang
and
Stephen J.
Lippard
*
Department of Chemistry, Massachusetts Institute of Technology, 77 Massachusetts Avenue, Cambridge, MA 02139, USA. E-mail: lippard@mit.edu; Fax: +1-617-258-8150; Tel: +1-617-253-1892
First published on 19th May 2015
Abstract
We describe a modular, synthetically facile solid-phase approach aimed at separating the fluorescent reporter and binding unit of small-molecule metal-based sensors. The first representatives contain a lysine backbone functionalized with a tetramethylrhodamine fluorophore, and they operate by modulating the oxidation state of a copper ion ligated to an [N4] (cyclam) or an [N2O] (quinoline-phenolate) moiety. We demonstrate the selectivity of their Cu(II) complexes for sensing nitroxyl (HNO) and thiols (RSH), respectively, and investigate the mechanism responsible for the observed reactivity in each case. The two lysine conjugates are cell permeable in the active, Cu(II)-bound forms and retain their analyte selectivity intracellularly, even in the presence of interfering species such as nitric oxide, nitrosothiols, and hydrogen sulfide. Moreover, we apply the new probes to discriminate between distinct levels of intracellular HNO and RSH generated upon stimulation of live HeLa cells with ascorbate and hydrogen sulfide, respectively. The successful implementation of the lysine-based sensors to gain insight into biosynthetic pathways validates the method as a versatile tool for producing libraries of analogues with minimal synthetic effort.
Introduction
The discovery of nitric oxide (NO) as the endothelium-derived relaxing factor1 sparked great scientific interest in this small gaseous biological regulator. A diatomic radical, NO functions as a signaling agent for a variety of processes related to the cardiovascular and immune systems,2 neuroprotection,3 protein regulation4 and chemotherapeutic resistance.5 In contrast, nitroxyl (HNO), the protonated, one-electron reduced form of nitric oxide, has attracted considerably less attention.6,7 Even though enzymatic production of HNO remains an unanswered question, several biosynthetic pathways leading to its endogenous generation have been investigated.8–11 HNO was recently detected intracellularly in the reaction between HSNO and H2S,12 in the heme-catalyzed reduction of nitrite,13 and in the decomposition of O-nitrosoascorbate.14 Exogenously applied HNO displays a significantly different biochemistry from that of NO, leading to, among others, vasoprotective effects,15 heart muscle contractility,16 and neurotoxicity.17 As NO and HNO display contrasting biological roles, molecular reporters able to discriminate between the two species are highly desirable. At the same time, the probes should maintain selectivity for NO or HNO in the presence of other reactive nitrogen and oxygen species (RNOS) and biological reductants such as ascorbate, hydrogen sulfide, and thiols. The reactivity of NO and HNO presents a challenge in the design of sensors suitable for investigating their generation and biological functions.18 In this respect, fluorescence microscopy with small-molecule probes has emerged as the preferred biologically non-intrusive method.19Within the broad field of fluorescent sensors, transition metal-based complexes offer a practical solution for direct and selective detection of the desired analyte. In the past decade, our group has developed several families of sensors for nitric oxide,20–26 employing a Cu(II) ion coordinated to the tridentate [N2O] motif of a quinoline-phenolate binding site, as in the parent, fluorescein-based CuFL1 (Fig. 1).21
 | ||
| Fig. 1 Structures of Cu(II)-based small-molecule fluorescent probes selective for NO (CuFL1),21 HNO (CuDHX1),27 and cysteine (Cu-1),28 highlighting in red the ligating atoms at the metal-binding sites. | ||
In its resting state, emission of the fluorescein fluorophore in CuFL1 is quenched by the paramagnetic Cu(II) ion. Upon reaction with NO, deprotonation and nitrosation of the amine occurs with concomitant dissociation of the metal ion from the complex as a reduced Cu(I) species, and fluorescence emission is restored in the resulting nitrosamine product.20,21,29 On the other hand, fluorescent Cu(II)-based probes for nitroxyl operate solely through a copper reduction mechanism.30 To ensure selectivity in biological milieu, sensors for nitroxyl should ideally have a Cu(II/I) reduction potential tuned between that of NO (−0.68 V vs. NHE at pH 7)31 and cysteine (−0.36 V vs. NHE at pH 7).32 In this regard, cyclam is an excellent choice for the metal-binding group in HNO sensors, owing to its tight binding of Cu(II) (pKd ≈ 25)33 and the slow reaction of Cu–cyclam complexes with H2S and thiols.34 These criteria are validated in CuDHX1, the first near-infrared-emitting probe for HNO (Fig. 1).27 Metal-free fluorescent probes for HNO have also been developed based on its reaction with triphenylphosphines.35,36 In contrast to HNO probes, recently reported Cu-based fluorescent sensors for H2S and thiols rely on the affinity of Cu(II) for the sulfide or thiolate anions, respectively.37–40 For example, addition of cysteine to the Cu(II)–iminofluorescein complex Cu-1 (Fig. 1) leads to decomplexation of the metal and hydrolysis of the imine to form the brightly fluorescent fluorescein aldehyde.28 Achieving selectivity for thiols over H2S in metal-based probes remains a rare event, however.39,40 The different foregoing mechanisms highlight the importance of the proton- and metal-binding properties of the fluorescent ligand in imparting selectivity for a particular analyte.
Small-molecule fluorescent probes are typically obtained through cumbersome procedures involving several purification steps. New methods to facilitate sensor production and derivatization while circumventing complex syntheses are therefore highly desirable. In addressing this objective, we departed from traditional preparative routes. Making use of the unmatched ease and versatility offered by solid-phase synthesis, we introduce in this study a modular approach directed at separating the fluorophore and metal-chelating units of amino acid-based sensing constructs. We apply this method to generate the first analogues containing a single lysine (Lys) linker and further investigate the mechanism by which their Cu(II) complexes acquire selectivity for a particular bioanalyte. Finally, we demonstrate the utility and biological compatibility of the new probes through their ability to detect changes in intracellular nitroxyl and thiol concentrations in vitro.
Results and discussion
Design, synthesis, and photophysical properties
We prepared the new lysine-based fluorescent probes according to the synthetic strategy depicted in Scheme 1. | ||
| Scheme 1 General solid-phase strategy for production of fluorescent lysine-based sensing constructs. Abbreviations: Fmoc = fluorenylmethyloxycarbonyl; PG1, PG2 = orthogonal amine-protecting groups. | ||
Starting from a Rink amide resin, an orthogonally and doubly protected PG2-Lys(PG1)-OH linker was introduced on the solid-phase support. Deprotection of the PG1 group at the Lys ε-position afforded a free amine, which was then coupled under standard conditions (see ESI†) with a carboxy-functionalized fluorophore. After a second deprotection of the N-terminal PG2 group, the metal-binding site could be added directly on the resin. The final construct was cleaved with trifluoroacetic acid (TFA) (Route A, Scheme 1). Alternatively, for binding sites labile to the strongly acidic conditions of the TFA treatment, the construct containing the free N-terminal amine was first cleaved from the resin, and the final coupling reaction was performed in solution (Route B, Scheme 1). Notably, in order to obtain metal-free ligands, a single purification step is needed for Route A, whereas two purifications are required for Route B. Even though the final constructs obtained in this work contain C-terminal amide groups on the Lys backbone, the approach described herein is applicable to a wide range of commercially available resins, including those affording C-terminal free acid residues, or for which milder cleavage conditions can be used to address the chemical stability of the intermediates.
Building on knowledge gained from designing CuDHX1,27 we sought to achieve HNO selectivity for the first lysine conjugate, produced by employing Fmoc-Lys(Mtt)-OH as the linker, the yellow-emitting (λem ≈ 580 nm) rhodamine scaffold as the fluorescent moiety, and cyclam as the metal-binding site. Isomerically pure 5-carboxytetramethylrhodamine (5-CO2H-TAMRA, Scheme S3†)41 was first coupled to the Lys ε-position. Following reaction with iodoacetic acid N-hydroxysuccinimide ester (S9, Scheme S3†),42 the binding site was appended by stirring the resin with excess cyclam overnight in a dichloromethane–methanol solution. Cleavage and purification of the construct by semi-preparative HPLC afforded the cyclam–Lys–TAMRA conjugate (CLT, Fig. 2) in 21% yield based on the resin loading.
 | ||
| Fig. 2 Structures of the three fluorescent lysine conjugates obtained through the solid-phase approach of Scheme 1, highlighting in red the ligating atoms of the metal-binding sites. See ESI and Schemes S2–S5† for synthetic intermediates and experimental procedures. | ||
The Cu(II) complexes of NO20–24 and HNO27,30 metal-based sensors are typically generated in situ immediately before use by adding equimolar amounts of CuCl2 to concentrated stock solutions of the fluorescent ligands. Coordination of Cu(II) by the cyclam site of CLT in a 1![[thin space (1/6-em)]](https://www.rsc.org/images/entities/char_2009.gif) :1 ratio was achieved over several hours (data not shown). We wanted to avoid the long waiting time required to prepare the complex in situ, and anticipated that the high affinity of cyclam for Cu(II)33 might allow for pre-formed CuCLT to withstand chromatographic separations and subsequent storage either in the solid state or as stock solutions. Indeed, mixing pure CLT overnight with excess CuCl2 in water afforded CuCLT (Scheme S3†), which was purified by HPLC and isolated as its TFA salt in 61% yield.
:1 ratio was achieved over several hours (data not shown). We wanted to avoid the long waiting time required to prepare the complex in situ, and anticipated that the high affinity of cyclam for Cu(II)33 might allow for pre-formed CuCLT to withstand chromatographic separations and subsequent storage either in the solid state or as stock solutions. Indeed, mixing pure CLT overnight with excess CuCl2 in water afforded CuCLT (Scheme S3†), which was purified by HPLC and isolated as its TFA salt in 61% yield.
Taking note of the [N2O] metal-binding motif of NO-selective CuFL sensors (Fig. 1), we next directed our synthetic efforts toward producing a second lysine construct in which the cyclam of CLT was replaced with a quinoline-phenolate moiety, retaining the TAMRA fluorescent unit. To achieve this goal, a benzoic acid precursor containing the binding motif (S8, Scheme S2†) was prepared in a sequence involving reductive amination of 8-aminoquinaldine with methyl 4-formyl-3-hydroxybenzoate, followed by hydrolysis of the methyl benzoate intermediate (S7, Scheme S2†). Initial attempts at coupling S8 directly on the resin (Route A, Scheme 1) resulted in de-benzylation of the desired product during cleavage with TFA (data not shown). We avoided acid-induced labilization of the quinoline-phenolate moiety by performing the reaction of S8 with the free N-terminal amine of Lys–TAMRA in solution (Route B, Scheme 1). In a simplified procedure using Boc-Lys(Fmoc)-OH instead of Fmoc-Lys(Mtt)-OH, H-Lys–TAMRA (S10, Scheme S4, ESI†) was obtained in 24% isolated yield. The final quin–Lys–TAMRA conjugate (QLT, Fig. 2) was produced through amide coupling of H-Lys–TAMRA with S8 (Scheme S4, ESI†), and was isolated in 17% yield.
In order to test the generality while retaining modularity of the solid-phase approach described in Scheme 1, we replaced the TAMRA fluorophore of QLT with a green-emitting dichlorofluorescein scaffold. Using Boc-Lys(Fmoc)-OH and 3′,6′-diacetyl-2′,7′-dichloro-5-carboxyfluorescein (5-CO2H-FL, Scheme S5†),43 H-Lys–fluorescein (S11, Scheme S5†) was synthesized in a similar manner to H-Lys–TAMRA, albeit in a low, 6% isolated yield. Following the coupling of H-Lys–fluorescein with S8 under standard conditions in solution, the quin–Lys–fluorescein conjugate (QLF, Fig. 2) was obtained in 17% yield.
The identity and purity of CLT, CuCLT, QLT, and QLF were confirmed by spectroscopic and chromatographic techniques (see ESI and Fig. S1–S15†). The photophysical parameters of the three lysine conjugates were determined in aqueous buffer, pH 7.0 (Table S1, ESI†). In the metal-free form, CLT and QLT display absorption bands with maxima at 552 and 556 nm, respectively. QLF, on the other hand, absorbs at 511 nm. No spectral shifts were observed in the visible spectrum upon binding of Cu(II) to any of the three constructs, and only minor changes occurred in their molar absorptivities. Both the metal-free and Cu(II)-bound forms of CLT and QLT emit in the yellow spectral region at ∼580 nm (Table S1†). The analogous species of QLF exhibit green fluorescence maxima centered at ∼530 nm. The average brightness (ε × Φ) values of the CLT, QLT, and QLF constructs were determined to be 3.71 × 10⁴, 5.41 × 10³, and 2.33 × 10³ M−1 cm−1, respectively.
Analyte selectivity
With CuCLT in hand, its reactivity toward HNO was first investigated. Addition of excess HNO donor Angeli's salt44,45 to buffered aqueous solutions of CuCLT under anaerobic conditions resulted in an immediate ∼4-fold increase in fluorescence emission (Fig. 3A), thus confirming that the separation of the cyclam binding site from the fluorophore in the CLT ligand retains the HNO-sensing ability of the construct. A time-resolved fluorescence spectroscopy study revealed that the maximum emission turn-on of CuCLT upon reaction with HNO occurs ∼5 min after addition of Angeli's salt (Fig. S18A†). The dynamic range of the probe is in line with values previously reported for other Cu(II)-based HNO sensors,26,27,30 but remains significantly lower by comparison with reaction-based analogs.35,36 | ||
| Fig. 3 Normalized (A) fluorescence emission spectra and (B) integrated fluorescence response of 3.3 μM CuCLT vs. added Angeli's salt (AS) in aqueous buffer under anaerobic conditions (25 °C, 100 mM KCl, 50 mM PIPES, pH 7.0, λex = 540 nm). The inset shows the response of 5 μM CuCLT in the sub-stoichiometric range, recorded separately under similar conditions. | ||
We also determined ∼0.4 equiv. to be the lowest amount of Angeli's salt required to induce a ≥10% increase in the integrated emission of 5 μM CuCLT at pH 7 (Fig. 3B). Remarkably, the sensitivity of CuCLT toward HNO was more than 100-fold greater than the CuDHX1 sensor containing a similar cyclam metal-binding site (i.e., 50 equiv. Angeli's salt).27 The detection limit (see ESI†) of CuCLT for Angeli's salt calculated under these conditions is 360 nM. Because of the difficulties in estimating the exact concentration of HNO in an aqueous solution of Angeli's salt and the marked reactivity of nitroxyl,45 we refrain from reporting a detection limit of CuCLT for HNO.
The NO reactivity of CuQLT and CuQLF was investigated next. Addition of excess NO gas or the NO donors S-nitroso-N-acetyl-DL-penicillamine (SNAP) and S-nitrosoglutathione (GSNO) to air-free aqueous solutions of the probes did not elicit a fluorescence response at pH 7. Instead, CuQLT and CuQLF displayed 5.5- and 10-fold increases in their integrated fluorescence emission following treatment with excess L-cysteine (Cys) (Fig. 4, 5, and S20†), suggesting that the two complexes might be useful as sensors for biological thiols.
 | ||
| Fig. 4 Normalized (A) fluorescence emission spectra and (B) integrated fluorescence response of 1 μM CuQLT vs. added L-cysteine (Cys) in aqueous buffer (25 °C, 100 mM KCl, 50 mM PIPES, pH 7.0, λex = 540 nm). | ||
 | ||
| Fig. 5 Selectivity of 2 μM CuCLT and CuQLT toward RNOS and other biological analytes in aqueous buffer (37 °C, 100 mM KCl, 50 mM PIPES, pH 7.0). For each sample, the fluorescence emission was recorded in triplicate before and 20 min after addition of excess analyte (1500 equiv. NO, 500 equiv. all other). The measurements for OH− were conducted in 10 mM aq. NaOH. The integrated fluorescence response was normalized in each case to the initial fluorescence of the metal-bound complexes. In all cases, excitation was provided at 540 nm and the emission intensity was integrated between 550 and 700 nm. | ||
Time-dependent fluorescence spectroscopy indicated that the reaction of CuQLT with Cys was complete after ∼25 min (Fig. S18B†). Furthermore, the lowest amount of Cys required to induce a ≥10% increase in the integrated emission of 1 μM CuQLT at pH 7 was determined to be ∼4 equiv. (Fig. 4B), corresponding to a detection limit of 1.2 μM. The inertness of CuQLT and CuQLF toward NO demonstrates how separation of the binding motif from the fluorophore can lead to unexpected chemistry in the final sensing construct.
We evaluated the ability of CuCLT, CuQLT, and CuQLF to selectively detect nitroxyl and thiols, respectively. A thorough study of the fluorescence response of the three probes was conducted against a broad range of RNOS and other species present in live cells (Fig. 5 and S20†). In pH 7 buffered aqueous solutions, CuCLT remained selective for nitroxyl over any other analyte that we investigated, including reducing agents such as H2S, ascorbate, and thiols. On the other hand, CuQLT was selective for cysteine and glutathione over all other species studied except nitroxyl, which generated a minor ∼2-fold fluorescence increase (Fig. 5). A strong fluorescence increase occurred when CuQLT was treated with SNAP and GSNO in air (Fig. 5), consistent with the accelerated aerobic decomposition of the NO donors in the presence of copper ions46 and concomitant formation of the corresponding thiols. Notably, the selectivity for thiols was retained when the tetramethylrhodamine fluorophore of CuQLT was replaced with dichlorofluorescein in CuQLF (Fig. S20†). Addition of Cys to aqueous solutions of the metal-free QLT and QLF ligands did not produce a change in fluorescence emission (Fig. S17†), confirming that binding of Cu(II) is required in order to impart reactivity toward thiols. Given that Cu(II)-based sensors are typically susceptible to HS−/S2− attacks,39,40 the selectivity of the three sensors for nitroxyl and thiols over hydrogen sulfide is of particular importance in view of their potential applications in a biological system. To further test their inertness toward sulfide, aqueous solutions of the sensors were saturated by H2S gas, revealing no increase in fluorescence emission in either case (Fig. S16†). The results of the selectivity study recommend CuCLT, CuQLT, and CuQLF as suitable sensors for use in biological samples without interference from H2S and NO-generating species.
Mechanistic investigations
Having established the reactivity of the three lysine-based probes in the cuvette, we next attempted to elucidate the mechanisms responsible for the observed chemistry. | ||
| Fig. 6 X-band EPR spectra of anaerobic 400 μM solutions of (A) CuCLT and (B) CuQLT in methanol, recorded in the absence (black lines) and after the addition (red lines) of 100 equiv. of (A) Angeli's salt and (B) L-cysteine, respectively. The solutions were removed from the glove box and frozen 5 and 15 min after the addition of the analytes, respectively. Collection parameters: temperature, 77 K; modulation amplitude, 20 G; microwave power, 0.02 mW at 9.16 GHz. | ||
The small change observed only for the gy component upon addition of Angeli's salt (Δgy = 0.007) calls into question a conclusion based on EPR data regarding changes in the metal coordination environment. The inability to trap the reduced Cu(I) form upon reaction with nitroxyl was previously reported for cyclam-based HNO sensors.27 This result suggests that reduction of Cu(II) to Cu(I) by HNO is followed by a fast re-oxidation of the Cu(I) species by residual oxygen admitted to the EPR tube, by NO produced in the reaction of HNO with CuCLT, or by one of the degradation products of HNO in solution.45 Cu(I)-mediated disproportionation of NO is a well-documented transformation leading to Cu(II)–NO2− and N2O.50 Proton-assisted reduction of NO with Cu(I) complexes was previously reported.51 Furthermore, the reduction potential of −0.8 V vs. NHE determined for CuCLT in PBS shows that it can be oxidized by NO. The fluorescence turn-on observed upon addition of Angeli's salt to CuCLT in methanol confirmed that a reaction with HNO took place (Fig. S26A†). An ESI-MS analysis of the EPR solutions of CuCLT with and without added Angeli's salt (Fig. S25†) revealed for the former a species with m/z = 906.5, consistent with an [M + NO2]+ formula in which the trifluoroacetate counterions are replaced with nitrite anions, which can accumulate in solution as a result of decomposition of Angeli's salt45 or disproportionation of NO.50,51 Treatment of CuCLT with 100 equiv. of NaNO2 in methanol did not produce a fluorescence turn-on (Fig. S26B†), confirming that HNO is the species responsible for the observed reactivity. Furthermore, the CuCLT + NaNO2 solution displayed an EPR signal identical to the initial spectrum of CuCLT recorded in the absence of Angeli's salt (Fig. S24D†).
Taken together, the foregoing data support reduction of Cu(II) in CuCLT by HNO followed by a fast reoxidation with retention of copper in the cyclam binding site. This hypothesis is further confirmed by the broad resonances and small (<0.1 ppm) differences in chemical shifts observed in the 1H NMR spectra of CuCLT acquired before and after anaerobic addition of Angeli's salt (Fig. S27†).
In the case of CuQLT, the EPR spectrum recorded in the absence of cysteine showed an axial signal with g‖ = 2.415 and g⊥ = 2.079 (Fig. 6B); the simulated trace is provided in Fig. S24C.† The signal may be assigned to a distorted tetrahedral Cu(II) complex, consistent with coordination of the [N2O] binding site and an additional ligand, possibly Cl− originating from the CuCl2 stock solution used to prepare the complex in situ. Upon anaerobic addition of 100 equiv. of cysteine, the solution became EPR-silent, indicating reduction to Cu(I). ESI-MS of this solution revealed the peak of the protonated QLT ligand at m/z = 848.5 as the only detectable species (Fig. S25D†). The silent EPR signal was preserved upon exposure of the CuQLT + Cys solution to air for 15 min (Fig. 6B). We note that stable Cu(I)–Cys complexes were previously isolated under anaerobic conditions.52 In a 1H NMR spectroscopic study, broadening of the QLT resonances was observed after addition of CuCl2 to the NMR tube, confirming that binding of Cu(II) had occurred (Fig. S28†). Subsequent addition of excess Cys to the same sample sharpened the 1H resonances, in support of the EPR results indicating Cu(II) reduction. Even though metal decomplexation has been documented as the mechanism responsible for thiol sensing in previously reported Cu(II)-based fluorescent probes,28,53,54 EPR studies, to the best of our knowledge, have not yet been performed to address the oxidation state and stability of the derived Cu species. In conclusion, the spectroscopic observations for CuQLT favor metal reduction by thiolates and removal of the Cu(I) ion from the quinoline-phenolate binding site together with enhancement of fluorescence emission.
Live cell imaging studies
The ability of the new probes to detect their specific analytes in vitro was investigated in live HeLa cells. Both TAMRA-based lysine conjugates CuCLT and CuQLT readily enter cells following incubation at concentrations of 3 to 5 μM. Because of its chemical inertness to thiols, CuCLT was incubated in either PBS or dye- and serum-free DMEM growth medium. Incubation of cells with CuQLT was performed exclusively in PBS to avoid interference of thiols. The fluorescein-based construct CuQLF displayed insufficient cellular permeability for detection of a fluorescent signal, therefore preventing its application as an intracellular probe for biological thiols (Fig. S30†). | ||
| Fig. 7 Fluorescence microscopy images of live HeLa cells incubated with 4 μM CuCLT at 37 °C for 15 min in phosphate buffer saline (PBS). Top: cells treated with Angeli's salt (AS). (A) Differential interference contrast (DIC) image. CuCLT signal (B) before and (C) 10 min after treatment with 1.5 mM AS on the microscope stage. Bottom: cells treated with Na2S. (D) DIC image. CuCLT signal (E) before and (F) 10 min after treatment with 1.25 mM Na2S on the microscope stage. (G) Quantification of the intracellular fluorescence response of CuCLT (mean ± SD, N = 51 for Na2S, N = 44 for AS). Scale bar = 15 μm. For full-field images and associated nuclear staining, see Fig. S31.† | ||
Co-localization analysis of CuCLT with various organelle markers revealed a moderate55 correlation in overlap with LysoTracker Green (Pearson's correlation coefficient,56r = 0.5 ± 0.1, N = 34, Fig. 8), suggesting preferential, but not exclusive accumulation of the sensor in acidic vesicles. To confirm that the partially punctate pattern observed is not due to attachment of CuCLT to the outer cellular membrane, we assembled 3D representations of the cells from images collected along the Z-axis. The spatial distribution of CuCLT, determined from the reconstructed 3D overlays of CuCLT and the nuclear stain Hoechst 33258 (Fig. S32†), clearly indicates internalization of the sensor inside the cells.
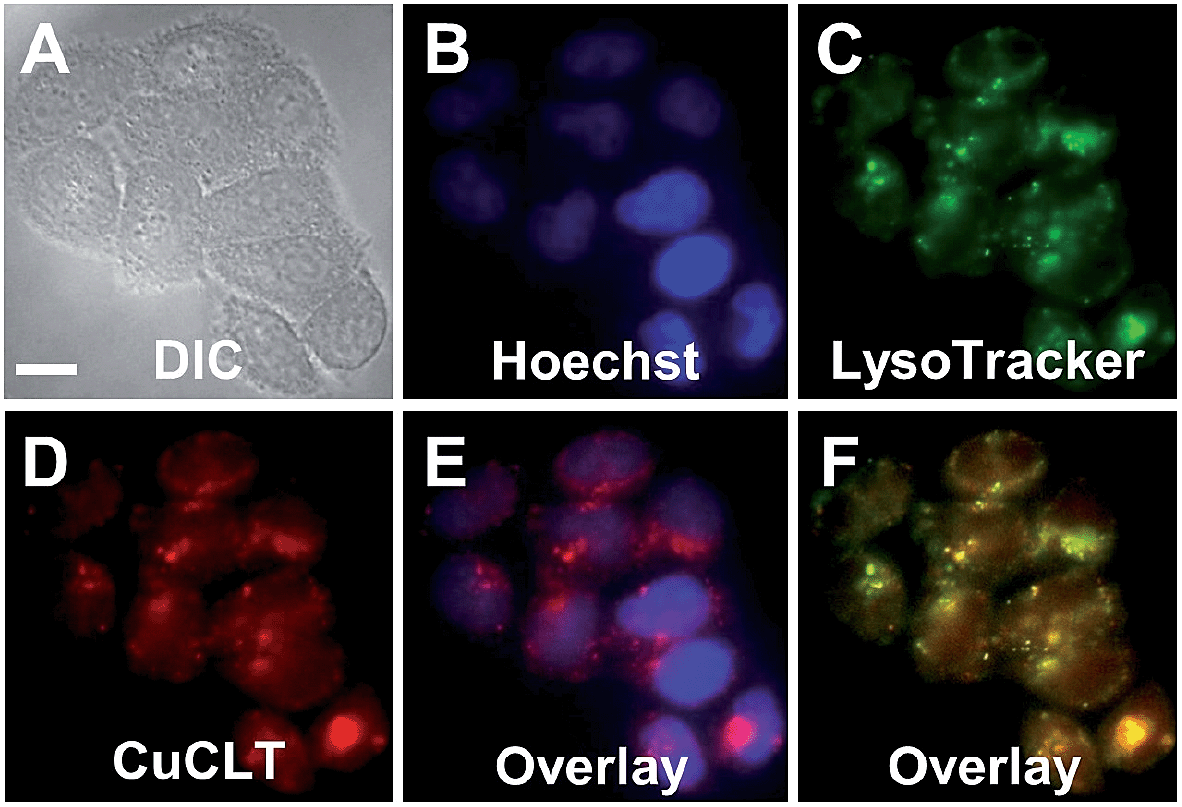 | ||
| Fig. 8 Co-localization analysis of CuCLT with organelle-specific markers in live HeLa cells incubated with 4 μM CuCLT, 15 μM Hoechst 33258, and 100 nM LysoTracker Green at 37 °C for 15 min in dye- and serum-free DMEM. (A) DIC image. (B) Signal from Hoechst 33258. (C) Signal from LysoTracker Green. (D) Signal from CuCLT. (E) Overlay of Hoechst 33258 and CuCLT. (F) Overlay of LysoTracker Green and CuCLT. Scale bar = 15 μm. | ||
Co-incubation of HeLa cells with CuCLT and the NO-selective probe Cu2FL2E,23 and the subsequent addition of excess NO donor GSNO, generated a strong, ∼3.6-fold increase only in the intracellular green fluorescence emission of Cu2FL2E, demonstrating that CuCLT retains selectivity for HNO over NO and S-nitrosothiols in cells (Fig. 9).
 | ||
| Fig. 9 Multicolor fluorescence microscopy of HeLa cells incubated with 4 μM CuCLT, 15 μM Hoechst 33258, and 2 μM Cu2FL2E at 37 °C for 15 min in PBS. (A) DIC image. Signal from Cu2FL2E (B) before and (E) 20 min after treatment with 1.5 mM GSNO on the microscope stage. Signal from CuCLT (C) before and (F) 20 min after treatment with 1.5 mM GSNO. (D) Signal from Hoechst 33258. (G) Quantification of the intracellular fluorescence response of Cu2FL2E and CuCLT (mean ± SD, N = 32). Scale bar = 15 μm. | ||
In order to probe whether CuCLT can detect HNO formed endogenously in a biological process, we applied the sensor in a multicolor imaging experiment to study the reduction of intracellular S-nitrosothiols (RSNO) by ascorbate. In the absence of Cu(I) ions, ascorbate reacts with RSNO to generate the corresponding thiol (RSH) and O-nitrosoascorbate, which may then further decay following several pathways, one of them yielding HNO and dehydroascorbic acid (Scheme S6, ESI†).57,58 The HNO thus produced may further react with additional RSNO moieties to liberate NO and RSH.58 Intracellular generation of HNO following treatment of endothelial cells with ascorbate was recently demonstrated by a combination of amperometric and fluorescence microscopy methods.14 On the other hand, S-nitrosothiols are converted to the corresponding disulfides in the presence of Cu(I), liberating one equiv. of NO per RSNO unit.46 Thus, the interplay between HNO and NO generated upon cellular stimulation with ascorbate becomes an event that can be visualized with an adequate pair of fluorescent sensors selective for the two analytes. We therefore employed CuCLT and Cu2FL2E to detect HNO and NO, respectively, in live cells under normal (control) and RSNO-enriched conditions (Fig. 10). The intracellular RSNO content was increased by treatment of the cells with the NO donor DETA NONOate.
 | ||
| Fig. 10 Multicolor fluorescence microscopy of live HeLa cells incubated with 3 μM CuCLT, 15 μM Hoechst 33258, and 2 μM Cu2FL2E at 37 °C for 15 min in PBS (A–F) or dye- and serum-free DMEM (H–M). (A–G) Control cells. (A) DIC image. Signal from Cu2FL2E (B) before and (E) 10 min after treatment with 1.5 mM of sodium ascorbate (NaAsc) on the microscope stage. Signal from CuCLT (C) before and (F) 10 min after treatment with 1.5 mM NaAsc. (D) Signal from Hoechst 33258. (G) Quantification of the intracellular fluorescence response of Cu2FL2E and CuCLT (mean ± SD, N = 40). (H–N) Cells pre-treated with 200 μM DETA NONOate for 20 h at 37 °C in DMEM. (H) DIC image. Signal from Cu2FL2E (I) before and (L) 10 min after treatment with 1.5 mM of NaAsc. Signal from CuCLT (J) before and (M) 10 min after treatment with 1.5 mM NaAsc. (K) Signal from Hoechst 33258. (N) Quantification of the intracellular fluorescence response of Cu2FL2E and CuCLT (mean ± SD, N = 36). Scale bar = 15 μm. | ||
Addition of 1.5 mM sodium ascorbate to control cells increased only the intracellular green fluorescence of the NO-selective Cu2FL2E probe by ∼2.1-fold (Fig. 10A–G), whereas addition of the same amount of ascorbate to cells in which intracellular RSNO levels were increased with DETA NONOate enhanced the fluorescence of both Cu2FL2E and CuCLT by ∼3.8-fold and ∼1.4-fold, respectively (Fig. 10H–N). Notably, the average value of the intracellular turn-on achieved for CuCLT in DETA NONOate-treated cells upon stimulation with ascorbate matched the positive control for HNO in cells treated with Angeli's salt (Fig. 7G). At the same time, the increase in intracellular RSNO levels and subsequent generation of NO was reflected in the doubling of the average fluorescence turn-on of Cu2FL2E, consistent with the positive control in cells following exogenous addition of GSNO (Fig. 9G). The lack of a fluorescence response from CuCLT in ascorbate-stimulated control cells suggests that the amount of HNO formed under normal RSNO conditions is too low to allow for intracellular detection by the sensor. In a cuvette, excess addition of an equimolar ascorbate–GSNO mixture to CuCLT in aqueous buffer did not produce an increase in fluorescence (Fig. S37A†), consistent with HNO generated by O-nitrosoascorbate at pH 7 being instantly consumed by excess GSNO and glutathione (GSH), in accord with previously reported studies.58 Formation of glutathione in the reaction of ascorbate with GSNO was demonstrated by the large fluorescence turn-on displayed by the thiol-selective probe CuQLT under similar conditions (Fig. S37B†), an increase much greater than when CuQLT was treated with GSNO alone. Excess ascorbate added to aqueous Cu2FL2E did not elicit a fluorescence response (Fig. S37C†), confirming that its intracellular fluorescence increase arises from reaction with endogenously produced NO. These results demonstrate the utility of CuCLT for intracellular detection of nitroxyl and strongly suggest that HNO can be produced endogenously in the reaction of ascorbate with S-nitrosothiols. A definitive proof of this hypothesis would benefit from in vivo studies confirming endogenous HNO production by an orthogonal method.
 | ||
| Fig. 11 Fluorescence microscopy images of live HeLa cells incubated with 4 μM CuQLT at 37 °C for 15 min in PBS. Top: control cells. (A) DIC image. CuQLT signal (B) before and (C) 15 min after treatment with 1.5 mM GSNO on the microscope stage. Bottom: cells pre-incubated with 1 mM N-methylmaleimide (NMM) in PBS for 30 min at 37 °C. (D) DIC image. CuQLT signal (E) before and (F) 15 min after treatment with 1.5 mM GSNO on the microscope stage. (G) Quantification of the intracellular fluorescence response of CuQLT (mean ± SD, N = 21 for control cells, N = 20 for NMM-treated cells). Scale bar = 15 μm. For full-field images and associated nuclear staining, see Fig. S33.† | ||
To reverse the intracellular fluorescence of CuQLT, L-cysteine was first added alone to NMM-treated cells, inducing a strong increase in the signal (Fig. S34†). Addition of 1.5 mM Angeli's salt to NMM-treated cells incubated with CuQLT did not produce a fluorescence increase, but subsequent addition of 3 mM Cys to the same imaging dish elicited a rapid 2-fold enhancement of the signal in the red channel (Fig. S35†). These observations are consistent with the reactivity profile of CuQLT determined in the cuvette (Fig. 5), establishing the selectivity of the probe for thiols in a live environment in the presence of HNO.
Finally, the ability of CuQLT to detect thiols selectively over H2S in cells was investigated. In contrast to results obtained in the cuvette, adding exogenous Na2S to NMM-treated cells incubated with CuQLT generated a surprising ∼2.4-fold increase in intracellular fluorescence (Fig. 12A–C).
 | ||
| Fig. 12 Fluorescence microscopy images of live HeLa cells incubated with 4 μM CuQLT at 37 °C for 15 min in PBS. Top: control cells. (A) DIC image. CuQLT signal (B) before and (C) 15 min after treatment with 1.25 mM Na2S on the microscope stage. Bottom: cells pre-treated with 200 μM DETA NONOate for 20 h at 37 °C in DMEM. (D) DIC image. CuQLT signal (E) before and (F) 15 min after treatment with 1.25 mM Na2S on the microscope stage. Both sets of cells were pre-incubated with 1 mM NMM in PBS for 30 min at 37 °C. (G) Quantification of the intracellular fluorescence response of CuQLT (mean ± SD, N = 52 for control cells, N = 34 for DETA NONOate-treated cells). Scale bar = 15 μm. For full-field images and associated nuclear staining, see Fig. S36.† | ||
Previous reports proposed exogenous H2S as a source of endogenous RSH and HSNO, based on its reaction with intracellular RSNO.12 To further verify this biological pathway, we increased the endogenous RSNO content of the cells by treatment with DETA NONOate and depleted the free thiols with NMM. Addition of Na2S to these cells brought about a dramatic ∼12-fold increase in the integrated CuQLT fluorescence (Fig. 12D–F), an outcome consistent with the intracellular release of a significantly higher amount of thiols. Control experiments in the cuvette confirmed the production of glutathione through the strong increase in the fluorescence of CuQLT upon treatment with an equimolar mixture of Na2S and GSNO (Fig. S37B†). CuQLT is therefore able to selectively detect RSH in cells and distinguish distinct concentrations of thiols endogenously produced in a biological process.
Conclusions
We established a biocompatible solid-phase approach to separate the fluorescent reporter and binding unit of small-molecule metal-based sensors and tested its modularity by producing three conjugates with a lysine backbone. The first two, functionalized with a yellow-emitting tetramethyl-rhodamine fluorophore, contain an [N4] (cyclam) and an [N2O] (quinoline-phenolate) metal-binding site, respectively, while the third retains the [N2O] motif along with a green-emitting dichlorofluorescein moiety. The active, metal-bound forms of the probes, termed CuCLT, CuQLT, and CuQLF, operate by modulating the oxidation state of a ligated Cu(II) ion. We demonstrated the selectivity of (i) CuCLT for sensing HNO and (ii) CuQLT and CuQLF for sensing biological thiols. The mechanism responsible for the observed reactivity in each case was investigated by spectroscopic (fluorescence, EPR, and NMR) and voltammetric methods. The experimental evidence collected supports a mechanism involving reduction of Cu(II) in CuCLT by HNO followed by a fast reoxidation with retention of the metal in the cyclam binding site, whereas cysteine reduces Cu(II) in CuQLT with attendant expulsion of the Cu(I) species. CuCLT and CuQLT are readily cell permeable and retain their analyte selectivity intracellularly, even in the presence of potentially interfering species such as nitric oxide, nitrosothiols, and hydrogen sulfide. We further employed CuCLT and CuQLT to distinguish between different levels of intracellular HNO and thiols generated upon stimulation of live HeLa cells with ascorbate and sulfide anions, respectively. The successful application of the lysine-based sensors to gain insight into proposed biosynthetic pathways validates the utility of our method and envisions an extension of it from a simple lysine to a peptide backbone. Solid-phase techniques, offering the possibility of altering the light-emitting and metal-binding moieties, provide a tool for expedient production of a library of analogues with minimal synthetic and purification work. Future probes, enacting both predicted and new chemistry, should allow simultaneous and selective multicolor visualization of a variety of species present in live cells, advancing our understanding of their biology.Acknowledgements
This work was supported by the National Science Foundation under grant CHE-1265770. Spectroscopic instrumentation in the MIT DCIF is maintained with funding from NIH grant 1S10RR13886-01. We thank Dr. Jacob Goldberg for providing a sample of 5-CO2H-FL. Dr. Timothy Johnstone is gratefully acknowledged for assistance with cyclic voltammetry studies.Notes and references
- R. F. Furchgott and J. V. Zawadzki, Nature, 1980, 288, 373–376 CrossRef CAS PubMed.
- M. D. Pluth, E. Tomat and S. J. Lippard, Annu. Rev. Biochem., 2011, 80, 333–355 CrossRef CAS PubMed.
- V. Calabrese, C. Mancuso, M. Calvani, E. Rizzarelli, D. A. Butterfield and A. M. G. Stella, Nat. Rev. Neurosci., 2007, 8, 766–775 CrossRef CAS PubMed.
- A. Carreau, C. Kieda and C. Grillon, Exp. Cell Res., 2011, 317, 29–41 CrossRef CAS PubMed.
- J. J. Turchi, Proc. Natl. Acad. Sci. U. S. A., 2006, 103, 4337–4338 CrossRef CAS PubMed.
- J. M. Fukuto, A. S. Dutton and K. N. Houk, ChemBioChem, 2005, 6, 612–619 CrossRef CAS PubMed.
- J. M. Fukuto, C. H. Switzer, K. M. Miranda and D. A. Wink, Annu. Rev. Pharmacol. Toxicol., 2005, 45, 335–355 CrossRef CAS PubMed.
- M. E. Murphy and H. Sies, Proc. Natl. Acad. Sci. U. S. A., 1991, 88, 10860–10864 CrossRef CAS.
- N. Sakai, S. Kaufman and S. Milstien, Mol. Pharmacol., 1993, 43, 6–10 CAS.
- M. A. Sharpe and C. E. Cooper, Biochem. J., 1998, 332, 9–19 CrossRef CAS PubMed.
- S. Adak, Q. Wang and D. J. Stuehr, J. Biol. Chem., 2000, 275, 33554–33561 CrossRef CAS PubMed.
- M. R. Filipovic, J. L. Miljkovic, T. Nauser, M. Royzen, K. Klos, T. Shubina, W. H. Koppenol, S. J. Lippard and I. Ivanovic-Burmazovic, J. Am. Chem. Soc., 2012, 134, 12016–12027 CrossRef CAS PubMed.
- J. L. Miljkovic, I. Kenkel, I. Ivanovic-Burmazovic and M. R. Filipovic, Angew. Chem., Int. Ed., 2013, 52, 12061–12064 CrossRef CAS PubMed.
- S. A. Suarez, N. I. Neuman, M. Muñoz, L. Álvarez, D. E. Bikiel, C. D. Brondino, I. Ivanović-Burmazović, J. L. Miljkovic, M. R. Filipovic, M. A. Martí and F. Doctorovich, J. Am. Chem. Soc., 2015, 137, 4720–4727 CrossRef CAS PubMed.
- M. L. Bullen, A. A. Miller, K. L. Andrews, J. C. Irvine, R. H. Ritchie, C. G. Sobey and B. K. Kemp-Harper, Antioxid. Redox Signaling, 2011, 14, 1675–1686 CrossRef CAS PubMed.
- N. Paolocci, W. F. Saavedra, K. M. Miranda, C. Martignani, T. Isoda, J. M. Hare, M. G. Espey, J. M. Fukuto, M. Feelisch, D. A. Wink and D. A. Kass, Proc. Natl. Acad. Sci. U. S. A., 2001, 98, 10463–10468 CrossRef CAS PubMed.
- C. U. Choe, J. Lewerenz, C. Gerloff, T. Magnus and S. Donzelli, Antioxid. Redox Signaling, 2011, 14, 1699–1711 CrossRef CAS PubMed.
- L. E. McQuade and S. J. Lippard, Curr. Opin. Chem. Biol., 2010, 14, 43–49 CrossRef CAS PubMed.
- The Molecular Probes Handbook, ed. I. Johnson and M. T. Z. Spence, Life Technologies, 2010 Search PubMed.
- M. H. Lim, B. A. Wong, W. H. Pitcock, Jr., D. Mokshagundam, M.-H. Baik and S. J. Lippard, J. Am. Chem. Soc., 2006, 128, 14364–14373 CrossRef CAS PubMed.
- M. H. Lim, D. Xu and S. J. Lippard, Nat. Chem. Biol., 2006, 2, 375–380 CrossRef CAS PubMed.
- L. E. McQuade and S. J. Lippard, Inorg. Chem., 2010, 49, 7464–7471 CrossRef CAS PubMed.
- L. E. McQuade, J. Ma, G. Lowe, A. Ghatpande, A. Gelperin and S. J. Lippard, Proc. Natl. Acad. Sci. U. S. A., 2010, 107, 8525–8530 CrossRef CAS PubMed.
- M. D. Pluth, L. E. McQuade and S. J. Lippard, Org. Lett., 2010, 12, 2318–2321 CrossRef CAS PubMed.
- M. D. Pluth, M. R. Chan, L. E. McQuade and S. J. Lippard, Inorg. Chem., 2011, 50, 9385–9392 CrossRef CAS PubMed.
- U. P. Apfel, D. Buccella, J. J. Wilson and S. J. Lippard, Inorg. Chem., 2013, 52, 3285–3294 CrossRef CAS PubMed.
- A. T. Wrobel, T. C. Johnstone, A. D. Liang, S. J. Lippard and P. Rivera-Fuentes, J. Am. Chem. Soc., 2014, 136, 4697–4705 CrossRef CAS PubMed.
- H. Wang, G. Zhou and X. Chen, Sens. Actuators, B, 2013, 176, 698–703 CrossRef CAS.
- L. E. McQuade, M. D. Pluth and S. J. Lippard, Inorg. Chem., 2010, 49, 8025–8033 CrossRef CAS PubMed.
- J. Rosenthal and S. J. Lippard, J. Am. Chem. Soc., 2010, 132, 5536–5537 CrossRef CAS PubMed.
- M. D. Bartberger, W. Liu, E. Ford, K. M. Miranda, C. Switzer, J. M. Fukuto, P. J. Farmer, D. A. Wink and K. N. Houk, Proc. Natl. Acad. Sci. U. S. A., 2002, 99, 10958–10963 CrossRef CAS PubMed.
- R. A. Alberty, Biophys. Chem., 2004, 111, 115–122 CrossRef CAS PubMed.
- E. A. Ambundo, M. V. Deydier, A. J. Grall, N. Aguera-Vega, L. T. Dressel, T. H. Cooper, M. J. Heeg, L. A. Ochrymowycz and D. B. Rorabacher, Inorg. Chem., 1999, 38, 4233–4242 CrossRef CAS.
- K. Sasakura, K. Hanaoka, N. Shibuya, Y. Mikami, Y. Kimura, T. Komatsu, T. Ueno, T. Terai, H. Kimura and T. Nagano, J. Am. Chem. Soc., 2011, 133, 18003–18005 CrossRef CAS PubMed.
- K. Kawai, N. Ieda, K. Aizawa, T. Suzuki, N. Miyata and H. Nakagawa, J. Am. Chem. Soc., 2013, 135, 12690–12696 CrossRef CAS PubMed.
- Z. R. Miao, J. A. Reisz, S. M. Mitroka, J. Pan, M. Xian and S. B. King, Bioorg. Med. Chem. Lett., 2015, 25, 16–19 CrossRef CAS PubMed.
- M. G. Choi, S. Cha, H. Lee, H. L. Jeon and S. K. Chang, Chem. Commun., 2009, 7390–7392 RSC.
- X. Chen, Y. Zhou, X. Peng and J. Yoon, Chem. Soc. Rev., 2010, 39, 2120–2135 RSC.
- H. Peng, W. Chen, Y. Cheng, L. Hakuna, R. Strongin and B. Wang, Sensors, 2012, 12, 15907–15946 CrossRef CAS PubMed.
- H. S. Jung, X. Chen, J. S. Kim and J. Yoon, Chem. Soc. Rev., 2013, 42, 6019–6031 RSC.
- M. V. Kvach, I. A. Stepanova, I. A. Prokhorenko, A. P. Stupak, D. A. Bolibrukh, V. A. Korshun and V. V. Shmanai, Bioconjugate Chem., 2009, 20, 1673–1682 CrossRef CAS PubMed.
- E. S. Rector, K. S. Tse, A. H. Sehon and R. J. Schwenk, J. Immunol. Methods, 1978, 24, 321–336 CrossRef CAS PubMed.
- C. C. Woodroofe, R. Masalha, K. R. Barnes, C. J. Frederickson and S. J. Lippard, Chem. Biol., 2004, 11, 1659–1666 CrossRef CAS PubMed.
- S. B. King and H. T. Nagasawa, Methods Enzymol., 1999, 301, 211–220 CAS.
- K. M. Miranda, A. S. Dutton, L. A. Ridnour, C. A. Foreman, E. Ford, N. Paolocci, T. Katori, C. G. Tocchetti, D. Mancardi, D. D. Thomas, M. G. Espey, K. N. Houk, J. M. Fukuto and D. A. Wink, J. Am. Chem. Soc., 2005, 127, 722–731 CrossRef CAS PubMed.
- R. J. Singh, N. Hogg, J. Joseph and B. Kalyanaraman, J. Biol. Chem., 1996, 271, 18596–18603 CrossRef CAS PubMed.
- M. Sauer, K. T. Han, R. Muller, S. Nord, A. Schulz, S. Seeger, J. Wolfrum, J. Arden-Jacob, G. Deltau, N. J. Marx, C. Zander and K. H. Drexhage, J. Fluoresc., 1995, 5, 247–261 CrossRef CAS PubMed.
- V. Shafirovich and S. V. Lymar, Proc. Natl. Acad. Sci. U. S. A., 2002, 99, 7340–7345 CrossRef CAS PubMed.
- W. Flores-Santana, D. J. Salmon, S. Donzelli, C. H. Switzer, D. Basudhar, L. Ridnour, R. Cheng, S. A. Glynn, N. Paolocci, J. M. Fukuto, K. M. Miranda and D. A. Wink, Antioxid. Redox Signaling, 2011, 14, 1659–1674 CrossRef CAS PubMed.
- I. M. Wasser, S. de Vries, P. Moenne-Loccoz, I. Schroder and K. D. Karlin, Chem. Rev., 2002, 102, 1201–1234 CrossRef CAS PubMed.
- S. Kim, M. A. Siegler and K. D. Karlin, Chem. Commun., 2014, 50, 2844–2846 RSC.
- A. Rigo, A. Corazza, M. L. di Paolo, M. Rossetto, R. Ugolini and M. Scarpa, J. Inorg. Biochem., 2004, 98, 1495–1501 CrossRef CAS PubMed.
- X. F. Yang, P. Liu, L. Wang and M. Zhao, J. Fluoresc., 2008, 18, 453–459 CrossRef CAS PubMed.
- H. S. Jung, J. H. Han, Y. Habata, C. Kang and J. S. Kim, Chem. Commun., 2011, 47, 5142–5144 RSC.
- V. Zinchuk, Y. Wu and O. Grossenbacher-Zinchuk, Sci. Rep., 2013, 3, 1365 CAS.
- A. P. French, S. Mills, R. Swarup, M. J. Bennett and T. P. Pridmore, Nat. Protoc., 2008, 3, 619–628 CrossRef CAS PubMed.
- A. Kytzia, H. G. Korth, R. Sustmann, H. de Groot and M. Kirsch, Chem.–Eur. J., 2006, 12, 8786–8797 CrossRef CAS PubMed.
- M. Kirsch, A. M. Buscher, S. Aker, R. Schulz and H. de Groot, Org. Biomol. Chem., 2009, 7, 1954–1962 CAS.
- J. Yin, Y. Kwon, D. Kim, D. Lee, G. Kim, Y. Hu, J. H. Ryu and J. Yoon, J. Am. Chem. Soc., 2014, 136, 5351–5358 CrossRef CAS PubMed.
Footnote |
| † Electronic supplementary information (ESI) available: Experimental procedures, reaction schemes, NMR and MS spectra, HPLC traces, additional fluorescence emission spectra, selectivity of CuQLF, determination of Cu(II) dissociation constants, cyclic voltammetry studies, simulated EPR spectra, full-field view fluorescence microscopy images. See DOI: 10.1039/c5sc00880h |
| This journal is © The Royal Society of Chemistry 2015 |