 Open Access Article
Electrochemical study of a nonheme Fe(II) complex in the presence of dioxygen. Insights into the reductive activation of O2 at Fe(II) centers†
Nathalie
Ségaud
a,
Elodie
Anxolabéhère-Mallart
*b,
Katell
Sénéchal-David
a,
Laura
Acosta-Rueda‡
a,
Marc
Robert
b and
Frédéric
Banse
*a
aInstitut de Chimie Moléculaire et des Matériaux d'Orsay, UMR CNRS 8182, Université Paris Sud, F-91405 Orsay Cedex, France. E-mail: frederic.banse@u-psud.fr
bLaboratoire d'Electrochimie Moléculaire, Université Paris Diderot, Sorbonne Paris Cité, F-75205 PARIS CEDEX 13, France. E-mail: elodie.anxolabehere@univ-paris-diderot.fr
First published on 16th September 2014
Abstract
Recent efforts to model the reactivity of iron oxygenases have led to the generation of nonheme FeIII(OOH) and FeIV(O) intermediates from FeII complexes and O2 but using different cofactors. This diversity emphasizes the rich chemistry of nonheme Fe(II) complexes with dioxygen. We report an original mechanistic study of the reaction of [(TPEN)FeII]2+ with O2 carried out by cyclic voltammetry. From this FeII precursor, reaction intermediates such as [(TPEN)FeIV(O)]2+, [(TPEN)FeIII(OOH)]2+ and [(TPEN)FeIII(OO)]+ have been chemically generated in high yield, and characterized electrochemically. These electrochemical data have been used to analyse and perform simulation of the cyclic voltammograms of [(TPEN)FeII]2+ in the presence of O2. Thus, several important mechanistic informations on this reaction have been obtained. An unfavourable chemical equilibrium between O2 and the FeII complex occurs that leads to the FeIII-peroxo complex upon reduction, similarly to heme enzymes such as P450. However, unlike in heme systems, further reduction of this latter intermediate does not result in O–O bond cleavage.
Introduction
Many oxygenases carry out important metabolic transformations by activation of dioxygen at a mononuclear Fe(II) center. This activation requires an electron transfer to an iron(II)-dioxygen adduct (or iron(III)-superoxo intermediate) thereby generating an iron(III) bound peroxide moiety. The necessary electrons are provided by a co-substrate such as (i) tetrahydropterin in aromatic aminoacid hydroxylases,1 (ii) 2-oxoglutarate in 2-oxoglutarate dependent dioxygenases2 and (iii) NAD(P)H for Rieske dioxygenase3,4 or cytochromes P450.5 Nature has designed sophisticated structures to spatially and timely orchestrate the flows of the oxidant, substrate and electrons (or co-substrates). In contrast, a major drawback preventing the development of efficient synthetic systems catalyzing oxygenation of substrates by O2 is the very competitive reduction of the iron oxidizing intermediates by the reducing agent. As a matter of fact, examples of synthetic coordination complexes, either heme6 or nonheme,7–9 able to catalyze the hydroxylation of robust C–H bonds by O2 in the presence of an electron source are rather rare, and the vast majority of systems mimicking oxygenases implement chemical oxidants (single oxygen atom donors or peroxides) instead. The reaction mechanism of O2 with iron(II)-porphyrins and the factors controlling its reversible binding or activation have been established for decades.10–15 Guided by these informations, efforts to develop porphyrinic catalysts using O2 is still a current research theme.16–21 Unlike iron(II) porphyrins, the reactivity of nonheme iron(II) complexes with molecular oxygen is a largely unfulfilled task, albeit, important breakthroughs have been made. Evidences have been recently provided that dioxygen reactivity of ferrous complexes can be modulated by the use of Lewis acids.22 Additionally, several reaction intermediates have been identified. It has indeed been shown that iron(III)-hydroperoxo23,24 and iron(IV)-oxo23,25 intermediates could be formed from a nonporphyrinic iron(II) precursor with O2, and chemical electron (BPh4−) and proton donors in stoichiometric amounts, suggesting that a mechanism similar to the one of P450 takes place. In other cases, iron(III)-hydroperoxo intermediates were observed following oxygenation of a ferrous precursor and H-atom abstraction from the ligand26 or a hydrocarbon substrate.27 Also remarkably, the same high valent iron(IV)-oxo ([(TMC)FeIV(O)]2+) could be formed by different procedures: (i) oxygenation of [(TMC)FeII]2+ in the presence of BPh4− and a Lewis acid instead of a proton,28 or (ii) in the presence of substrates acting as H-atom donors, indicating the involvement of a putative iron(III)-superoxo intermediate,29 or even (iii) in acetonitrile/ether or acetonitrile/alcohol mixtures without any other additive.30 Contrasting with these studies, more recent reports show that formation of reaction intermediates via autoxidation reactions should not be discarded.31–33 This diversity points towards a very rich and fascinating chemistry of nonheme iron(II) complexes with dioxygen that clearly deserves to be further investigated.To evidence if nonheme iron(II) complexes can activate O2, we report here an original mechanistic study of the reaction of [(TPEN)FeII]2+ with dioxygen carried out by cyclic voltammetry. Starting from this FeII precursor and chemical oxidants, it is possible to directly prepare in high yield iron(IV)-oxo and iron(III)-(hydro)peroxo intermediates (Scheme 1). These species have then been independently generated and characterized electrochemically, which is unprecedented for nonheme iron(III)-(hydro)peroxo. Changes in cyclic voltammograms (peak location, intensity and shape) upon various experimental conditions reflects the electrochemical and chemical events occurring at the electrode surface. Using the data obtained for the different intermediates as a guideline, simulations of these evolutions allow us to determine the reaction mechanism between FeII and O2 under reductive conditions. These results thus pave the way for the development of oxidation catalysts using the benign O2 instead of chemical oxidants.
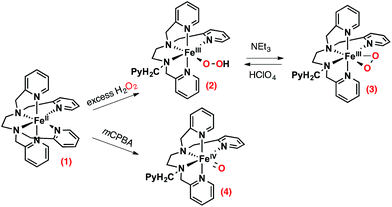 | ||
| Scheme 1 Intermediates that can be prepared from [(TPEN)FeII]2+ (1) in the presence of chemical oxidants. | ||
Results and discussion
1. Background
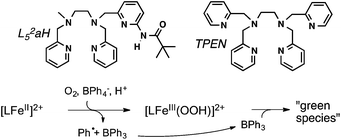
The choice of the iron(II) precursor was guided by the opportunity to obtain relevant iron intermediates almost quantitatively. Indeed, our initial exploration of the chemistry of [(TPEN)FeII]2+ (1) taught us that, upon reaction with hydrogen peroxide, it readily yields the low spin (S = 1/2) [(TPEN)FeIII(OOH)]2+ (2) that can be deprotonated to yield the high spin (S = 5/2) [(TPEN)FeIII(OO)]+ (3) as illustrated in Scheme 1.34 When treated with m-CPBA, the same precursor 1 leads to the low spin (S = 1) [(TPEN)FeIV(O)]2+ intermediate (4, Scheme 1).35 Furthermore, in agreement with its large positive E0(FeIII/FeII) = 0.74 V vs. SCE and large negative E0(FeII/FeI) = −1.70 V vs. SCE (see ESI, Fig. S1†) 1 is stable in oxygenated solutions.36 In contrast, in the presence of both an acid (such as HClO4) and the reducing agent BPh4−, precursor 1 reacts with O2 to give a high spin green intermediate characterized by a broad absorption in the visible (see ESI, Fig. S2†) and an EPR resonance at g = 4.3. These chemical reactivity and spectroscopic characteristics are similar to those previously observed with the precursor [(L52aH)FeII]2+ (Scheme 2) under the same conditions.24 For this latter complex, it was shown that [(L52aH)FeIII(OOH)]2+ is formed upon O2 reaction with FeII in presence of both BPh4− and HClO4. A green species,37 characterized by a broad absorption in the visible and an EPR resonance at g = 4.3, was further obtained following a secondary reaction between the iron-hydroperoxo and BPh3,24 the latter resulting from the one-electron oxidation of BPh4− (Scheme 2).38 By analogy, this strongly suggests that 2 can be generated by reaction of 1 with O2 in the presence of a proton donor and an electron source.39Based on these results, we reasoned that replacing the chemical reductant by an electrode may simplify the mechanistic scheme by minimizing uncontrolled secondary reactions. This electrochemical approach was explored with a cyclic voltammetry study of the reactivity of O2 with [(TPEN)FeII]2+ (1) in order to get details on the species generated at the electrode surface and on the mechanism.
The following part is dedicated to the electrochemical characterization of chemically prepared [(TPEN)FeIII(OOH)]2+ (2), [(TPEN)FeIII(OO)]+ (3) and [(TPEN)FeIV(O)]2+ (4) intermediates that serve as a rational framework to the subsequent study and analysis of reaction between dioxygen and [(TPEN)FeII)]2+ using cyclic voltammetry.
2. Electrochemical signatures of iron-oxo and iron-peroxo complexes
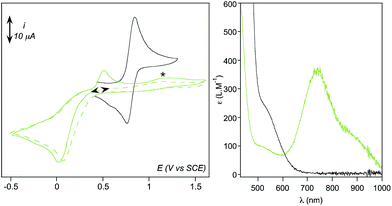
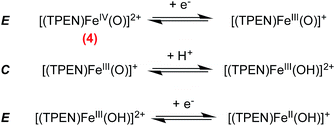
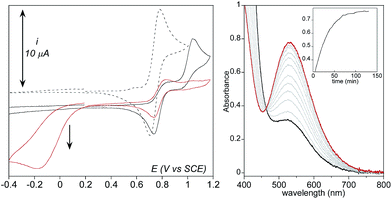
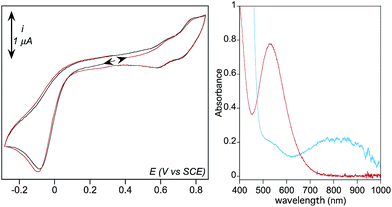
Formation of [(TPEN)FeIV(O)]2+ (4) from 1 at 0 °C in acetonitrile in the presence of TBAPF6 electrolyte was followed by cyclic voltammetry and UV-visible spectrophotometry (monitoring the characteristic band of 4 at 730 nm with an extinction coefficient of 380 M−1 cm−1).35 Upon addition of m-CPBA, precursor 1 is quantitatively converted into 4 as observed by UV-visible (see Fig. 1, right). At the same time, the reversible cyclic voltammogram (CV) of 1 at E0 = 0.74 V vs. SCE disappears to yield two features, one intense cathodic peak at 0.02 V and a weaker anodic one at 0.51 V (Fig. 1, left). The peak at 0.02 V is similar to the one reported for similar complexes.40–45 By analogy with the detailed electrochemical study of [(N4Py)FeIV(O)]2+,40 it is assigned to the two electrons reduction of 4. The first electron transfer yields the corresponding [(TPEN)FeIII(O)]+ followed by protonation from residual water (or generated m-chlorobenzoic acid) to give [(TPEN)FeIII(OH)]2+. This latter complex undergoes an immediate one electron reduction to give the [(TPEN)FeII(OH)]+ (ECE mechanism, see Scheme 3). On the reverse scan, oxidation of [(TPEN)FeII(OH)]+ is probed at Ep,a = 0.51 V.46–48 Furthermore, the anodic peak at 0.51 V is not observed unless the cathodic process at 0.02 V is first scanned (Fig. 1). The reduction wave of 4 was then satisfactorily simulated by taking into account such an ECE process (ESI, Fig. S8†).The conversion of precursor 1 into the iron-hydroperoxo complex 2 requires using a large excess of aqueous hydrogen peroxide.34 In the presence of 50 eq. H2O2 and 2 eq. HClO4vs. Fe at −40 °C in acetonitrile, a ca. 90% conversion is obtained in ca. 100 min (based on the HOO−-to-FeIII charge transfer band at 522 nm with an extinction coefficient of 900 M−1 cm−1, see Fig. 2, right panel). This conversion was also followed using cyclic voltammetry. After addition of acid only, a new anodic peak appears at Ep,a = 1.03 V vs. SCE. The wave associated to 1 (Ep,a = 0.79 V) is modified to a typical CE wave where a slow pre-equilibrium (C: protonation of a pyridine moiety in 1) precedes the electron transfer (E), then leading to a plateau shaped, low intensity oxidation.49 On the reverse scan, the one-electron reduction of [(TPEN)FeIII]3+ is detected at the same potential and with the same intensity as before addition of acid, indicating that the anodic signal at Ep,a = 1.03 V vs. SCE is due to the oxidation of the protonated equivalent of precursor 1, [(TPENH+)FeII(CH3CN)]3+.
As complex 2 accumulates in the reaction mixture upon H2O2 addition, these anodic peaks decrease in intensity. The oxidation signal of [(TPENH+)FeII(CH3CN)]3+ disappears and only a small remaining fraction of 1 is observed. A new cathodic signal in the negative range at −0.16 V vs. SCE increases in intensity at the same time. This signal is completely irreversible and reaches a maximum intensity matching the initial intensity of 1. Therefore, this cathodic wave is attributed to the one electron reduction of 2.
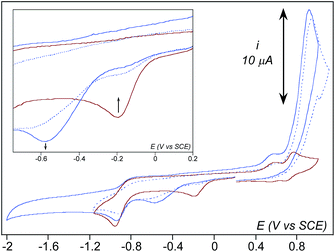
In order to confirm this assignment, 2 was isolated as its PF6− salt at −80 °C from a freshly prepared methanol solution and redissolved in the minimum amount of butyronitrile at −90 °C, using the procedure reported for a related complex.50,51 EPR spectrum of this so-called “stock” solution is similar to the one of 2 generated with an excess of H2O2 in acetonitrile solution (ESI, Fig. S3†). This “stock” solution was diluted in the electrolytic solution at −45 °C for electrochemical analysis and simultaneous spectrophotometric monitoring. Corroborating the previous observations, the CVs exhibit a cathodic wave at a close potential value Ep,c = −0.08 V, (Fig. 3).52 In addition, two weaker quasi reversible signals are observed at E0 = 0.74 V and E0 = 0.62 V vs. SCE regardless of the initial direction of the scan. These features are due to precursor 1 and its aqua form [(TPEN)FeII(OH2)]2+, respectively. Indeed, control experiments showed that addition of water to precursor 1 results in the increase of a wave at 0.62 V (ESI, Fig. S4†).53 No other peak can be observed on the positive range, thus indicating that the oxidation of intermediate 2 is not detected in these experiments.
The reduction wave of 2 is satisfactorily simulated by taking into account a one-electron process yielding a putative FeII(OOH), which has recently been proposed as an intermediate in electrochemical dioxygen reduction catalyzed by a heme model (ESI, Fig. S9†).54 In addition, simulation does not support an O–O cleavage. Indeed, such an O–O cleavage upon reduction of 2 would lead to [(TPEN)FeIV(O)]2+ (4) and OH−. In turn, 4 would be reduced (ca. 0 V vs. SCE) through a 2 electrons process (see previous section), thus leading to an overall 3 electrons process. Simulation of CV of 2 does not support such a mechanism. Accordingly, the anodic peak at 0.51 V associated with the oxidation process of [(TPEN)FeII(OH)]+ (resulting from reduction of 4) is not observed at positive values on the reverse scan, thus supporting the fact that reduction of 2 does not lead to O–O bond cleavage. This persistence of the O–O bond is quite common in non heme chemistry where low spin FeIII(OOH) in activated bleomycin55 and synthetic models56 are found to perform direct H-atom abstraction from organic substrates. Situation is different in heme chemistry where the low spin FeIII(OOH) Compound 0 is not competent for substrate oxidation and readily cleaves to yield the active iron(IV)-oxo heme cation radical Compound I.5 Along this line, the formation of FeIV(O) upon reduction of synthetic iron porphyrins FeIII(OOH) has been recently observed.18,19
Upon addition of NEt3 (5 eq. vs. Fe) to the previous sample at −45 °C, the 522 nm band associated to 2 vanishes while a weaker one centered at 800 nm develops (Fig. 3, right). This new band also vanishes rapidly with a half lifetime estimated to less than 3–4 minutes under these conditions. X-band EPR of this new species exhibits the characteristic resonances of the high spin FeIII-η2(OO) complex 3 at g = 8.03 and 5.60 (ESI, Fig. S5†) confirming its formation upon deprotonation of 2.57 At the same time, monitoring the reaction mixture by CV reveals the disappearance of the cathodic peak attributed to 2 and the concomitant development of a new one at −0.58 V (Fig. 4). This signal then decreases, mirroring the 800 nm absorption band extinction. Thus, the cathodic peak at −0.58 V is attributed to the reduction process of 3. In comparison with the dicationic [(TPEN)FeIII(OOH)]2+2, the potential shift to more negative values is consistent with the reduction of the monocationic [(TPEN)FeIII(OO)]+3.58
All the peak potential values obtained for complexes 1–4 are listed in Table 1.
| 1 (FeIII/FeII) | 2 | 3 | 4 | O2/O2˙− | |
|---|---|---|---|---|---|
| a Values in V vs. SCE. b Value at the anodic peak. c Value at the cathodic peak. d Values determined at 0 °C. e Values determined at 20 °C. f Average values at −45 °C (potential values slightly varied depending on the experimental conditions). | |||||
| E p,a | 0.78d; 0.85e | −0.83e | |||
| E p,c | 0.70d; 0.77e | −0.12f | −0.58f | 0.02d | −0.97e |
3. Dioxygen activation by complex 1 studied by cyclic voltammetry
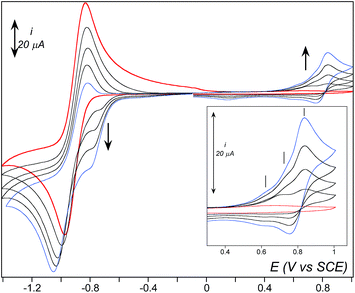
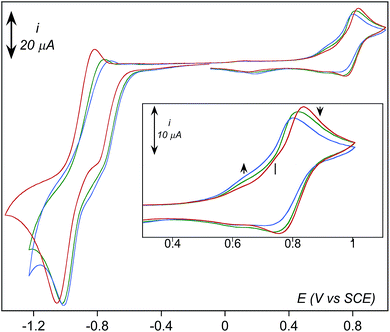
In dry acetonitrile (see ESI for experimental conditions), the presence of [(TPEN)FeII]2+1 modifies the O2/O2˙− wave (see Fig. 5). Firstly, a new plateau shaped wave appears at the foot of the O2/O2˙− wave at ca. −0.80 V vs. SCE; secondly, the intensity of this new wave increases as the concentration in 1 increases; and thirdly, the reversibility of the O2/O2˙− wave concomitantly diminishes. According to these observations we tentatively attribute the current intensity at −0.80 V vs. SCE to the reduction of the dioxygen adduct 1–O2 formed after coordination of O2 to the FeII center in 1. Consistently, this cathodic process occurs at a less negative potential than the direct reduction of O2. In addition, the persistence of the reduction wave of molecular oxygen indicates that the equilibrium constant for the formation of 1–O2 is small. Besides, the irreversibility of the O2/O2˙− wave suggests that the superoxide generated at the electrode reacts with 1 as well. It has to be emphasized here that we formulate the species resulting from coordination of O2 to FeII center in 1 as a FeII–O2 adduct (1–O2) rather than as an FeIII-superoxo moiety for the following reasons. If an FeIII-superoxo was formed, it would be expected to readily achieve H-abstraction in the medium.59 In contrast, 1 remains inert in the presence of O2 only. As previously observed with BPh4−, its reaction with dioxygen is triggered by the presence of reducing equivalents. The system can thus be described according to a square scheme (upper left square on Scheme 4) where reduction of 1–O2 or reaction between O2˙− and 1 yields the FeII-superoxide moiety 1–O2•−. This latter being unobserved on the reverse scan (i.e. the electrochemical process involving 1–O2 is not reversible) we assume that it readily transforms into its valence tautomer FeIII-peroxo 3.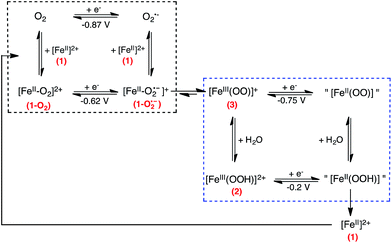 | ||
| Scheme 4 Proposed reduction mechanism considered to model the experimental CVs for the reaction between O2 and complex 1. The ligand has been omitted for clarity. | ||
In Rieske dioxygenase, reductive activation of O2 at the FeII site leads to the FeIII-peroxo (or FeIII-hydroperoxo) active species. The required electron is delivered by a [2Fe–2S] cluster at redox potentials reported in the range between −0.394 and −0.356 V vs. SCE in naphthalene, benzene and phthalate dioxygenase enzymes.60 This indicates that reduction of dioxygen at an FeII center surrounded by the naturally occurring 2-His 1-carboxylate facial triad is much easier than when O2 binds FeII in saturated octahedral environment such in complex 1. Thus, formation of iron-oxidizing species in Rieske dioxygenases are thermodynamically favoured over synthetic systems, which may indirectly reflect a higher reactivity towards substrates.
According to scheme 4, the iron-peroxo complex 3 can be generated through the reduction of the 1–O2 complex (CE pathway) or through the reaction of superoxide with the reduced form of complex 1 (EC pathway). This reactivity is very different from a non porphyrinic manganese complex for which a manganese(III)-peroxo intermediate was generated through a single EC pathway only.61 As frequently shown for non heme iron(III)-hydroperoxo and iron(III)-peroxo intermediates, 3 and 2 are the two forms of an acid/base couple.62–66 Therefore, 3 can be protonated by residual water to yield 2. From studies reported above on the chemically generated intermediates (see Table 1), it can be said that 2 and 3 are reduced at less negative potentials than O2 and their reduction thus contribute to the current intensity when scanning towards negative potentials. CV of 2 was simulated according to a one electron reduction process (ESI, Fig. S9†), we hypothesize that 3 is reduced similarly.
In order to take into account the above mentioned observations, a second square scheme is added to the mechanism (lower square on Scheme 4). The complete {1 + O2 + e−} system can thus be described as a two square scheme. The first one leads to the formation of [(TPEN)FeIII(OO)]+3. The second one involves the acid/base equilibrium between this latter intermediate and 2 and the one electron reduction of these species. The putative [(TPEN)FeII(OOH)]+ and [(TPEN)FeII(OO)] resulting from the reduction of 2 and 3 respectively have not been identified. Simulations of the experimental CVs (see below and ESI†) indicate that regeneration of the ferrous precursor 1 has to be taken into account. Therefore, we propose that the fate of these species is to yield back 1.
Except for O2/O2˙− for which the potential corresponds to the experimental E0 value of the couple, the potentials given in the scheme are the E0 values that were used in the simulation. Formulation of the quoted species is speculative.
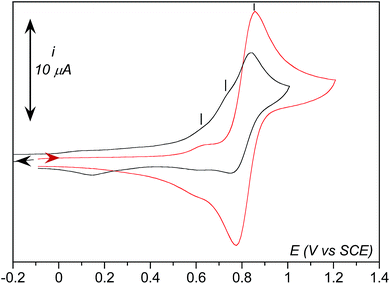
As observed in Fig. 5, three anodic signals are detected on the reverse scan at positive potential: the reversible systems related to 1 at E0 = 0.81 V vs. SCE, its aqua form [(TPEN)FeIII/II(OH2)]3+/2+ at E0 = 0.62 V, and one irreversible anodic peak at Ep,a = 0.74 V. Interestingly, this irreversible peak cannot be observed unless the solution is first scanned towards negative potentials below the reduction wave of O2 (Fig. 6) nor under anaerobic conditions. In addition, intensity of the oxidation peak of 1 is weaker than that of the same solution directly probed towards anodic potentials. This leads to the conclusion that the oxidation observed at 0.74 V is related to an iron complex whose formation is initiated at negative potential in the presence of O2. A plausible proposition is that the species probed at 0.74 V vs. SCE is the peroxo intermediate 3.67 Indeed, the anodic part of the experimental CVs is best simulated with the introduction of the oxidation of 3 (see ESI, Fig. S10†). Whether this oxidation leads to a putative FeIV-peroxo or a FeIII-superoxo species is uncertain and falls outside the scope of the present work.
All the above mentioned reactions are given in Scheme 5.
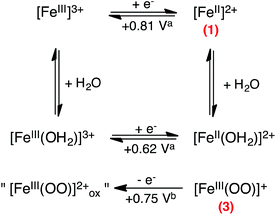 | ||
| Scheme 5 Proposed oxidation mechanism considered to model the experimental CVs of the reaction between O2 and complex 1 upon scanning towards positive potentials after reduction. (a) Standard potential values of [(TPEN)FeIII/II]3+/2+ and [(TPEN)FeIII/II(OH2)]3+/2+ couples obtained from simulation of the one electron oxidation wave of 1 in solution in absence and upon addition of water (see Fig. S12†); (b) standard potential value used for the simulation. | ||
Effect of water addition strengthens this proposition (Fig. 7). The signal at 0.74 V that was easily detectable under dry conditions vanishes in the presence of water. This observation is consistent with its assignment as the oxidation of 3 since this latter is transformed into 2 upon protonation. Concomitantly, intensity of the oxidation peak of 1 (E0 = 0.81 V) decreases with increasing amounts of water while intensity of the oxidation peak of the aqua complex [(TPEN)FeII(OH2)]2+ increases.
Going back to the cathodic processes, several modifications are observed on the CV traces upon addition of water. The reduction of the dioxygen adduct 1–O2 proceeds more easily as the shoulder is observed at a less negative potential and with a larger intensity (Fig. 7). This observation is consistent with the reactions given in Scheme 4, as the presence of water drives the protonation of intermediate 3 into 2 which is reduced at less negative potential. The presence of water also favours regeneration of complex 1, thus initiating again the overall chemical and electrochemical processes and leading to a more intense feature.
4. Simulation of the cyclic voltammograms
To validate this mechanism, simulation of a series of CVs were performed. Standard potentials E0 and electron transfer rates ks values for O2/O2˙−, [(TPEN)FeIII/II]3+/2+ and [(TPEN)FeIII/II(OH2)]3+/2+ couples were obtained independently from simulation of the experimental CV traces of O2 in dry CH3CN and of 1 in dry CH3CN solution and upon addition of water (see ESI, Fig. S6, S7, S11 and S12†).The plateau-shaped wave at ca. −0.8 V vs. SCE is only reproduced when taking into account the reduction of the 1–O2 adduct (CE Chemical-Electrochemical path, Scheme 4). As well, the irreversibility of the O2/O2˙− wave is only reproduced when the reaction of O2˙− and 1 is introduced (EC Electrochemical-Chemical path). Thus both CE and EC paths need to be taken into account for the simulation of the experimental CV. Additionally, the current intensities in both the positive and negative potential range are best reproduced when considering processes consuming 3 and regenerating 1. The signals in the negative range are correctly reproduced taking into account the mechanism given in Scheme 4. The anodic features in the positive range are best modelled provided the oxidation of both 3 and 1 are considered. Full details regarding the simulations are given in ESI.†
The simulated CV are shown in Fig. 8, together with the experimental ones. All of the characteristic features discussed above are reproduced, validating the mechanism given in Schemes 4 and 5.
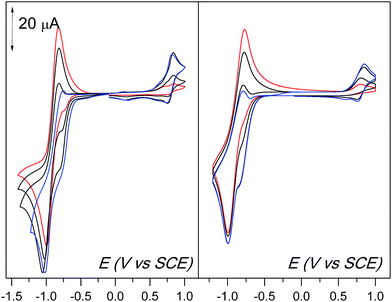 | ||
| Fig. 8 Cyclic voltammetric experiments (CVs) of 1.62 mM O2 in the presence of increasing equivalents of 1 (0.25, 0.5, 0.75, 1 eq. vs. O2, from red to blue line) at room temperature and a scan rate of 0.1 V s−1 (Left). Simulations of the CVs based on reactions shown in Schemes 4 and 5 (Right). Details for the simulations are given in ESI.† | ||
Conclusions
The nonheme iron complex [(TPEN)FeII]2+ can be used as precursor to generate iron(III)-hydroperoxo, iron(III)-peroxo and iron(IV)-oxo intermediates in high yield. Cyclic voltammetry performed on these intermediates have been used as a guideline to analyze the cyclic voltammograms of oxygenated solutions of [(TPEN)FeII]2+. This original approach leads us to propose a mechanism for dioxygen activation by the ferrous complex under reductive conditions. Our results demonstrate that the reaction starts with the formation of an FeII–O2 complex, which is an extremely rare moiety in nonheme chemistry. This intermediate further yields an FeIII-peroxo intermediate upon reduction at the electrode surface, which is reminiscent of the P450 catalytic cycle. However, unlike porphyrinic systems, no evidence for O–O bond cleavage upon reduction of the FeIII-peroxo to give a high valent FeIV(O) complex were grasped from the CVs.The FeIII-peroxo complex exhibits a reduction potential at more positive potentials than that of the FeII–O2 intermediate. It is thus easily reduced as soon as it is formed.
The use of related systems in oxidation catalysis by dioxygen necessitates the formation of the FeIII-peroxo complex under conditions where it is not immediately reduced. This may be achieved with precursor capable of forming FeII–O2 intermediates exhibiting less negative reduction potential than that of the FeIII-peroxo. In that sense, addition of protons (from water), that facilitates the reduction potential of the FeII–O2 complex, or the use of redox inactive Lewis acids, may be a strategy to explore.
Another alternative would be to slow down the FeIII-peroxo reduction so as it becomes rate limiting with respect to oxygen atom transfer from an FeIII-(hydro)peroxo to a substrate. Such a task may be achieved by using soluble redox mediators68 or by tethering the complexes to the electrode surface via convenient linkers, so as to lower the electron transfer rate.69
Finally, it has to be noted that the strategy presented in this study is also suitable to other nonheme iron(II) complexes displaying a reactivity with dioxygen different than that of [(TPEN)FeII]2+.
Abbreviations
| TPEN | N,N,N′,N′-Tetrakis(2-pyridylmethyl)ethane-1,2-diamine |
| L52aH | 2,2-Dimethyl-N-[6-({[2-(methylpyridin-2-ylmethylamino)ethyl]pyridin-2-ylmethyl-amino}methyl)pyridin-2-yl]propionamide |
| N4Py | N,N-Bis(2-pyridylmethyl)bis(2-pyridyl)methylamine; mCPBA, m-chloroperbenzoic acid |
| TBAPF6 | Tetrabutylammonium hexafluorophosphate |
| SCE | Saturated calomel electrode |
Acknowledgements
This work was supported by the ANR (project ANR Blanc Cathymetoxy), the Labex CHARMMMAT and the EU-COST Network for Bioinorganic Reaction Mechanisms (CM1003). Dr Benoit Limoges is acknowledged for fruitful discussions. EPR measurements have been performed with the help of Laurianne Billon.Notes and references
- P. F. Fitzpatrick, Biochemistry, 2003, 42, 14083–14091 CrossRef CAS PubMed
.
- J. M. Bollinger Jr, J. C. Price, L. M. Hoffart, E. W. Barr and C. Krebs, Eur. J. Inorg. Chem., 2005, 4245–4254 CrossRef
.
- S. Chakrabarty, R. N. Austin, D. Y. Deng, J. T. Groves and J. D. Lipscomb, J. Am. Chem. Soc., 2007, 129, 3514–3515 CrossRef CAS PubMed
.
- D. T. Gibson and R. E. Parales, Curr. Opin. Biotechnol., 2000, 11, 236–243 CrossRef CAS
.
- B. Meunier, S. P. de Visser and S. Shaik, Chem. Rev., 2004, 104, 3947–3980 CrossRef CAS PubMed
.
- D. Mansuy, C. R. Chim., 2007, 10, 392–413 CrossRef CAS PubMed
.
- D. T. Sawyer, X. Liu, C. Redman and B. Chong, Bioorg. Med. Chem., 1994, 2, 1385–1395 CrossRef CAS
.
- H. Jaafar, B. Vileno, A. Thibon and D. Mandon, Dalton Trans., 2011, 40, 92–106 RSC
.
- D. Mandon, H. Jaafar and A. Thibon, New J. Chem., 2011, 35, 1986–2000 RSC
.
- D.-H. Chin, A. L. Balch and G. N. La Mar, J. Am. Chem. Soc., 1980, 102, 1446–1448 CrossRef CAS
.
- D.-H. Chin, J. Del Gaudio, G. N. La Mar and A. L. Balch, J. Am. Chem. Soc., 1977, 99, 5486–5488 CrossRef CAS
.
- D.-H. Chin, G. N. La Mar and A. L. Balch, J. Am. Chem. Soc., 1980, 102, 5945–5947 CrossRef CAS
.
- J. P. Collman, J. I. Brauman, B. L. Iverson, J. L. Sessler, R. M. Morris and Q. H. Gibson, J. Am. Chem. Soc., 1983, 105, 3052–3064 CrossRef CAS
.
- J. P. Collman, R. R. Gagne, C. A. Reed, W. T. Robinson and G. A. Rodley, Proc. Natl. Acad. Sci. U. S. A., 1974, 71, 1326–1329 CrossRef CAS
.
- R. A. Ghiladi, R. M. Kretzer, I. Guzei, A. L. Rheingold, Y. M. Neuhold, K. R. Hatwell, A. D. Zuberbuhler and K. D. Karlin, Inorg. Chem., 2001, 40, 5754–5767 CrossRef CAS PubMed
.
- J.-G. Liu, T. Ohta, S. Yamaguchi, T. Ogura, S. Sakamoto, Y. Maeda and Y. Naruta, Angew. Chem., Int. Ed., 2009, 48, 9262–9267 CrossRef CAS PubMed
.
- J.-G. Liu, Y. Shimizu, T. Ohta and Y. Naruta, J. Am. Chem. Soc., 2010, 132, 3672–3673 CrossRef CAS PubMed
.
- K. Sengupta, S. Chatterjee, S. Samanta, S. Bandyopadhyay and A. Dey, Inorg. Chem., 2013, 52, 2000–2014 CrossRef CAS PubMed
.
- K. Sengupta, S. Chatterjee, S. Samanta and A. Dey, Proc. Natl. Acad. Sci. U. S. A., 2013, 110, 8431–8436 CrossRef CAS PubMed
.
- S. Chatterjee, K. Sengupta, S. Samanta, P. K. Das and A. Dey, Inorg. Chem., 2013, 52, 9897–9907 CrossRef CAS PubMed
.
- S. Samanta, P. K. Das, S. Chatterjee, K. Sengupta, B. Mondal and A. Dey, Inorg. Chem., 2013, 52, 12963–12971 CrossRef CAS PubMed
.
- Y. J. Park, S. A. Cook, N. S. Sickerman, Y. Sano, J. W. Ziller and A. S. Borovik, Chem. Sci., 2013, 4, 717–726 RSC
.
- S. Hong, Y.-M. Lee, W. Shin, S. Fukuzumi and W. Nam, J. Am. Chem. Soc., 2009, 131, 13910–13911 CrossRef CAS PubMed
.
- M. Martinho, G. Blain and F. Banse, Dalton Trans., 2010, 39, 1630–1634 RSC
.
- A. Thibon, J. England, M. Martinho, V. G. Young, J. R. Frisch, R. Guillot, J. J. Girerd, E. Munck, L. Que, Jr and F. Banse, Angew. Chem., Int. Ed., 2008, 47, 7064–7067 CrossRef CAS PubMed
.
- Y. Jiang, J. Telser and D. P. Goldberg, Chem. Commun., 2009, 6828–6830 RSC
.
- Y. He and C. R. Goldsmith, Chem. Commun., 2012, 48, 10532–10534 RSC
.
- F. Li, K. M. Van Heuvelen, K. K. Meier, E. Münck and L. Que Jr, J. Am. Chem. Soc., 2013, 135, 10198–10201 CrossRef CAS PubMed
.
- Y. M. Lee, S. Hong, Y. Morimoto, W. Shin, S. Fukuzumi and W. Nam, J. Am. Chem. Soc., 2010, 132, 10668–10670 CrossRef CAS PubMed
.
- S. O. Kim, C. V. Sastri, M. S. Seo, J. Kim and W. Nam, J. Am. Chem. Soc., 2005, 127, 4178–4179 CrossRef CAS PubMed
.
- P. Comba, Y.-M. Lee, W. Nam and A. Waleska, Chem. Commun., 2014, 50, 412–414 RSC
.
- Y. Morimoto, Y. M. Lee, W. Nam and S. Fukuzumi, Chem. Commun., 2013, 49, 2500–2502 RSC
.
- Y. Nishida, Y.-M. Lee, W. Nam and S. Fukuzumi, J. Am. Chem. Soc., 2014, 136, 8042–8049 CrossRef CAS PubMed
.
- A. J. Simaan, S. Döpner, F. Banse, S. Bourcier, G. Bouchoux, A. Boussac, P. Hildebrandt and J.-J. Girerd, Eur. J. Inorg. Chem., 2000, 1627–1633 CrossRef CAS
.
- M. Martinho, F. Banse, J.-F. Bartoli, T. A. Mattioli, P. Battioni, O. Horner, S. Bourcier and J.-J. Girerd, Inorg. Chem., 2005, 44, 9592–9596 CrossRef CAS PubMed
.
- Y. M. Badiei, M. A. Siegler and D. P. Goldberg, J. Am. Chem. Soc., 2011, 133, 1274–1277 CrossRef CAS PubMed
.
- Despite several attempts using different techniques (ESI-MS, resonance Raman, 11B NMR), the nature of the green species has not yet been established neither for L52aH nor for TPEN.
- P. K. Pal, S. Chowdhury, M. G. B. Drew and D. Datta, New J. Chem., 2002, 26, 367–371 RSC
.
- In contrast to [(L52aH)FeIII(OOH)]2+ we were unable to trap 2 in this way, most probably because of a higher reactivity of the latter, as suggested by Fig. S2.†.
- D. Wang, M. Zhang, P. Buhlmann and L. Que Jr, J. Am. Chem. Soc., 2010, 132, 7638–7644 CrossRef CAS PubMed
.
- C. V. Sastri, K. Oh, Y. J. Lee, M. S. Seo, W. Shin and W. Nam, Angew. Chem., Int. Ed., 2006, 45, 3992–3995 CrossRef CAS PubMed
.
- D. Wang, K. Ray, M. J. Collins, E. R. Farquhar, J. R. Frisch, L. Gomez, T. A. Jackson, M. Kerscher, A. Waleska, P. Comba, M. Costas and L. Que Jr, Chem. Sci., 2013, 4, 282–291 RSC
.
- S. Fukuzumi, Coord. Chem. Rev., 2013, 257, 1564–1575 CrossRef CAS PubMed
.
- Y. M. Lee, H. Kotani, T. Suenobu, W. Nam and S. Fukuzumi, J. Am. Chem. Soc., 2008, 130, 434–435 CrossRef CAS PubMed
.
- W. Nam, Y. M. Lee and S. Fukuzumi, Acc. Chem. Res., 2014, 47, 1146–1154 CrossRef CAS PubMed
.
- According to the potential value and by comparison with other reported complexes (see ref. 47 and 48), we propose that the anodic process probed at this 0.51 V corresponds to the oxidation of the monocationic [(TPEN)FeII(OH)]+ complex.
- N. Ségaud, J.-N. Rebilly, K. Sénéchal-David, R. Guillot, L. Billon, J.-P. Baltaze, J. Farjon, O. Reinaud and F. Banse, Inorg. Chem., 2013, 52, 691–700 CrossRef PubMed
.
- P. Comba, H. Wadepohl and A. Waleska, Aust. J. Chem., 2014, 67, 398–404 CrossRef CAS
.
-
J.-M. Savéant, Elements of Molecular and Biomolecular Electrochemistry, Wiley-Interscience, New-York, 2006 Search PubMed
.
- M. Martinho, P. Dorlet, E. Rivière, A. Thibon, C. Ribal, F. Banse and J.-J. Girerd, Chem.–Eur. J., 2008, 14, 3182–3188 CrossRef CAS PubMed
.
- A. Thibon, V. Jollet, C. Ribal, K. Sénéchal-David, L. Billon, A. B. Sorokin and F. Banse, Chem.–Eur. J., 2012, 18, 2715–2724 CrossRef CAS PubMed
.
- Differences between the two peak potential values can be due to different experimental conditions. Moreover, the value slightly varied from an experience to another.
- The presence of these complexes may probably result from an incomplete conversion into 2 or a partial degradation during preparation of this unstable sample.
- K. Mittra, S. Chatterjee, S. Samanta and A. Dey, Inorg. Chem., 2013, 52, 14317–14325 CrossRef CAS PubMed
.
- A. Decker, M. S. Chow, J. N. Kemsley, N. Lehnert and E. I. Solomon, J. Am. Chem. Soc., 2006, 128, 4719–4733 CrossRef CAS PubMed
.
- L. V. Liu, S. Hong, J. Cho, W. Nam and E. I. Solomon, J. Am. Chem. Soc., 2013, 135, 3286–3299 CrossRef CAS PubMed
.
- Despite a shift of the absorption band of 3 to lower energy in acetonitrile compared to methanol, its EPR characteristics are identical in both solvent (see ref. 34). In addition, basic properties of 3 are similar in both solvents since it yields back intermediate 2 upon treatment with perchloric acid.
- Due to the instability of 3, the experimental CV recorded on this solution were not of sufficient quality to allow satisfactory simulation.
- To our knowledge, only one nonheme iron(III)-superoxo has ever been observed at −80 °C : X. P. Shan and L. Que Jr, Proc. Natl. Acad. Sci. U. S. A., 2005, 102, 5340–5345 CrossRef CAS PubMed
. No electrochemical data was reported.
- B. Kauppi, K. Lee, E. Carredano, R. E. Parales, D. T. Gibson, H. Eklund and S. Ramaswamy, Structure, 1998, 6, 571–586 CrossRef CAS
.
- H. Y. V. Ching, E. Anxolabéhère-Mallart, H. E. Colmer, C. Costentin, P. Dorlet, T. A. Jackson, C. Policar and M. Robert, Chem. Sci., 2014, 5, 2304–2310 RSC
.
- J. J. Girerd, F. Banse and A. J. Simaan, Struct. Bonding, 2000, 97, 145–177 CrossRef CAS
.
- R. Y. N. Ho, G. Roelfes, R. Hermant, R. Hage, B. L. Feringa and L. Que, Jr, Chem. Commun., 1999, 2161–2162 RSC
.
- K. B. Jensen, C. J. McKenzie, L. P. Nielsen, J. Z. Pedersen and H. M. Svendsen, Chem. Commun., 1999, 1313–1314 RSC
.
- M. R. Bukowski, P. Comba, C. Limberg, M. Merz, L. Que Jr and T. Wistuba, Angew. Chem., Int. Ed., 2004, 43, 1283–1287 CrossRef CAS PubMed
.
- A. Thibon, J.-F. Bartoli, S. Bourcier and F. Banse, Dalton Trans., 2009, 9587–9594 RSC
.
- Direct electrochemical oxidation of intermediate 3 has been unsuccessful for the moment. Indeed, since it was necessary to use an excess of NEt3, an intense peak at 0.90 V was observed, preventing CV characterization of 3. Other attempts with sodium methoxide or sodium hydroxide were unsuccesful due to low solubility at that low temperature.
- V. Balland, C. Hureau, A. M. Cusano, Y. Liu, T. Tron and B. Limoges, Chem.–Eur. J., 2008, 14, 7186–7192 CAS
.
- J. P. Collman, A. Dey, Y. Yang, S. Ghosh and R. A. Decreau, Proc. Natl. Acad. Sci. U. S. A., 2009, 106, 10528–10533 CrossRef CAS PubMed
.
Footnotes |
| † Electronic supplementary information (ESI) available: Detailed experimental procedures; UV-visible, EPR and electrochemical characterizations of intermediates 2, 3 and 4, generated with chemical oxidants. Detailed methodology for the simulation of the CVs of intermediates 2–4, and for the reaction between 1 and O2. See DOI: 10.1039/c4sc01891e |
| ‡ Present address: Dpto. Ciencia de los Mat, Ing. Met y Química Inorgánica; Facultad de Ciencias; Universidad de Cádiz; Campus Universitario Río San Pedro s/n; 11510 Puerto Real, Cádiz, Spain. |
| This journal is © The Royal Society of Chemistry 2015 |

