 Open Access Article
Creative Commons Attribution 3.0 Unported Licence
High throughput imaging cytometer with acoustic focussing†
Robert Zmijana,
Umesh S. Jonnalagaddaa,
Dario Carugoa,
Yu Kochid,
Elizabeth Lemmbc,
Graham Packhambc,
Martyn Hilla and
Peter Glynne-Jones*a
aEngineering Sciences, Faculty of Engineering and the Environment, University of Southampton, Southampton, SO17 1BJ, UK. E-mail: P.Glynne-Jones@soton.ac.uk
bCancer Sciences Division, Faculty of Medicine, University of Southampton, Southampton General Hospital, UK
cExperimental Cancer Medicine Centre, Southampton General Hospital, UK
dJapan Patent Office, 3-chome-4-3 Kasumigaseki, Chiyoda-ku Tokyo 100-8915, Japan
First published on 24th September 2015
Abstract
We demonstrate an imaging flow cytometer that uses acoustic levitation to assemble cells and other particles into a sheet structure. This technique enables a high resolution, low noise CMOS camera to capture images of thousands of cells with each frame. While ultrasonic focussing has previously been demonstrated for 1D cytometry systems, extending the technology to a planar, much higher throughput format and integrating imaging is non-trivial, and represents a significant jump forward in capability, leading to diagnostic possibilities not achievable with current systems. A galvo mirror is used to track the images of the moving cells permitting exposure times of 10 ms at frame rates of 50 fps with motion blur of only a few pixels. At 80 fps, we demonstrate a throughput of 208![[thin space (1/6-em)]](https://www.rsc.org/images/entities/char_2009.gif) 000 beads per second. We investigate the factors affecting motion blur and throughput, and demonstrate the system with fluorescent beads, leukaemia cells and a chondrocyte cell line. Cells require more time to reach the acoustic focus than beads, resulting in lower throughputs; however a longer device would remove this constraint.
000 beads per second. We investigate the factors affecting motion blur and throughput, and demonstrate the system with fluorescent beads, leukaemia cells and a chondrocyte cell line. Cells require more time to reach the acoustic focus than beads, resulting in lower throughputs; however a longer device would remove this constraint.
Introduction
The characterisation of fluorescent objects in flow cytometry usually requires high sensitivity sensors, for example photomultipliers, due to the short exposure time of the sample to a photosensitive element. In general, image flow cytometry has the potential to offer better specificity than conventional flow cytometry, but is more challenging to implement. Higher throughput and higher sensitivity flow cytometers would be particularly useful in detecting and identifying circulating tumour cells (CTCs)1–7 in blood samples. High throughput is usually achieved by increasing flow speeds, such that particle velocities often exceed 1 m s−1 and therefore require microsecond, and sub-microsecond exposure times.8 Imaging in this mode poses a serious challenge to currently available cameras in terms of signal-to-noise ratio and motion blur, and is extremely difficult if high resolution is required. Combining microscopy with flow cytometry was proposed over three decades ago9 but only recently have high sensitivity, high resolution CMOS, and TDI (Time Delay and Integration) CCD technologies met the demands of capturing detailed microscopic images in motion at low light levels. Further advances in microprocessor technology, and decreasing prices of computing power and storage now allow for real or near-real time image recording and processing. Existing commercialised systems using a flow cell and TDI CCD camera are typically limited to throughputs of around 5000 cells per second.10 Recently, a different approach using a similar TDI instrument was demonstrated for CTC detection in blood, by observing a moving tray containing a single layer of blood cells.11 Some imaging systems trade high particle velocity for screening multiple particles at a time.12–15 Schonbrun et al. demonstrated a system imaging 16 microfluidic channels simultaneously, achieving throughput over 20![[thin space (1/6-em)]](https://www.rsc.org/images/entities/char_2009.gif) 000 particles per second at an average particle velocity of 55 mm s−1.16 Olson and Sosik, using a submersible flow cytometer17 reported phytoplankton imaging at 2.2 m s−1 particle velocity, however, throughput was limited by single file particle focussing, and was in order of several thousand cells per s. Furthermore, recent use of deconvolution has re-defined current resolution limits, allowing 3D cell image reconstruction,18 and revealing an unprecedented amount of morphological detail in cells imaged in 2D at flow velocities of several hundred mm s−1.19,20
000 particles per second at an average particle velocity of 55 mm s−1.16 Olson and Sosik, using a submersible flow cytometer17 reported phytoplankton imaging at 2.2 m s−1 particle velocity, however, throughput was limited by single file particle focussing, and was in order of several thousand cells per s. Furthermore, recent use of deconvolution has re-defined current resolution limits, allowing 3D cell image reconstruction,18 and revealing an unprecedented amount of morphological detail in cells imaged in 2D at flow velocities of several hundred mm s−1.19,20
Performance of a cytometer device depends on the quality of the particle focussing mechanism, with single file coaxial hydrodynamic focussing still being the most widely used approach. The successful use of ultrasonic forces in microfluidic devices has been reported for more than a decade. Ultrasonic methods for manipulating,21–25 trapping,26,27 separating,28,29 and focussing30–32 particles have been established, and the radiation forces employed are effective on mammalian cells,33 bacteria,34 liquid droplets35 and bubbles.36 Acoustic focussing has consequently attracted interest for cytometry applications37 using a variety of approaches including cylindrical8,30 and rectangular38 capillaries, surface acoustic wave devices,39 a planar system that allows multiple focussed streams to be interrogated,40 and for orienting red blood cells in cytometry.41 Acoustic streamline particle focussing has already been employed in commercial cytometer devices such as the Attune NxT.42 The use of other focussing technologies for focusing particles has also been demonstrated, including inertial,43,44 and dielectrophoretic45 ones. For a comprehensive review of particle focusing technologies in microfluidic devices see Xuan et al.46 In the work described in this paper, we exploit ultrasonic standing waves to focus flowing particles into the image plane of a high resolution camera and image them using an electronically controlled galvo mirror to track the particles, thus extending exposure time and avoiding motion blur.
System concept
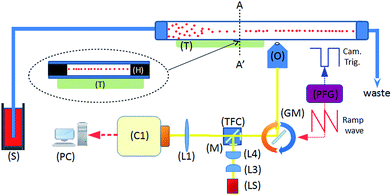
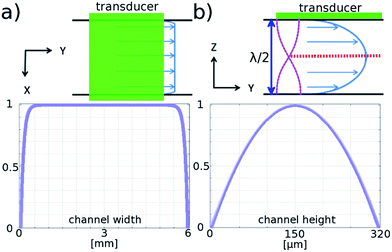
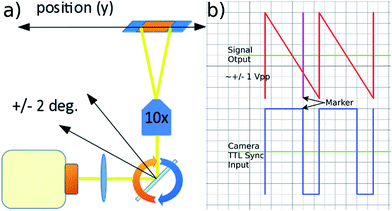
Fig. 1 shows the system diagram. The ultrasonic focussing mechanism is essential for two reasons: (1) the plane of acoustic focussing coincides with the imaging plane of the optical components, allowing sharp images of cells that pass by; (2) the hydrodynamic flow velocity profile in the channel means that cells in the central plane (and far from the channel sidewalls, see Fig. 2) will have the same flow velocity as each other, enabling motion blur to be removed as described below.Fluorescent imaging frequently requires exposure times of the order of several to tens of milliseconds with traditional microscope illumination. At high frame rates this would create significant motion blur in a flowing sample. We use an electronically controlled galvo mirror to track the motion of the flowing particles, stabilising their image on the camera sensor. The mirror is positioned in the infinity space of the objective so that changes in mirror angle map (via the tube lens) to a displaced field of view for the camera (see Fig. 5). The galvo mirror is controlled by a function generator that also supplies trigger pulses to the camera that control both the beginning and end of the exposure time. In our system the galvo mirror tracks the particles over a significant proportion of the field of view. The linearity of this displacement is explored below, where we show that the system is sufficiently linear to use a sawtooth waveform as the controlling signal for the mirror.
The flow profile in both the height and width directions is important, since for the galvo mirror to successfully remove motion blur, all particles must flow with the same velocity. Fig. 2 is based on results from COMSOL modelling of the flow profile in the channel, and shows that for particles in the levitation plane there is a variation in flow velocity of less than 0.005% in the central 2 mm region. In the height direction the velocity profile has a much larger gradient: if the particle levitation position drops by 3 μm from the centre plane the velocity decreases by 0.05% corresponding to a blur of around 1 pixel for our camera sensor. Investigation of this effect is described below.
The remaining components are typical for fluorescence microscopy and cytometry. White light from the light source (LS) is delivered through a light-pipe, collimated and shaped by the condenser lens (L3) and plano-convex lens (L4). In the current configuration we used only one camera for a single colour channel, however in the ESI† we indicate how this could be extended to multiple colour channels if extra cameras were obtained. The triple band filter cube (allowing for future expansion into multiple colours, a single band set would be sufficient for the results presented here) contains excitation and emission filters and a dichroic mirror as found in a conventional epi-fluorescent microscope.
Materials and methods
List of components and tools
The camera was a Hamamatsu Flash 4.0 C11440, a low noise camera capable of 2048 × 2048 pixel, 16 bit readout. The objective was a Nikon Plan-N 10×/025 FN 22 infinity focussed objective. The following (shown in Fig. 1) were purchased from Thorlabs: (LS) light source HPLS245; (L3) condenser lens ACL2520, focal length f = 20 mm; (L4) plano-convex lens LA1708-A, f = 200 mm; (L1), ITL200 infinity-corrected tube lens; (GM) GVS011 single axis galvo scanning system with silver-coated mirror, and GPS011 power supply. Filters and mirrors were purchased from Chroma: (TFC) cube mounted triple-band filter set 69000 DAPI/FITC/TRITC. The programmable function generator (PFG) used to sequentially drive the galvo mirror and the shutters of the camera was an Agilent 33500B. The frequency of the mirror tracking cycle was tuned manually, adjustment proceeding until the imaged particles became free from motion blur. The camera was operated in “external level trigger” mode, and supplied with TTL signal levels using the signal generator's built in ‘marker tool’. The timing of the trigger signal was such that exposure began at the beginning of the mirror cycle (with the mirror at its maximum deflection), and continued until 10 ms before the end of the mirror cycle in order to allow time for the camera readout process before the next frame.To drive the piezoelectric transducer a TTi TG1006 signal generator was used in conjunction with a custom amplifier based around a high frequency op-amp (linear technologies, LT1210). Frequency sweeping was employed, sweeping a 50 kHz range about a centre frequency of 2.286 MHz with period 50 ms; voltage amplitude 16 Vpp. A syringe pump (Harvard Apparatus Pump Elite 11) and a 10 ml glass syringe served to introduce the liquid samples. Image data collection was performed on a PC equipped with Active Silicon FireBird frame grabber with dual CamLink interfaces, and a RAID array of hard-disks providing capability of live-to-disk recording of 16 bit 2048 × 2048 grey scale images at a maximum of 100 fps. The software used to record the images and setup the Flash 4.0 cameras was HCImageLive.
Setup assembly
The cameras and optical components were assembled according to schematics on Fig. 1, and as seen in the photographs in Fig. 3. Components were mounted on a Thorlabs cage system. The galvo mirror was placed on an x-y-z stage to fine-tune its position. The flow cell was fixed onto a stage formed by a Thorlabs LCP02 cage plate adapter using magnets allowing manual adjustment of the flow direction by in-plane twisting of the glass chip with respect to the field of view.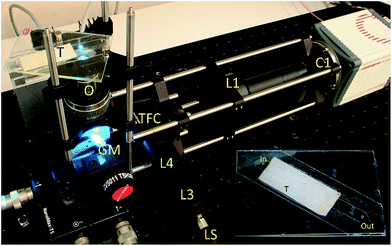 | ||
| Fig. 3 System assembly and setup. Symbols describing the components are the same as for Fig. 1 (inset: the flow cell removed from the system). The imaging region is illuminated by the blue spot. | ||
Flow cell chip assembly
We created a channel of dimensions 6 × 60 × 0.320 mm between two glass slides by using double-sided tape (3M 9629PC). Three layers of the tape were used to produce the desired channel height, and a laser cutter was used to form a straight channel. The prepared tape was sandwiched between two glass plates (standard 1 mm thick, 25 × 75 mm microscope slides) along their diagonal. At both ends of the channel, holes of 1 mm diameter were drilled through one layer of the glass, creating input and output ports for the fluid. We used a simple straight channel to prove our concept. This meant that only a fraction of the sample flowing through the chip passed through the narrower imaging region. In a more sophisticated version of the device, a lateral hydrodynamic sheath flow could be introduced to confine the sample to the field of view of the camera. The transducer was made from PZT (Ferroperm, Denmark, PZ26), a 1 mm thick 15 × 43 mm element, which was glued to the glass chip with epoxy (Epotek 301). The finished flow cell chip is shown in Fig. 3.Sample preparation
Initial tests and system characterisation was performed using 10 μm fluorescent beads in distilled water at various concentrations (YG Fluoresbrite microspheres, Polysciences Inc.). ATDC5 (pre-chondrocytic) cell line and primary leukaemia cells were used to demonstrate this system. All chemicals and cell lines in this section were obtained from Lonza, unless stated otherwise.ATDC5 cells were cultured in Dulbecco's Modified Eagle Medium (DMEM, BE12-604F/12) with 5% (v/v) fetal bovine serum (FBS), 1× insulin–transferin–selenium (ITS, Sigma I3146), 100 unit per ml penicillin, and 100 unit per ml streptomycin. Cultures were maintained in a humidified environment at 37 °C and 5% CO2. Prior to imaging, the cells were fluorescently labelled with a 20 μM solution of Cell Tracker Green (CMFDA, Invitrogen) for 30 min.
Chronic lymphocytic leukaemia (CLL) samples were collected from patients and frozen as described previously.47 Approval was obtained by the Southampton University Hospitals National Health Service (NHS) Trust from the Southampton and South West Hampshire Research Ethics Committee. Informed consent was provided in accordance with the Declaration of Helsinki. CLL cells were removed from liquid nitrogen, thawed and allowed to recover for an hour in RPMI-1640 media supplemented with 10% FBS, 1% penicillin streptomycin, 1% glutamine. They were then centrifuged at 350g for 5 minutes and re-suspended in 2 ml pre-warmed PBS. SYTO-9 (Invitrogen, S-34854) nuclear stain was added to the suspension at a concentration of 5 μM and incubated for 20 min.
System characterisation
Acoustic focussing
The half-wave acoustic resonance23 was identified at a frequency of 2.286 MHz from examination of the electrical impedance spectrum (see the ESI†). At this frequency we expect a pressure nodal plane at the device half-height, creating acoustic radiation forces that direct all particles towards a final equilibrium position close to this plane. The actual position will depend on the balance between gravitational and acoustic forces. This position is independent of particle size (as both forces scale with particle volume), but may vary with particle properties. This effect was not found to be significant in the example samples we present below. The focussing effect can be visualised in Fig. 4 (real time video of this focussing in-flow is available in the ESI†), which shows beads imaged both with and without an active acoustic field. As expected, without the ultrasound particles travel at various different velocities and depths, thus appearing as enlarged out-of-focus spots, and only a few particles remain in the focal plane of the objective.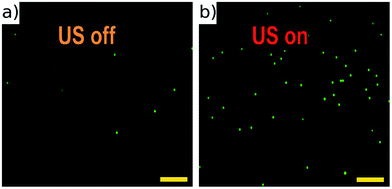 | ||
| Fig. 4 Fluorescent 10 μm beads flowing in the channel with acoustic focussing deactivated (a), and activated (b). These images are taken at low flow rates, and no galvo mirror tracking to illustrate the requirement for acoustic focussing. A movie of this can be found in ESI.† Scale bars 100 μm. | ||
Since the device is sharply resonant, it is difficult to guarantee identical acoustic excitation from experiment to experiment when using a single drive frequency. For this reason we chose to drive the transducer using a frequency sweep, so that any small variations in resonant frequency would be accommodated. During the sweep period (50 ms) the resonance is “hit” periodically, and as long as the sweep rate is fast enough this will result in an apparent averaging of the forces profiles corresponding to each frequency.48
Prior modelling work suggests that the pressure nodal plane in such a device can frequently take on a “corrugated” shape.23 As described above, even a small deviation from the device mid-plane can lead to particles experiencing lower flow rates, and becoming blurred in the final image. However, in a flow though device particles will experience sections of the acoustic device with differing node positions, and if their flow velocity is sufficiently high then we would expect their final height in the flow to result from the average force they experience during their transit, reducing the effects of any corrugations. We also believe that using tape as a lateral boundary condition in the device helps damp unwanted lateral modes, as the tape will provide significant acoustic damping for modes that couple into it, and we observe significantly fewer lateral effects in this device compared to those based on glass capillaries that we initially trialled. The particle tracking studies below show that the acoustic environment is sufficiently uniform in levitation height to result in blur spread functions of close to 1 pixel.
The residence time required to focus a particle into the imaging plane will depend upon the volume of the particles. For smaller particles it was found necessary to decrease the flow rate to allow for this. Our experiments indicate that for the leucocytes we would have benefitted from a longer device as the maximum frame/flow rate we could achieve was limited by the maximum focussing force. At the 80 fps frame rate (the maximum we report), 10 μm fluorescent polystyrene beads can be successfully acoustically focussed while travelling at a linear velocity of 104 mm s−1 over the length of the 43 mm transducer. The drive voltage (16 Vpp) was chosen by examining focussing performance versus voltage and choosing an optimum value (too high a voltage can result in heating, and unwanted streaming effects).
Effect of gravity on focussing position
In the orientation presented here gravity will cause beads to sit slightly below the pressure nodal plane of the device. The equilibrium position will be at the height where gravitational forces (weight plus buoyancy) balance the acoustic forces. This equilibrium is reached49 when
3kεϕ![[thin space (1/6-em)]](https://www.rsc.org/images/entities/char_2009.gif) sin(2kz) = (ρp − ρf)g sin(2kz) = (ρp − ρf)g
| (1) |
In our system, the acoustic pressure amplitude was measured using the voltage drop method50 to be an average of 520 kPa over the sweep period. Table 1 lists the predicted z-positions for a range of particle types (with ρf = 1003 kg m−3). It can be seen that in a mixed sample of red-blood cells, white-blood cells and prostate cancer cells (which show considerable variation in ϕ) we would expect all cells to lie within planes separated by less than a micrometre. This falls easily within the 8.5 μm depth-of-field of the 10× objective, and the flow profile is such that blurring (along the flow direction) due to particles moving with different velocities will become evident before significant optical blurring from the objective occurs. The flow profile modelling above, indicates that the flow profile gradients in the z-direction should not cause significant blurring for this range of z-positions. This is verified in the results section where we quantify the level of blurring by assessing the aspect ratio of imaged particles. The low impact of the gravitational offset is mainly due to the close match in density between the PBS medium and the cell types. With more dense particles, this could become an issue which could be solved by rotating the system such that gravity acted along the channel length. For smaller particles Brownian motion will limit the tightness of the acoustic focussing that can be achieved, however this is not thought to be significant for the scale of particles tested here.51
Image tracking linearity
The linearity of the mapping between the galvo mirror's angle and the displaced field of view seen by the camera sensor was explored by taking a series of images of a haemocytometer slide across a range of mirror angles corresponding to those used in the experiments. From thin lens theory we expect an approximate relationship of| δ = f × tan(θ), | (2) |
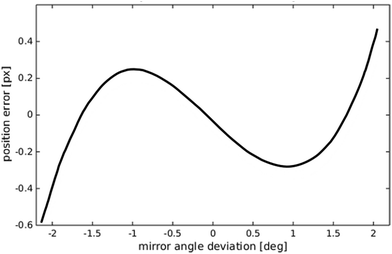 | ||
| Fig. 6 Predicted deviation from a linear mapping between galvo mirror angle and displaced field of view seen by the camera. | ||
Particle velocity uniformity
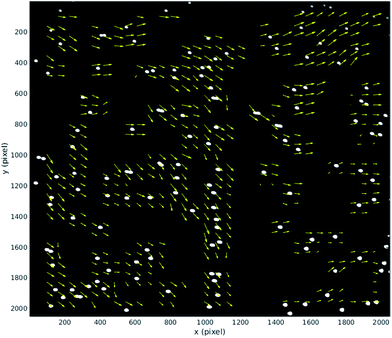
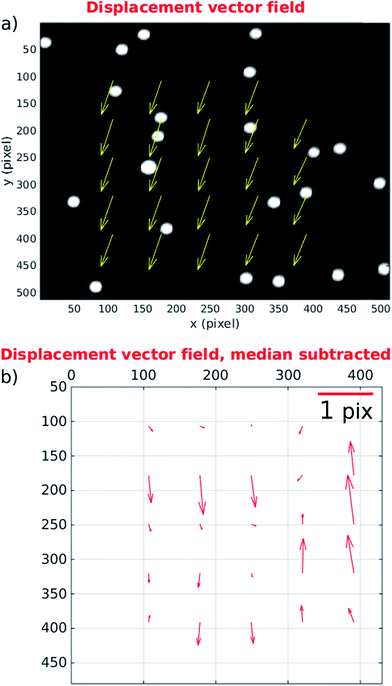
This section provides quantitative analysis of factors influencing image quality by using particle image velocimetry to examine the movement of particles through the imaging region. We have made use of the Matlab based tool, MPIV.54 In the ideal case all the particles in the imaging region would move with the same uniform velocity so that a perfectly synchronised galvo mirror would result in no motion blur at the camera. Several factors can influence this: (i) flow fluctuations due to pulsations of the pump can occur within a single mirror cycle; (ii) non-uniformities in acoustic field can also cause individual particles within a single frame to move faster/slower than others and/or take on a sideways movement if lateral components of the acoustic resonance exist in the imaging region;25 (iii) finally, misalignment of optical elements or the flow cell itself can cause the tracking provided by the galvo mirror to be offset by an angle from the path taken by particles (see discussion of results below).During normal operation our system exposes one frame per mirror cycle, relying on the mirror to remove the motion blur. In this section, multiple images are taken during a single mirror cycle in order to track small movements of the particles that would contribute to blurring during normal operation. In order to do this for the full field of view, the flow rate is slowed to allow for the 100 fps maximum frame rate of the camera. Fig. 7 shows the distance a population of 10 μm fluorescent beads (see above), move between the beginning and end of a mirror cycle at a mirror cycle frequency of around 1 Hz. The mirror cycle frequency has been tuned manually so that beads appear nearly static. It can be seen that there is mean motion (going predominantly left to right, across the flow) relating to a small angular misalignment between the flow channel and mirror tracking (this is reduced through more careful alignment in the experimental results presented later). However in addition to this, there is a spatially varying displacement component. This has several possible sources: (a) spatial flow variation in the imaging region; (b) variations in acoustic focussing position resulting in beads travelling in different parts of the flow profile;23 (c) acoustic forces within the imaging region;25 (d) acoustic streaming; and (e) optical distortions. We favour (b and c) as likely to be the strongest effects; this is supported by the experimentally measured distribution of the vectors, and the uniformity of the flow channel profile evidenced by the strong acoustic resonance.
We find that at faster flow rates these distortions are found to be smaller. Fig. 8 presents results at a more realistic flow rate of 100 ml h−1, and mirror cycle frequency of close to 20 Hz, but with a reduced field of view to allow a 400 fps frame rate. The linear velocity of beads at this flow rate was 26 mm s−1, and the figure shows the displacement measured between the first and last frames taken from a single mirror cycle. Again a mean displacement is seen, this time including a stronger component in the flow direction from imperfect frequency tuning in this experiment. After subtracting this average displacement (Fig. 8(b)) it can be seen that beads within this region have flow velocities that are closely similar to each other, and that the acoustic forces are successfully bringing them into good focus.
It is important to examine the movement of particles at time points between the beginning and end of the mirror cycle. For example, if there were pulsations present in the pump driven flow, it would be possible for a bead image to start and end in a similar location on the CMOS sensor, but to move out of position in the interim. For this reason, Fig. 9(a) and (c) (based on the same data used in Fig. 8) shows the evolution of bead displacement vectors at 15 time points during the mirror cycle (relative to the position in the first frame taken during a cycle), splitting the displacements into their x and y components. The mean values at each time point show an approximately linear trend, which results from both imperfect frequency tuning, and some misalignment of the flow cell. The deviations from a strictly linear increase of the mean y-errors are probably due to variations in flow from pump pulsation.
By suitably tuning the mirror cycle frequency and adjusting the angle of the flow cell with respect to the mirror tracking, the linear offsets can be made arbitrarily small. In Fig. 9(b) and (c) we subtract the median value at each time-point, which shows more clearly the errors relating to acoustic focussing (since they are not influenced by pump pulsation, or accuracy of galvo frequency tuning). The majority of variation is seen in the y-direction (with flow), supporting the hypothesis that this is caused by variation in focussed bead height. These remaining distortions/errors are seen from Fig. 9 to be of the order of 1 pixel.
We assessed whether there was a consistent spatial variation in the blur forming deviations across rows and columns of image data from the device. Examining slower flow rate data that covered the whole field of view, we did not find significant patterning, supporting the hypothesis that the acoustic focussing was reasonably even across the field of view.
Experimental
The reported throughputs in this section reflect the rate at which our device is capable of both acoustically focussing and imaging the particles. Counting and shape analysis was performed off-line using ImageJ55 by thresholding the images and applying a watershed transform to separate particles that were in groups or clusters. While the throughput of a real system might also be limited by the rate at which images can be processed, this is application dependent, and we would consider the computational load of, for example, locating a small number of fluorescently tagged cells in the image stream at 80 fps to be low for modern graphical processing hardware.Fluorescent beads
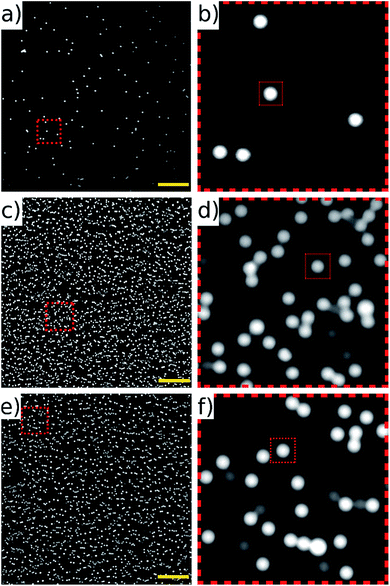
Initial evaluation of the system was performed using 10 μm FITC-labelled fluorescent beads at various frame rates and corresponding velocities. In order to achieve a frame rate of 80 fps, we used a 400 ml h−1 sample flow rate (this includes sample that is not imaged at the sides of the device), corresponding to a linear bead velocity of 104 mm s−1.Due to the architecture of the Flash4 camera, sensor readout must be complete before the next frame's exposure begins. The readout time is 10 ms at all frame rates, and if the maximum frame rate of 100 fps is approached the time remaining for the exposure becomes vanishingly small. At 80 fps, the full mirror cycle lasts for 12.5 ms, and the shutter could be opened for a 2.5 ms. Fig. 10 compares images of static beads (allowed to sediment onto the base of the device) exposed for 2.5 ms (a and b), and a single frame of beads recorded in flow using our mirror scanning technique at 80 fps (c and d). The image of the beads scanned in flow compares well with the static images. It is interesting to note that without the mirror scanning, the beads would have traversed a distance of 410 pixels during this exposure time. Imaging at 50 fps allows for a longer exposure time of 10 ms which is more challenging for the mirror tracking; imaging at this rate is shown in (e and f).
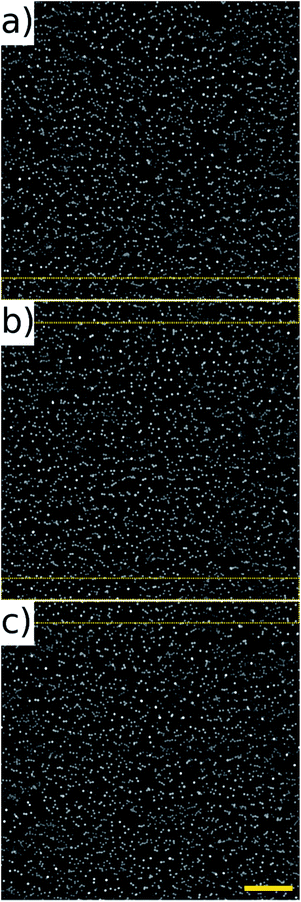
The noticeably dimmer sub population of beads seen in Fig. 10(d) and (f) are from an older, partially photo-bleached sample of beads, added to increase the concentration in the sample to perform the high throughput experiments. Multiple frames of the beads in flow were acquired at 80 fps of which three consecutive frames are shown in Fig. 11. These frames come from a sequence of 100 frames acquired over a period of 1.25 s. The average number of beads per frame was 2610 which corresponds to a throughput of approximately 208![[thin space (1/6-em)]](https://www.rsc.org/images/entities/char_2009.gif) 800 beads per second. It can be seen that there is an overlap area between successive frames, highlighted by the dotted rectangles on Fig. 11. This overlap can be reduced by increasing the amplitude of the waveform driving the galvo mirror, however we keep it at this level here in order to demonstrate that all beads passing through the field of view can be imaged without loss.
800 beads per second. It can be seen that there is an overlap area between successive frames, highlighted by the dotted rectangles on Fig. 11. This overlap can be reduced by increasing the amplitude of the waveform driving the galvo mirror, however we keep it at this level here in order to demonstrate that all beads passing through the field of view can be imaged without loss.
Cell imaging
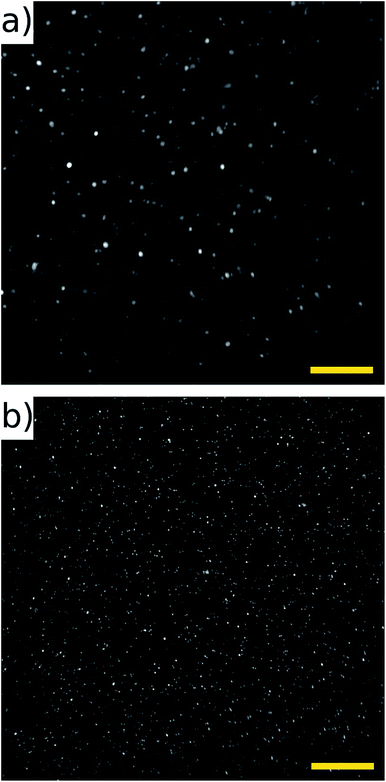
We selected two distinct cell types for evaluation. We selected CLL blood samples for analysis of primary blood cells. CLL blood samples contain high numbers of monoclonal B-lymphocytes with an average diameter of 7 μm. For the samples studied, cell viability was >90% and the proportion of malignant cells was >92%. The ATDC5 cell line was chosen for its larger size, comparable to that of CTCs. Fig. 12 parts (a) and (b) show results for the ATDC5 and CLL cells respectively. At 80 fps imaging, a throughput of 60![[thin space (1/6-em)]](https://www.rsc.org/images/entities/char_2009.gif) 400 ATDC5 cells per second was achieved. The cell density was lower than that used in bead experiments, and we feel that this rate could be perhaps doubled (or more) by working with higher cell concentrations. Due to the smaller size of the CLL cells (and possibly due to differences in acoustic contrast factor), a slower flow rate was required in order to achieve effective acoustic focussing into a single plane. We demonstrate here acquisition at 25 fps, equivalent to 32.5 mm s−1 cell velocity. At this rate a throughput of 52
400 ATDC5 cells per second was achieved. The cell density was lower than that used in bead experiments, and we feel that this rate could be perhaps doubled (or more) by working with higher cell concentrations. Due to the smaller size of the CLL cells (and possibly due to differences in acoustic contrast factor), a slower flow rate was required in order to achieve effective acoustic focussing into a single plane. We demonstrate here acquisition at 25 fps, equivalent to 32.5 mm s−1 cell velocity. At this rate a throughput of 52![[thin space (1/6-em)]](https://www.rsc.org/images/entities/char_2009.gif) 350 cells per second is demonstrated. Higher velocities/frame rates would be achievable by making the acoustic focussing region in the device longer, which we would predict to result in a throughput of around double this at 50 fps. Videos showing successive frames of the bead and cell experiments are presented in the ESI.†
350 cells per second is demonstrated. Higher velocities/frame rates would be achievable by making the acoustic focussing region in the device longer, which we would predict to result in a throughput of around double this at 50 fps. Videos showing successive frames of the bead and cell experiments are presented in the ESI.†
Image quality
To assess the performance of the focussing and particle tracking system we examined the aspect ratios of imaged cells and beads. As discussed above, the large depth of field (8.5 μm) of the objective compared to the steep gradient in the velocity flow profile means that any failure of the acoustic focussing or movement of the galvo mirror tracking will show up as elongation of particle images in the flow direction. Images were processed as described above, producing statistics for the x and y lengths of each particle. Table 2 lists the results for each type of particle presented here. The results for the CLL cells are restricted to the top right quadrant of the images as we discovered that some optical misalignment during the capture of those images was creating distortion in the other quadrants that would be misinterpreted as blurring. The elongation ratio is the ratio of length in the flow direction to length across flow, and will be greater than one if particles lie either above or below the plane that matches the galvo tracking velocity. Note that in order to avoid measuring agglomerates of particles, the counting algorithms size threshold was set to only measure a smaller sub-population of the particles in the frame. The table also calculates the number of pixels by which the extended shape is longer than a perfect circle and can be considered related to the amount of blurring. It can be seen that for all the particle types considered here that the amount of blurring is generally small. We do not consider de-convolution methods in this paper, but note that even with significantly larger levels of blurring there exists the possibility of post-processing the images to reduce potential degradation of image quality.20| Mean diameter (pixels) | Elongation ratio | Number of pixels extension | |
|---|---|---|---|
| Beads | 19.5 | 1.056 | 1.09 |
| CLL cells | 13.6 | 1.063 | 0.85 |
| ATDC5 | 27.4 | 1.067 | 1.83 |
Conclusions
This work has demonstrated a high throughput imaging cytometer based on an ultrasonic focussing method. The particles were acoustically focused into a single flat layer addressing the problem of image blur due to the shallow depth of field of the objective. The device was capable of imaging in fast flows of up to 104 mm s−1 resulting in a throughput of 208![[thin space (1/6-em)]](https://www.rsc.org/images/entities/char_2009.gif) 000 beads per second. Motion blur induced by particle flow was addressed tracking them with a controllable galvo mirror and taking advantage of the uniform velocities of acoustically focussed particles.
000 beads per second. Motion blur induced by particle flow was addressed tracking them with a controllable galvo mirror and taking advantage of the uniform velocities of acoustically focussed particles.
Hi-throughput imaging of ATDC5 (pre-chondrocytic) cell line and primary leukaemia cells was demonstrated. The throughputs of these cells (52![[thin space (1/6-em)]](https://www.rsc.org/images/entities/char_2009.gif) 350 and 60
350 and 60![[thin space (1/6-em)]](https://www.rsc.org/images/entities/char_2009.gif) 400 cells per second) were limited by cell density and acoustic focussing time respectively, and we anticipate showing throughputs comparable to those obtained with beads in future work. Although this paper demonstrates the principle of operation based on a single colour channel, it could be extended to multiple colour channels to meet the needs of fluorescent imaging required in applications such as detecting circulating tumour cells.
400 cells per second) were limited by cell density and acoustic focussing time respectively, and we anticipate showing throughputs comparable to those obtained with beads in future work. Although this paper demonstrates the principle of operation based on a single colour channel, it could be extended to multiple colour channels to meet the needs of fluorescent imaging required in applications such as detecting circulating tumour cells.
In order to bring this technology to practical implementation a number of improvements are still required. Addressing the CTC application in particular, where ideally 1 CTC in 10 ml of blood would be detected, we note that:
• Throughput of blood cells could be increased to be comparable with that of beads (by making the channel longer). At our bead throughput rates, the approximately 1 × 10⁸ white blood cells in 10 ml of lysed blood could be processed in around 8 minutes.
• Automated tuning of mirror tracking is required as manual tuning is imprecise.
• At least three colour channels would be required.
• Sheath flow would be required in order to not lose sample at the device margins.
• Current Image quality should be sufficient to resolve morphological detail, particularly with the addition of automatic mirror tuning, and the possibility of deconvolution to sharpen blurring. If higher resolution were required, moving to a 20× objective would enhance detail at the expense of a 4× reduction in throughput.
Acknowledgements
Peter Glynne-Jones gratefully acknowledges support from EPSRC under grant EP/K027115/1 and Fellowship EP/L025035/1. We are also grateful for financial support from Cancer Research UK, Experimental Cancer Medicine Centre, The University of Southampton and Leukaemia and Lymphoma Research. We also thank Dr Francesco Forconi and the Southampton Tissue Bank for assistance in providing CLL samples. Experimental data related to the above EPSRC projects is openly available from the University of Southampton repository at http://dx.doi.org/10.5258/SOTON/381318.References
- L. Manso, I. Tusquets, C. de la Piedra, C. Crespo, P. Gomez, L. Calvo, E. Galve, M. R. Borrego, J. Rifa and A. Barnadas, Eur. J. Cancer, 2011, 47, S337 CrossRef.
- M. Danova, M. Torchio and G. Mazzini, Expert Rev. Mol. Diagn., 2011, 11, 473–485 CrossRef PubMed.
- S. Nagrath, L. V. Sequist, S. Maheswaran, D. W. Bell, D. Irimia, L. Ulkus, M. R. Smith, E. L. Kwak, S. Digumarthy, A. Muzikansky, P. Ryan, U. J. Balis, R. G. Tompkins, D. A. Haber and M. Toner, Nature, 2007, 450, 1235–1239 CrossRef CAS PubMed.
- M. Yu, S. Stott, M. Toner, S. Maheswaran and D. A. Haber, J. Cell Biol., 2011, 192, 373–382 CrossRef CAS PubMed.
- M. Wallwiener, S. Riethdorf, D. Hartkopf, C. Modugno, J. Nees, D. Madhavan, M. R. Sprick, S. Schott, C. Domschke, I. Baccelli, B. Schonfisch, B. Burwinkel, F. Marme, J. Heil, C. Sohn, K. Pantel, A. Trumpp and A. Schneeweiss, BMC Cancer, 2014, 14, 512 CrossRef PubMed.
- S. K. Kraeft, A. Ladanyi, K. Galiger, A. Herlitz, A. C. Sher, D. E. Bergsrud, G. Even, S. Brunelle, L. Harris, R. Salgia, T. Dahl, J. Kesterson and L. B. Chen, Clin. Cancer Res., 2004, 10, 3020–3028 CrossRef CAS PubMed.
- S. K. Kraeft, R. Sutherland, L. Gravelin, G. H. Hu, L. H. Ferland, P. Richardson, A. Elias and L. B. Chen, Clin. Cancer Res., 2000, 6, 434–442 CAS.
- G. R. Goddard, C. K. Sanders, J. C. Martin, G. Kaduchak and S. W. Graves, Anal. Chem., 2007, 79, 8740–8746 CrossRef CAS PubMed.
- V. Kachel, G. Benker, K. Lichtnau, G. Valet and E. Glossner, J. Histochem. Cytochem., 1979, 27, 335–341 CrossRef CAS PubMed.
- D. A. Basiji, W. E. Ortyn, L. Liang, V. Venkatachalam and P. Morrissey, Clin. Lab. Med., 2007, 27, 653–670 CrossRef PubMed.
- T. M. Scholtens, F. Schreuder, S. T. Ligthart, J. F. Swennenhuis, A. G. J. Tibbe, J. Greve and L. W. M. M. Terstappen, Cytometry, Part A, 2011, 79A, 203–213 CrossRef CAS PubMed.
- E. Schonbrun, A. R. Abate, P. E. Steinvurzel, D. A. Weitz and K. B. Crozier, Lab Chip, 2010, 10, 852–856 RSC.
- S. C. Hur, H. T. K. Tse and D. Di Carlo, Lab Chip, 2010, 10, 274–280 RSC.
- B. K. McKenna, J. G. Evans, M. C. Cheung and D. J. Ehrlich, Nat. Methods, 2011, 8, 401–U441 CrossRef CAS PubMed.
- V. K. Jagannadh, M. D. Mackenzie, P. Pal, A. K. Kar and S. S. Gorthi, IEEE J. Sel. Top. Quantum Electron., 2015, 21(4), 68100106 CrossRef.
- E. Schonbrun, S. S. Gorthi and D. Schaak, Lab Chip, 2012, 12, 268–273 RSC.
- R. J. Olson and H. M. Sosik, Limnol. Oceanogr.: Methods, 2007, 5, 195–203 CrossRef.
- J. Wu, J. Li and R. K. Chan, Opt. Express, 2013, 21, 14474–14480 CrossRef CAS PubMed.
- J. Wu and R. K. Chan, Opt. Express, 2013, 21, 23921–23926 CrossRef PubMed.
- S. S. Gorthi, D. Schaak and E. Schonbrun, Opt. Express, 2013, 21, 5164–5170 CrossRef CAS PubMed.
- A. Haake and J. Dual, Ultrasonics, 2002, 40, 317–322 CrossRef CAS PubMed.
- A. Haake, A. Neild, G. Radziwill and J. Dual, Biotechnol. Bioeng., 2005, 92, 8–14 CrossRef CAS PubMed.
- P. Glynne-Jones, R. J. Boltryk and M. Hill, Lab Chip, 2012, 12, 1417–1426 RSC.
- P. Glynne-Jones, R. J. Boltryk, M. Hill, F. Zhang, L. Dong, J. S. Wilkinson, T. Melvin, N. R. Harris and T. Brown, Anal. Sci., 2009, 25, 285–291 CrossRef CAS PubMed.
- P. Glynne-Jones, C. E. Demore, C. Ye, Y. Qiu, S. Cochran and M. Hill, IEEE Trans. Ultrason. Eng., 2012, 59, 1258–1266 CrossRef PubMed.
- M. Evander and J. Nilsson, Lab Chip, 2012, 12, 4667–4676 RSC.
- M. Wiklund, S. Nilsson and H. M. Hertz, J. Appl. Phys., 2001, 90, 421–426 CrossRef CAS.
- J. J. Hawkes and W. T. Coakley, Sens. Actuators, B, 2001, 75, 213–222 CrossRef CAS.
- F. Petersson, A. Nilsson, C. Holm, H. Jönsson and T. Laurell, Analyst, 2004, 129, 938–943 RSC.
- G. Goddard, J. C. Martin, S. W. Graves and G. Kaduchak, Cytometry, Part A, 2006, 69A, 66–74 CrossRef PubMed.
- J. Shi, X. Mao, D. Ahmed, A. Colletti and T. J. Huang, Lab Chip, 2008, 8, 221–223 RSC.
- L. Gao, C. W. Shields, L. M. Johnson, S. W. Graves, B. B. Yellen and G. P. López, Biomicrofluidics, 2015, 9, 014105 CrossRef PubMed.
- M. Kumar, D. L. Feke and J. M. Belovich, Biotechnol. Bioeng., 2005, 89, 129–137 CrossRef CAS PubMed.
- D. Carugo, T. Octon, W. Messaoudi, A. Fisher, M. Carboni, N. R. Harris, M. Hill and P. Glynne-Jones, Lab Chip, 2014, 14, 3830–3842 RSC.
- L. A. Crum, J. Acoust. Soc. Am., 1971, 50, 157–163 CrossRef.
- M. Zhou, F. Cavalieri, F. Caruso and M. Ashokkumar, ACS Macro Lett., 2012, 1, 853–856 CrossRef CAS.
- M. E. Piyasena and S. W. Graves, Lab Chip, 2014, 14, 1044–1059 RSC.
- P. P. A. Suthanthiraraj, M. E. Piyasena, T. A. Woods, M. A. Naivar, G. P. Lopez and S. W. Graves, Methods, 2012, 57, 259–271 CrossRef PubMed.
- Y. Chen, A. A. Nawaz, Y. Zhao, P.-H. Huang, J. P. McCoy, S. J. Levine, L. Wang and T. J. Huang, Lab Chip, 2014, 14, 916–923 RSC.
- M. E. Piyasena, P. P. A. Suthanthiraraj, R. W. Applegate, A. M. Goumas, T. A. Woods, G. P. López and S. W. Graves, Anal. Chem., 2012, 84, 1831–1839 CrossRef CAS PubMed.
- O. Jakobsson, M. Antfolk and T. Laurell, Anal. Chem., 2014, 86, 6111–6114 CrossRef CAS PubMed.
- Y. Liu, PhD, National University of Singapore, 2009.
- X. Mao, A. A. Nawaz, S.-C. S. Lin, M. I. Lapsley, Y. Zhao, J. P. McCoy, W. S. El-Deiry and T. J. Huang, Biomicrofluidics, 2012, 6, 024113 CrossRef PubMed.
- M. G. Lee, S. Choi and J.-K. Park, Lab Chip, 2009, 9, 3155–3160 RSC.
- D. Holmes, H. Morgan and N. G. Green, Biosens. Bioelectron., 2006, 21, 1621–1630 CrossRef CAS PubMed.
- X. Xuan, J. Zhu and C. Church, Microfluid. Nanofluid., 2010, 9, 1–16 CrossRef.
- C. I. Mockridge, K. N. Potter, I. Wheatley, L. A. Neville, G. Packham and F. K. Stevenson, Blood, 2007, 109, 4424–4431 CrossRef CAS PubMed.
- P. Glynne-Jones, R. J. Boltryk, N. R. Harris, A. W. J. Cranny and M. Hill, Ultrasonics, 2010, 50, 68–75 CrossRef CAS PubMed.
- M. Hill and N. R. Harris, in Microfluidic Technologies for Miniaturized Analysis Systems (MEMS Reference Shelf), ed. S. Hardt and F. Schönfeld, Springer-Verlag New York Inc, 2007, pp. 357–383 Search PubMed.
- J. F. Spengler, M. Jekel, K. T. Christensen, R. J. Adrian, J. J. Hawkes and W. T. Coakley, Bioseparation, 2001, 9, 329–341 CrossRef.
- K. Higashitani, M. Fukushima and Y. Matsuno, Chem. Eng. Sci., 1981, 36, 1877–1882 CrossRef CAS.
- L. Gherardini, C. M. Cousins, J. J. Hawkes, J. Spengler, S. Radel, H. Lawler, B. Devcic-Kuhar and M. Groschl, Ultrasound Med. Biol., 2005, 31, 261–272 CrossRef PubMed.
- R. Barnkob, P. Augustsson, C. Magnusson, H. Lilja, T. Laurell and H. Bruus, Proceedings of the 15th International Conference on Miniaturized Systems for Chemistry and Life Sciences, 2011, pp. 127–129 Search PubMed.
- N. Mori and K.-A. Chang, "Introduction to MPIV", user reference manual, 2003, p. 14 Search PubMed.
- C. A. Schneider, W. S. Rasband and K. W. Eliceiri, Nat. Methods, 2012, 9, 671–675 CrossRef CAS PubMed.
Footnote |
| † Electronic supplementary information (ESI) available. See DOI: 10.1039/c5ra19497k |
| This journal is © The Royal Society of Chemistry 2015 |

