Generation of silver titania nanoparticles from an Ag–Ti alloy via picosecond laser ablation and their antibacterial activities

Abubaker Hamad*a, Lin Lia, Zhu Liub, Xiang Li Zhongb, Hong Liub and Tao Wangc
aLaser Processing Research Centre, School of Mechanical, Aerospace and Civil Engineering, The University of Manchester, Manchester, M13 9PL, UK. E-mail: abubaker.hamad75@yahoo.co.uk; Tel: +44 7550224222
bSchool of Materials, The University of Manchester, Manchester, M13 9PL, UK
cFaculty of Medical and Human Sciences, The University of Manchester, Manchester, M13 9PL, UK

Received 15th August 2015 , Accepted 18th August 2015

First published on 20th August 2015


Abstract

In this work, a bulk Ti/Ag alloy was used, for the first time, to produce Ag–TiO2 compound nanoparticles using picosecond laser ablation in deionised water. Spherical Ag–TiO2 compound nanoparticles with an average size of 31 nm were produced. They were characterised using UV-VIS spectrometry, transmission electron microscopy (TEM), High-Angle Annular Dark-Field-Scanning Transmission Electron Microscopy (HAADF-STEM), Energy Dispersive X-ray Spectroscopy (EDS), X-ray Photoelectron Spectroscopy (XPS) and X-ray Diffraction (XRD) methods to identify the nanoparticle size distribution, morphology, chemical composition, phase and surface properties. It was found that Ag-doped TiO2 nanoparticles were produced. The optical absorption spectra of the Ag–TiO2 compound nanoparticles shifted to longer wavelengths. The antibacterial activity of the Ag–TiO2 compound nanoparticles against Gram-negative Escherichia coli (E. coli) bacteria was examined and compared with those using laser generated Ag and TiO2 nanoparticles and distilled deionised water (as the control). It was found that the antibacterial activity of the Ag–TiO2 compound nanoparticles was better than laser generated TiO2 nanoparticles and chemically produced Ag nanoparticles, and was almost as good as laser generated Ag nanoparticles while Ag–TiO2 was used at a much lower Ag concentrations. The reason behind this is discussed.

1. Introduction

One of the biggest threats to humanity is the drug resistants by bacteria to antibiotics. Over the past decade, many potential antibacterial agents—including noble metallic nanoparticles and nano metal-oxides—have been found to be toxic against bacteria. Due to the specific properties of Ag and TiO2 nanoparticles for different applications, particularly in bioscience for antimicrobial functions, they have been produced and modified using various methods, including chemical and physical methods. Silver and titania nanoparticles have been produced for their antibacterial functions, both individually and by way of modification with each other to produce bimetallic particles. On the other hand, due to the increasing use of silver and titanium dioxide nanoparticles in the medical field and everyday products, some researchers have expressed their concerns over the environmental impacts of nanoparticles. The risks of using these nanoparticles have been evaluated in terms of their toxicity for human or animal cells such as red blood cells,1 human lung cancer cell lines, A549,2 and human and rat liver cells.3 It is therefore desirable to maintain the antibacterial activity while reducing the toxicity to human and animal cells. Ag nanoparticles are the most effective material for antibacterial functions. However, their effective period is short, typically within a few weeks. TiO2 nanoparticles last much longer. However, they are less effective in antibacterial functions and they require UV light to activate their photo catalytic activities.

To produce more effective nanoparticles for antibacterial function, bulk alloy and composite materials were used to prepare alloy and compound nanoparticles. For this purpose laser ablation techniques have been used by some researchers; for example, Lee et al.4 and Kuladeep et al.5 prepared Au–Ag alloy nanoparticles using pulsed laser ablation in water and a polyvinyl alcohol (PVA) solution respectively. They generated a tunable localized surface plasmon resonance (SPR) frequency using different ratios of Au[thin space (1/6-em)]:[thin space (1/6-em)]Ag, including 100[thin space (1/6-em)]:[thin space (1/6-em)]0, 75[thin space (1/6-em)]:[thin space (1/6-em)]25, 50[thin space (1/6-em)]:[thin space (1/6-em)]50, 25[thin space (1/6-em)]:[thin space (1/6-em)]75 and 0[thin space (1/6-em)]:[thin space (1/6-em)]100% (ref. 5) and 25[thin space (1/6-em)]:[thin space (1/6-em)]75, 50[thin space (1/6-em)]:[thin space (1/6-em)]50 and 75[thin space (1/6-em)]:[thin space (1/6-em)]25%.4 It was also concluded that the size distribution of the alloy nanoparticles produced can be controlled using suitable laser pulse energy and time exposure.4 Grade et al.6 generated homogenous Au–Ag nanoalloys via laser ablation in liquid environments. In order to stabilize the produced nanoparticles in biological media, they were conjugated ex situ using bovine serum albumin (BSA). It was observed that a higher ratio of Au in the Au–Ag nanoalloys led to a reduction in antibacterial activity and cytotoxicity. It was found that 12 μg cm−3 of pure Ag nanoparticles prevented bacterial growth, but 50 μg cm−3 of Ag–Au alloy nanoparticles with 50% Au was ineffective in inhibiting the bacteria growth. This reduction of the antibacterial activity of the alloy nanoparticles is due to the effect of Au ratio on the release of silver ions.6

Ag-modified TiO2 have been used for antibacterial functions. For instance; Ramesh et al.7 generated Ag and TiO2 nanoparticles separately by sonochemical and colloidal methods respectively; the nanoparticles produced were spherical in shape and their sizes fell within the range of 20 to 50 nm. The Ag and TiO2 nanoparticles were used as antibiotic against S. aureus, S. epidermidis, E. coli and K. pneumoniae. They concluded that the antimicrobial activity of Ag nanoparticles was greater than that of TiO2 nanoparticles. Pan et al.8 concluded that the Ag–TiO2 nanocomposite and Ag nanoparticles completely killed E. coli under visible light irradiation. The researchers also reported that the effect of an Ag-modified TiO2 nanocomposite on E. coli is nearly 5 times more potent than that of TiO2 and the durability of the Ag–TiO2 nanocomposite was extended further compared with Ag. Recently Gupta et al.9 prepared both Ag–TiO2 and TiO2 via acid catalyzed sol–gel method and tested their antimicrobial activity against S. aureus, P. aeruginosa and E. coli bacteria under visible light irradiation. It was concluded that the antimicrobial activity of the doped TiO2 is considerably higher than that un-doped TiO2 nanoparticles. For example, in the case of P. aeruginosa bacteria, they were completely killed by doped TiO2 nanoparticles with 7% Ag at 40 mg ml−1 culture, but for S. aureus and E. coli that amount is raised to 60 mg ml−1, while at 3% Ag doping the viability of all types of bacterial culture was decreased to zero at 80 mg/30 ml culture. Barudin et al.10 generated and tested the antibacterial activity of Ag–TiO2 nanoparticles, with different Ag concentrations, against E. coli bacteria under fluorescence light irradiation by using cotton diffusion test. The optimal antibacterial activity against E. coli was observed at 0.06 mol% Ag in Ag–TiO2 nanoparticles which they have 38 mm inhibition zone at 2.0 M concentration. With a proper ratio of Ag and TiO2 in the Ag–TiO2 nanoparticles, the compound nanoparticles are expected to have a stronger antibacterial activity in comparison with Ag and TiO2 nanoparticles, because in the compound nanoparticles can combine two factors to kill bacteria; the first one is the antibacterial activity of the Ag nanoparticles and the second one is the photocatalytic activity of the TiO2 nanoparticles.

In this work, the authors demonstrate the generation of Ag–TiO2 nano-compound particles by laser ablation of Ti/Ag bulk alloy in deionised water. Their antibacterial characteristics were investigated. The difference between this work from the previous works is the use of Ti/Ag alloy as a precursor to produce Ag–TiO2 nanoparticles for the first time. As a result the shifting optical absorption spectra was observed. In addition, the Ag–TiO2 nanoparticles, at much reduced Ag content compared with pure Ag, were found to be much better in their antibacterial capability than TiO2 nanoparticles and comparable with pure Ag nanoparticles, leading potentially reduced use of Ag.

2. Experimental set-up

2.1. Materials

A Ti/Ag bulk alloy plate with a ratio of 3[thin space (1/6-em)]:[thin space (1/6-em)]1 at%, supplied by Cathay Advanced Materials Limited, was used as the precursor material for the production of Ag–TiO2 compound nanoparticles. The purity of the Ag and Ti alloy components used in this work were 99.95% and 99.7% respectively. The size of the bulk alloy was 25 mm × 25 mm × 1 mm. For comparison with Ag–TiO2 nanoparticles, Ag nanoparticles were also generated from a pure Ag bulk plate with purity of 99.99% and the dimensions 25 mm × 25 mm × 2 mm. TiO2 nanoparticles were also produced for comparison. A pure Ti bulk plate with a purity of 99.99% and the dimensions of 25 mm × 25 mm × 1 mm were used. Chemically produced commercial Ag nanoparticles in sodium citrate as stabiliser (20 μg ml−1 concentration and about 35 nm average size) were acquired for comparison.

2.2. Ag–TiO2 compound nanoparticle production

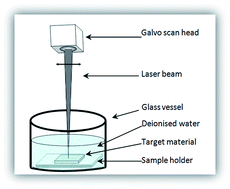
Ag–TiO2 nanoparticles were produced by placing the Ti/Ag alloy plate at the bottom of a 70 ml glass vessel, containing about 20 ml of deionised water. Picosecond laser ablation was used to generate nanoparticles in the water; this process lasted for 10 minutes. An Edgewave picosecond laser was used to produce the nanoparticles with the following parameters: wavelength λ = 1064 nm, frequency f = 200 kHz, laser power P = 9.12 W, pulse width τ = 10 ps, spot size D = 125 μm, scan speed v = 250 mm s−1, laser pulse energy Epulse = 45.6 μJ and laser fluence Flaser = 0.3717 J cm−2. The water level above the sample target was about 2 mm and its effects of reducing the laser beam intensity and increasing focal length were considered. The experimental setup is shown in Fig. 1. In addition, both the Ag and TiO2 nanoparticles were fabricated under the same experimental conditions and laser beam parameters for antibacterial activity comparison.
image file: c5ra16466d-f1.tif
Fig. 1 Experimental set-up for generation of nanoparticles in deionised water by picosecond laser.

2.3. Material characterisation

The bulk alloy was characterised by X-ray diffraction (XRD) and X-ray fluorescence (XRF). The Ag–TiO2 colloidal nanoparticles were characterised using a UV-VIS spectrometer (Analytic Jena, SPECORD 250, dual beam) and the nanoparticles were analysed using XRD ((BrukerD8-Discover) (step size [°2θ] = 0.0200)), Transmission Electron Microscopy (TEM) (JEOL 2000 FX AEM + EDX model), High-Angle Annular Dark-Field-Scanning Transmission Electron Microscopy (HAADF-STEM), X-ray Photoelectron Spectroscopy (XPS) and Energy-Dispersive X-ray Spectroscopy (EDS) (FEI Tecnai G2 F30). A copper micro-grid mesh was used for sample preparation for the TEM and HAADF-STEM analyses. After depositing a drop of colloidal nanoparticles onto the mesh, the substrate was allowed to dry at room temperature. This process was repeated several times to deposit sufficient amount of nanoparticles on the copper microgrid mesh. The sample used for the XPS analysis was prepared on an aluminum plate, by dropping the Ag–TiO2 colloidal nanoparticles onto it, followed by drying with a hair dryer. The sample used for the XRD analysis was prepared on a glass slide, by dropping the Ag–TiO2 colloidal nanoparticles onto it then drying at room temperature. A substantially larger amount of nanoparticles was required for this process. To obtain more nanoparticles, the colloidal nanoparticles were centrifuged for 15 minutes at 10[thin space (1/6-em)]000 rpm, then the deposition process onto the glass slide was repeated several times in a 2 cm × 2 cm area. A microbalance scale (Sartorius BL 210S, with readability d = 0.1 mg) was used to determine the concentration of the colloidal nanoparticles by weighing the bulk Ti/Ag alloy and Ag before and after the nanoparticle production process. The samples were dried using a hair dryer after the ablation process to record the weight of the ablated materials with greater accuracy. The zeta-potential of laser produced Ag, Ag–TiO2 compound nanoparticles and commercial Ag nanoparticles was measured using Zetasizer-Nano Series (Nano-ZS) Malvern Instruments to understand the stability and charge characteristics of the nano-particle (zeta-potential absolute value <30 mV indicates that the nanoparticle are unstable and can easily coagulate, a zeta-potential absolute value >40 mV indicates good stability).

2.4. Antibacterial activity analysis

E. coli bacteria (JM109 Promega UK) were used to test the antibacterial activity of the Ag–TiO2 compound nanoparticles. In addition, the antibacterial activity of laser generated Ag and TiO2 nanoparticles was tested for comparison. E. coli were cultured from a single colony in LB (Lysogeny Broth) broth overnight at 37 °C with 225 rpm shaking. Ag–TiO2 and Ag nanoparticles at a concentration 20 μg ml−1 were co-cultured with E. coli respectively in LB broth for 6 hours at 37 °C with 225 rpm shaking. 10 μl of the culture were plated on to a 10 cm LB agar Petri dish and incubated at room temperature for 48 hours. The numbers of bacteria colonies were then counted. The optical density of the cultured E. coli was measured at 600 nm (OD 600) and diluted down to a colony forming unit (CFU) ml−1 about 7.5 × 10⁴ to 10 × 104 with LB. The nanoparticles' antibacterial activities were tested under two conditions: under standard room light and in dark conditions. To achieve dark conditions the plates were wrapped with aluminium foil to prevent light reaching the specimens.

3. Results and discussion

3.1. Bulk Ti/Ag alloy characterisation

Before generation of the nanoparticles, the bulk Ti/Ag alloy plate was characterised.
3.1.1. Reflectivity of Ti/Ag alloy (bulk). Fig. 2 shows the reflectivity of the bulk Ti/Ag alloy. It is observed that the reflectivity of the bulk ally is increased slightly from visible light range to infrared wavelengths, indicating that the reflectivity is increased slowly with increasing wavelength. As shown in the figure, the reflectivity of the alloy at 1064 nm wavelength is 56%.
image file: c5ra16466d-f2.tif
Fig. 2 Reflectivity of the Ti/Ag alloy plate.
3.1.2. Phase analysis by X-ray diffraction. Fig. 3 shows the X-ray diffraction of the Ti/Ag alloy (bulk sample). As shown in the inset table, the sample consists of three compounds: α-Ti, AgTi3 and Ag syn. The peak positions 2θ = 40.93, 44.33, 46.95, 62.156, 74.46, 83.79 and 91.29 represents the alpha-titanium (α-Ti), while the peaks at 2θ = 34.83, 36.27, 50.46, 53.83, 57.82, 76.83, 95.68 and 98.17 indicate the existence of silver-titanium (AgTi3) and 2θ = 44.5, 51.83 and 93.19 represent the silver syn (Ag syn).
image file: c5ra16466d-f3.tif
Fig. 3 XRD of Ti/Ag alloy bulk sample.
3.1.3. X-ray florescence. Fig. 4 is an XRF image of the Ti/Ag alloy plate which confirms the existence of Ag and Ti elements in the alloy plate. The Ag shows the transitions of Lα, Lβ1 and Lβ2 and the Ti has Kα and Kβ transitions (Lα: transition from M shell to L shell, Lβ transition from N shell to L shell, Kα transition from L shell to K shell and Kβ transition from M shell to K shell). The intensity of the Ti is higher than the Ag because the atomic weight of Ti in the sample is higher than that of Ag in the alloy sample.
image file: c5ra16466d-f4.tif
Fig. 4 XRF of the Ag/Ti alloy.

The XRD pattern of the Ti/Ag alloy plate shows that the alloy consists of α-Ti, AgTi3 and Ag syn appears in the bulk. Further analysis using XRF reveals that the alloy consists of pure Ag and Ti materials. The intensity of the Ti is stronger than the Ag because the atomic ratio of the Ti is three times higher than Ag in the alloy sample. In this work, the sample used has 25% Ag and the remaining quantity is Ti, which consists of α-Ti, AgTi3 and Ag syn. The production of AgTi3 corresponds to the ratio of bulk sample Ag–Ti 1[thin space (1/6-em)]:[thin space (1/6-em)]3 at%. In summary, in pure bulk titanium and 5–20% Ag only α-Ti was observed, but at 22.5% and 25% Ag the alloy sample consists of both α-titanium and the intermetallic compounds Ti2Ag and Ti2Ag + TiAg.11 Consequently, the production of α-Ti, gives almost pure Ti material with the possibility of trace amounts of Ag material being found in the alloy.

3.2. Ag–TiO2 compound nanoparticles

Spherical Ag–TiO2 compound nanoparticles were generated by picosecond laser ablation (calibrated to λ = 1064 nm, f = 200 kHz, P = 9.12 W and v = 250 mm s−1) in deionised water. The UV-VIS spectrum measured for the as-prepared Ag–TiO2 compound nanoparticles (see Fig. 5a) show that the surface plasmon resonance of Ag is shifted to the longer visible light range of 500 nm, which begins at about 400 nm. The strong band appears in the UV range due to the addition of the strong band of Ti nanoparticles with their high ratio of Ti (75%) in the Ti/Ag alloy and the inter-band transition of the Ag nanoparticles at 200 and 250 nm.12 A high concentration of ablated nanoparticles in the solution leads to the production of the strong band or high intensity spectrum. Because TiO2 has an indirect band gap transition,13 the indirect transition energy band gap of the compound nanoparticles was measured, as shown in Fig. 5b. It can be noted that the forbidden energy band gap is reduced significantly from original TiO2 band gap (about 3 eV) to 2.35 eV. The reduction of the energy gap may be due to the extension of the absorption spectra to the visible light range.
image file: c5ra16466d-f5.tif
Fig. 5 The absorption spectra of the Ag–TiO2 compound nanoparticles produced by picosecond laser in deionised water (a). Indirect band gap energy of the Ag–TiO2 compound nanoparticles (b).

Fig. 6a–d show the TEM images of the Ag–TiO2 compound nanoparticles; their average size in diameter is 31 nm of 1354 measured particles. The figures exhibit different sizes of spherical nanoparticles. The TEM images show some small nanoparticles were attached to big nanoparticles, which have been combined together. The size distribution (shown in Fig. 6e) of the nanoparticles has lognormal probability distribution function fitting. The minimum and maximum sizes of the compound nanoparticles are 2 nm and 222 nm respectively. It can be seen that almost all nanoparticles are in the range of a few nanometers to 90 nm, and few of the particles were observed to be above 100 nm.


image file: c5ra16466d-f6.tif
Fig. 6 TEM images of the Ag–TiO2 compound nanoparticles generated by picosecond laser in deionised water (a–d). Histogram of the nanoparticles' lognormal size distribution (e). The ablation rate of the Ag–TiO2 nanoparticles is 0.1305 ± 0.029 mg min−1.

Fig. 7a–d shows the HAADF-STEM and EDS images of the Ag–TiO2 nanoparticles. In the electron image, three different points on the nanoparticles were selected and characterised. The nanoparticles were about 50 nm in diameter. Some small nanoparticles were also observed; their size ranged from 5 nm to 20 nm. As shown in Fig. 7, the weight ratio (wt%) Ag[thin space (1/6-em)]:[thin space (1/6-em)]Ti[thin space (1/6-em)]:[thin space (1/6-em)]O shown in Fig. 7a is 48.54[thin space (1/6-em)]:[thin space (1/6-em)]19.65[thin space (1/6-em)]:[thin space (1/6-em)]31.80 wt%, 8.45[thin space (1/6-em)]:[thin space (1/6-em)]41.88[thin space (1/6-em)]:[thin space (1/6-em)]49.67 wt% and 15.07[thin space (1/6-em)]:[thin space (1/6-em)]35.58[thin space (1/6-em)]:[thin space (1/6-em)]49.35 wt%, shown in Fig. 7b–d respectively, indicating that Ag is doped in TiO2.


image file: c5ra16466d-f7.tif
Fig. 7 (a–d) HAADF-STEM and EDS images of the Ag–TiO2 compound nanoparticles.

Fig. 8 shows the line profile spectrum and an EDS image of a nanoparticle. It can be seen that this nanoparticle is an Ag–TiO2 compound nanoparticle, in which the amount of Ag is higher than both the Ti and O. In Fig. 8a and b, some other elements were observed; the C and Cu peaks were observed owing to the formvar/carbon on 200 copper mesh which was used for the sample preparation for the EDS and TEM analysis. In addition, negligible amount of Si and S appear in the image, which is probably formed due to the glassware used for the nanoparticle production process and storage on colloidal nanoparticles.


image file: c5ra16466d-f8.tif
Fig. 8 Line profile spectrum (a) and EDS images (b) of the Ag–TiO2 compound nanoparticles.

Fig. 9 shows the atomic percentage (at%) ratio of Ag[thin space (1/6-em)]:[thin space (1/6-em)]Ti[thin space (1/6-em)]:[thin space (1/6-em)]O of a spectrum of 17 points (nanoparticles) counted by the EDS spectrum. The ratios of chemical elements are different; one group consists of Ti and O with a small amount of Ag, whereas in the second group Ag is predominant. Is spite of some of the nanoparticles having a balanced amount of the chemical elements, a few nanoparticles are pure TiO2 and completely free from Ag.


image file: c5ra16466d-f9.tif
Fig. 9 The atomic percentage (at%) ratio of Ag[thin space (1/6-em)]:[thin space (1/6-em)]Ti[thin space (1/6-em)]:[thin space (1/6-em)]O chemical elements of a spectrum of some of the nanoparticles (or points).

Fig. 10 shows the X-ray diffraction of the Ag–TiO2 compound nanoparticles. As shown in the inset table, the compounds of the nanoparticles are Ag and TiO2 with some silver oxides. The crystal phase of the TiO2 produced is rutile. The position peaks 2θ = 38.10, 44.41, 64.47 and 77.40 represent the Ag elements and the positions 2θ = 35.77, 41.20 and 54.40 represent the existence of rutile TiO2. In addition, the peak positions at 32.23 and 54.25 represent AgO.


image file: c5ra16466d-f10.tif
Fig. 10 XRD image of the Ag–TiO2 compound nanoparticles.

The absorption spectra of the colloidal Ag–TiO2 compound nanoparticles show the effect of the surface plasmon resonance (SPR) of the Ag from a wavelength of 400 nm to 500 nm. Shifting the spectra to a longer wavelength leads to a decrease in the transition energy band gap of the nanoparticles to 2.35 eV. These nanoparticles are expected to be effective with photocatalytic activities not only under UV light irradiation but also when exposed to visible light. This phenomenon had not been previously observed. Pure TiO2 nanoparticles have a higher energy band gap about 3, 3.13 and 3.21 eV from rutile to anatase.14 After doping with Ag nanoparticles it was reduced to 2.35 eV. This is may be due to the use of the Ag–TiO2 alloy as the precursor material which makes nanoparticles more combined than physically mixing Ag and TiO2 nanoparticles. As a result the optical absorption spectra shifted to longer wavelengths and the energy gap was reduced.

Fig. 11 shows the XPS analysis of the Ag–TiO2 compound nanoparticle. The results show that the Ag, Ti and O are three main elements in the sample. The Ag 3d spectrum (Fig. 11a) consists of two pairs of doublet peaks of Ag 3d3/2 and Ag 3d5/2. The two big peaks located at 368.14 eV and 374.16 eV represent silver metal (Ag0) and the two small peaks, located at 369.21 eV and 375.27 eV represent silver oxide (Ag2O).15 Pham and Lee16 indicated that the peaks (at 368.14 eV and 374.16 eV) represent the silver ions (Ag+) and the two peaks (at 369.21 eV and 375.27 eV) represent the silver metal (Ag0). In addition, Teng et al.17 indicated Ag0 peaks occur at 368.5 eV and 374.5 eV, and Ag+ peaks occur at 368.0 eV and 373.8 eV. The Ti 2P spectra (Fig. 11b) also consists of two peaks Ti 2p1/2 and Ti 2p3/2. Each of them can be fitted by two spectra. The peaks located at 458.92 eV and 464.66 eV represent Ti3+, and the peaks located at 460.69 eV and 466.41 eV, represent existence Ti4+.16,18,19 The location of the bare TiO2 of 3d3/2 level is at 458.5 eV,20 in this work Ag–TiO2 is shifted to higher binding energy at 458.75 eV at the same level. This indicates a strong interaction between Ag and TiO2 materials and confirms “a lower electron density of the TiO2 surface after Ag nanocrystals deposition”.20 Fig. 11c shows three wide asymmetric spectra of the O 1s at 530.36 eV, 532.19 and 533.71 eV. The spectra at 530.36 eV is due to the lattice oxygen of OTi–O and the other two spectra at 532.19 eV and 533.71 are due to the existence of O species such as hydroxyl groups (O–H) and water (H–O–H) molecules on the surface of the sample.21,22 Zhao et al.18 concluded the existence of lattice oxygen (OTi–O) at 530.1 eV and surface hydroxyl groups (OO–H) at 531.7 eV. In addition, Chu et al.22 indicated a hydroxyl species at 532.9 eV and Ramasamy et al.23 indicated adsorbed O2 at 533 ± 1 eV.


image file: c5ra16466d-f11.tif
Fig. 11 XPS images of the Ag–TiO2 compound nanoparticle. Peak-fitting spectra at high resolution of Ag 3d (a), Ti 2p spectra (b) and O 1s spectra (c) of the Ag–TiO2 compound nanoparticles.

Spherical Ag–TiO2 nanoparticles with different sizes and lognormal size distribution function were produced. The lognormal size distribution means that the nanoparticles are not uniformly distributed, as the uniform size distribution of nanoparticles usually has a Gaussian distribution form.

The EDS images show that some pure Ag and TiO2 nanoparticles were also observed because both Ag and Ti have different physical properties, such as melting point, reflectivity, work function, heat of evaporation and ablation threshold. Their different properties cause the elements to respond differently to the laser beam energy; as a result they release from the surface of the bulk with different kinetic energy.24 An irregular ratio (disproportionation of the compound nanoparticles) of Ag and Ti in the Ag–TiO2 compound nanoparticles (not as the ratio of 3[thin space (1/6-em)]:[thin space (1/6-em)]1 at% Ti/Ag alloy) was observed. The production of nearly pure Ag and TiO2 nanoparticles is due to the separation of ablated species of the elements in the plasma plume because of their different kinetic energies after ejection from the target. This process is due to their confinement in a liquid environment.24,25 The different kinetic energies of the ablated species of the elements are due to the different heats of evaporation, which leads to the production and ejection of one of the elements faster than the other.26 The heat of evaporations of Ag and Ti are 254 kJ mol−1 and 425 kJ mol−1, respectively. They have different heats of evaporation by a factor of 1.67, so more Ag should be produced and at a faster rate than the other component. This hypothesis corresponds with the results of the experiment, as more Ag was produced in the compound nanoparticles (see Fig. 9). Furthermore, laser ablation of the Ti/Ag alloy led to the production of larger TiO2 nanoparticles (above 100 nm) and smaller Ag nanoparticles (below 100 nm); this is due to the different heats of vaporization. The higher heat of vaporization of the Ti would generate bigger nanoparticles. Similar findings were observed for the brass alloy ablation process by laser, where large Cu nanoparticles than the Zn were produced which their heats of evaporation differed by a factor of 2.52.26 Moreover, laser ablation of the brass alloy, revealed that the ratio of Zn and Cu in the particles altered when their diameters were changed. Zn was predominant in the small particles, whereas Cu was predominant in the bigger particles.27 Their conclusions correlate with the results obtained in this study.

The XRD image shows that the rutile phase of TiO2 in the Ag–TiO2 nanoparticles was produced because the laser ablation process was accompanied by a high temperature within the plasma plume. This should be equal to or higher than the melting points of the target composites, which for Ag is 962 °C and is 1668 °C for Ti.28 So the plasma plume temperature reaches 6000 K.29 These high temperatures bring about a rutile phase (this will be produced when the substrate temperature rises above 600 °C (ref. 30)), while the anatase phase occurs at lower temperatures (around 300 °C).31 It is worth mentioning that mixed anatase-rutile phases of TiO2 were produced at high temperatures (around 800 °C).32 A low temperature nanoparticle production process is required for the anatase phases of TiO2 to occur, such as in the sol–gel method.33 In spite of the fact that rutile is more thermodynamically stable than the other two phases of titania,34 Nasr-Esfahani and Habibi35 reported that the photocatalytic activity of anatase is more effective than rutile due to its larger transition band gap energy which causes a delay in the electron–hole recombination (or an increase in the charge carrier lifetime) and an increase in the surface redox potential.35 On the contrary, Li et al.36,37 showed that an amorphous TiO2 nanocolumn array has better photocatalytic activity than an anatase nanocolumn array because amorphous structure has large surface area and special microstructures. In addition, the nanoparticles showed excellent superhydrophilicity with zero contact angle, for self-cleaning surfaces.36,37 It is worth noting that the production of rutile TiO2 nanoparticles in this work is due to the high amount of Ag in the Ag–TiO2 nanoparticles, as Cao et al.38 showed that doping TiO2 nanoparticles with greater quantities of Ag leads to the production of a more extended rutile phase of titania.

In highly absorbent materials, for ultra-short pulses, the ablation mechanism is governed by spallation, vaporisation, phase explosion or fragmentation. For longer pulses the ablation is due to trivial fragmentation and vaporisation.39 In addition, an increase in laser fluence or exposure time would change the morphology of nanoparticles from octahedron to spherical shape.40

3.3. Sedimentation and zeta-potentials of nanoparticles

Fig. 12a and b show the sedimentation of the Ag–TiO2 compound and pure Ag nanoparticles after 15 and 30 days. On the day of preparation, some nanoparticles were extracted from the center of the bottle of colloidal nanoparticles (see Fig. 12d). Then their sizes were measured using a TEM. The bottles were left for 15 days. Then some of the colloidal nanoparticles were extracted from the middle of the bottle. The extraction process was repeated after 30 days. The results show that heavier (larger) nanoparticles were deposited at the bottom of the bottles and the small nanoparticles were suspended in the middle. As shown in Fig. 12c, the average sizes of the Ag–TiO2 nanoparticles were reduced from 47 nm to 29 and 14 nm after 15 and 30 days respectively. Moreover, the average sizes of the Ag nanoparticles decreased from 38 nm to 28 and 26 nm respectively. The figures confirm that more small nanoparticles were observed after 30 days; this indicates that the larger particles were sinking to the bottom of the bottle.
image file: c5ra16466d-f12.tif
Fig. 12 Sedimentation of Ag–TiO2 compound nanoparticles (a), and Ag nanoparticles (b) during time. (c) The average sizes of the nanoparticles as a function of time. The photographs show the bottles which contain the colloidal nanoparticles.

Fig. 13 shows the absorption spectra of the colloidal pure Ag and Ag–TiO2 compound nanoparticles on the day of preparation and after 15 and 30 days. The size distribution of the single nanoparticles (Ag nanoparticles) is more uniform than that of the compound nanoparticles (Ag–TiO2), but the average size of the compound nanoparticles after 30 days is smaller than the pure Ag nanoparticles. It can be seen from the images of the bottles that the colour of the colloidal nanoparticles became lighter and lighter after 15 and 30 days, as the concentration of the suspension decreased.


image file: c5ra16466d-f13.tif
Fig. 13 The absorption spectra of Ag (a) and Ag–TiO2 (b) nanoparticles on the day of preparation as well as after 15 and 30 days.

The zeta-potentials of laser generated Ag, Ag–TiO2 compound nanoparticles and commercial Ag nanoparticles were measured at 25 °C using Zetasizer-Nano Series (Nano-ZS) Malvern Instruments. The results show that the laser generated Ag nanoparticles have zeta-potentials of about −42.3 mV (zeta deviation = 7.65 mV), commercial (chemically produced) Ag nanoparticles have zeta-potentials of about −43.5 mV (zeta deviation = 5.93 mV) and the laser produced Ag–TiO2 nanoparticles have zeta-potentials of about −40.7 mV (zeta deviation = 8.88 mV). According to these results, pure Ag nanoparticles are slightly more stable than the Ag–TiO2 composite nanoparticles.

A balance between the van der Waals and Coulomb repulsion are responsible for the stability of particles. Rapid coagulation of the colloidal suspension can be achieved by improving the van der Waals attraction force. As a result, more charged particles will be induced due to the oxidative state of the liquid medium and the particles will be coagulated.41 The sizes of the Ag nanoparticles on the day of generation were between 4 and 200 nm; however, after 15 days of preparation these ranged from 5 to 10 nm.42 Precipitation of nanoparticles in solutions is related to the type of solution and the size of the nanoparticles; for example, producing nanoparticles in acetone (with a mean size 5 nm) is better than conducting the process in both deionised water (a mean size of 13 nm) and ethanol (a mean size of 22 nm) because the colloidal Ag nanoparticles precipitated after about two weeks and 48 hours in both deionised water and ethanol respectively.43 So bigger nanoparticles had more probability to sink in the solution due to the greater effect of gravitational force on the bigger particles (F = mg). Nishi et al. (2011)44 prepared a high concentration solution with small silver nanoparticles (20 mg h−1 and 2 nm) in deionised water using laser ablation. The nanoparticles was stable for more than 6 months,44 indicating that the concentration of nanoparticles in a solution has an effect on the rate of precipitation. Stable silver nanoparticles (about 5 nm) were prepared in citrate as a stabiliser for one year.45 The sedimentation and aggregation of silver nanoparticles is probably the fundamental cause of the changing the optical and non-linear optical properties of the nanoparticles.25

An important property which influences nanoparticle stability is zeta-potential. Some researchers investigated nanoparticle stability in terms of this.46 Nanoparticles with higher zeta-potentials are more stable than those with lower zeta-potentials, because high value zeta-potential causes the nanoparticles to repel each other, preventing agglomeration and accumulation. For example, the zeta-potential of TiO2 nanoparticles produced by pulsed laser ablation in an SDS solution is between −49.5 mV and −51.8 mV, creating stable nanoparticles with a very small agglomeration.47 In order to produce stable nanoparticles their zeta-potential should be greater in absolute value than ±30 mV.48 The main requirement to produce stable colloidal nanoparticles is the use of a surface-stabilizing agent.49 In the present work, the results show that the laser generated Ag nanoparticles are slightly more stable than the laser produced Ag–TiO2 compound nanoparticles. Although, the commercial Ag nanoparticles are slightly more stable than the laser produced Ag and Ag–TiO2 compound nanoparticles. In this work, in spite of high zeta-potential of the nanoparticles, the larger nanoparticles were sedimented after 15 and 30 days. It may be because the gravitational force is more predominant for the larger nanoparticles than the zeta-potential. The mean hydrodynamic diameter of the nanoparticles is an important factor to obtain colloidal stable nanoparticles.50 In addition, the zeta-potential may be decreased due to increase the PH of the solution.51 Furthermore, dispersions with a low zeta-potential will be aggregated due to van der Waal inter-particle attractions.

Our results correspond to the above analysis, because, as shown in Fig. 13a and b, the rate of sedimentation of Ag–TiO2 nanoparticles is higher than that of pure silver nanoparticles. This is more apparent after 30 days' sedimentation of the nanoparticles in the deionised water.

3.4. Antibacterial activity

Fig. 14 shows the antibacterial activity of both pure Ag nanoparticles and Ag–TiO2 compound nanoparticles compared with the control sample (water). The tests were carried out under normal room light and in dark conditions for comparison. The antibacterial activity of the nanoparticles was tested after one day of preparation. The concentration of both types of nanoparticles was 20 and 25 μg ml−1. After 6 hours' incubation, the E. coli bacteria were killed by nanoparticles, not only under normal light exposure but also in dark conditions. Fig. 18 shows the comparison with the control test.
image file: c5ra16466d-f14.tif
Fig. 14 Antibacterial activity of the Ag and Ag–TiO2 compound nanoparticles at 20 μg ml−1 (a) and 25 μg ml−1 (b) compared with control sample (c) under standard room light and dark conditions after one day of generation.

Fig. 15 shows the effect of incubation time on the bacteria growth in laser generated Ag and Ag–TiO2 NPs and in the controlled samples. As the incubation time for growing bacteria increased, the number of bacteria increased in the controlled sample. However, the E. coli bacteria could not grow in either the Ag–TiO2 or Ag nanoparticle solutions. Growth of some bacteria was observed during the first few hours.


image file: c5ra16466d-f15.tif
Fig. 15 Number of survived E. coli colonies as a function of incubation time for Ag–TiO2, Ag and control under standard room light. The concentration of nanoparticles was 20 μg ml−1.

Fig. 16 shows the relationship between the concentrations of Ag–TiO2 compound and pure Ag nanoparticles with the number of survived E. coli bacteria. As shown in the figure, the increase in the nanoparticle concentration leads to more bacteria being killed. The ability of the Ag–TiO2 compound nanoparticles was not as good as the pure Ag nanoparticles at low concentrations, but their efficiency became more similar at higher concentrations. At a concentration of 20 μg ml−1, the E. coli were eliminated to almost 0% by the silver nanoparticles, although some live bacteria were still observed on the Ag–TiO2 agar plate but at 25 μg ml−1 concentration the E. coli bacteria were eliminated completely for both types of nanoparticles.


image file: c5ra16466d-f16.tif
Fig. 16 Antibacterial activity of Ag–TiO2 compound and Ag nanoparticles as a function of concentration.

Fig. 17 show the antibacterial activity of pure TiO2 nanoparticles against E. coli bacteria under both light and dark conditions. The nanoparticles produced by picosecond laser with the same laser and experimental conditions which were used to produce Ag and Ag–TiO2 compound nanoparticles. In addition the same concentration was used to antibacterial activity test. It can be seen that TiO2 nanoparticles could not kill bacteria in either cases, although both Ag and Ag–TiO2 nanoparticles eliminated almost all cultured bacteria on the agar plate, Fig. 17b shows the comparison between them under standard room light.


image file: c5ra16466d-f17.tif
Fig. 17 (a) Agar plate shows antibacterial activity of TiO2 nanoparticles (20 μg ml−1) against E. coli bacteria under both standard room light and dark conditions. (b) Antibacterial activity of laser generated Ag, Ag–TiO2 and TiO2 nanoparticles under standard room light at the same concentration (20 μg ml−1) and incubation time (6 hours).

Fig. 18 shows the antibacterial activity of chemically produced commercial Ag nanoparticles in sodium citrate (20 μg ml−1 concentration) against E. coli bacteria under both standard laboratory light and dark conditions. It can be seen that commercial Ag nanoparticles could not kill bacteria in either conditions even their size are about 35 nm in diameter.


image file: c5ra16466d-f18.tif
Fig. 18 Agar plate shows antibacterial activity of chemically produced commercial Ag nanoparticles in sodium citrate (20 μg ml−1 concentration and about 35 nm size in diameter) against E. coli bacteria under both standard laboratory light and dark conditions. It was tested about two months after their production.

Several properties of nanomaterials impact their antibacterial activity, such as their type, amount, size, shape and stability. Herein, the authors used Ag–TiO2 nanoparticles to kill E. coli bacteria because Ag has strong antimicrobial activity7 and TiO2 has photocatalytic activity52 and can be used as an antimicrobial operator due to its high oxidation potential and superhydrophilicity.53 The main purpose of using Ag–TiO2 nanoparticles is to combine the antibacterial activity of Ag and photocatalytic activity of TiO2 (ref. 54) in the Ag–TiO2 nanoparticles which have a synergistic antimicrobial activity unconcerned by the effects of photoactivity and which have stronger antibacterial activity than both pure Ag and TiO2 nanoparticles,55 and a smaller energy band gap than pure TiO2.9

In general, because the antibacterial activity of the nanoparticles depended on the concentration of nanoparticles used (which can be referred as a “concentration-dependent manner”),56 the antibacterial activity of the nanoparticles against the E. coli bacteria increased as the concentration increased, because at higher concentrations the number of nanoparticles in the solution rose. As a result, the probability of the nanoparticles coming into contact with the E. coli bacteria increased. When the Ag–TiO2 nanoparticles make contact with the bacteria, the nanoparticles penetrate the membrane of the bacteria after interacting with the functional group of the microbe, such as –SH, –COOH, and –OH, found in the cell membrane.57 The inactivation of both the cell protein and its DNA lead to the death of the bacteria,8 especially the Ag nanosize particles, which react strongly with proteins.58 The antibacterial activity of the Ag and Ag–TiO2 nanoparticles against the E. coli bacteria can be explained on the basis of a physical phenomenon; the Ag nanoparticles release Ag+,59 or positively charged ions, and metal oxides such as TiO2 carry a positive charge.60 On the other hand, E. coli is a Gram-negative bacteria and carries negative charges; as a result, attraction forces between the nanoparticles and the microorganism will be produced60 which leads to contacts between them. This is the first step of the antibacterial activity of the nanoparticles. The SEM and STEM images showed that the production of “pits” on the cell membrane of the E. coli after contact with Ag nanoparticles leads to the death of the bacteria.61 This is different for Gram-positive and Gram-negative bacteria because they have different membrane structures, particularly with regard to the thickness of the peptidoglycan layer,56 in that Gram-negative bacteria have a thinner peptidoglycan cell membrane than Gram-positive bacteria.62

4. Conclusions

Ag–TiO2 compound nanoparticles were fabricated using a picosecond laser on the surface of the cast Ti/Ag alloy target in deionised water.

- The XRD image shows that the phase of the TiO2 nanoparticles in the compound nanoparticles is rutile.

- Spherical nanoparticles, ranging from a few nanometers to about 90 nm in size, were produced, in addition to a few larger nanoparticles. The average size of the nanoparticles was 31 nm.

- The red shift phenomenon was observed in the absorption spectra of the colloidal Ag–TiO2 compound nanoparticles, so the spectrum was shifted to a longer wavelength of about 500 nm.

- The compound nanoparticles demonstrated strong antibacterial activity against E. coli bacteria, but it was found to be slightly lower than for the pure Ag nanoparticles.

- The efficacy of the antibacterial activity of the nanoparticles was found to be strongly concentration-dependent.

- Optimal antibacterial activity of the Ag–TiO2 compound nanoparticles can be obtained by controlling the correct amount of release of the Ag ions from the Ag–TiO2 nanoparticles.

References

  1. F. T. Corina Coman, I. Ilie, C. Matea, C. Iancu, L. Mocan and T. Mocan, Biotechnol., Mol. Biol. Nanomed., 2013, 1, 5 Search PubMed.
  2. R. Foldbjerg, D. A. Dang and H. Autrup, Arch. Toxicol., 2011, 85, 743–750 CrossRef CAS PubMed.
  3. B. Sha, W. Gao, S. Wang, F. Xu and T. Lu, Composites, Part B, 2011, 42, 2136–2144 CrossRef.
  4. I. Lee, S. W. Han and K. Kim, Chem. Commun., 2001, 1782–1783 RSC.
  5. R. Kuladeep, L. Jyothi, K. S. Alee, K. Deepak and D. N. Rao, Opt. Mater. Express, 2012, 2, 161–172 CrossRef CAS.
  6. S. Grade, J. Eberhard, J. Jakobi, C. Rehbock, A. Winkel, S. Barcikowski and M. Stiesch, BioNanoMaterials, 2013, 14, 1 Search PubMed.
  7. P. Ramesh, S. Muthukkumarasamy, K. Dhanabalan, T. Sadhasivam and K. Gurunathan, Digest Journal of Nanomaterials and Biostructures, 2012, 7, 8 Search PubMed.
  8. X. Pan, I. Medina-Ramirez, R. Mernaugh and J. Liu, Colloids Surf., B, 2010, 77, 82–89 CrossRef CAS PubMed.
  9. K. Gupta, R. Singh, A. Pandey and A. Pandey, Beilstein J. Nanotechnol., 2013, 4, 345–351 CrossRef PubMed.
  10. N. Barudin, S. Sreekantan, O. M. Thong and G. Sahgal, Mater. Sci. Forum, 2013, 756, 238–245 CrossRef.
  11. M. Watanabe and O. Osamu, Interface Oral Health Science 2007, Springer, 2007 Search PubMed.
  12. T. Tsuji, K. Iryo, N. Watanabe and M. Tsuji, Appl. Surf. Sci., 2002, 202, 80–85 CrossRef CAS.
  13. F. Tian, J. Sun, J. Yang, P. Wu, H.-L. Wang and X.-W. Du, Mater. Lett., 2009, 63, 2384–2386 CrossRef CAS PubMed.
  14. D. Reyes-Coronado, G. Rodriguez-Gattorno, M. Espinosa-Pesqueira, C. Cab, R. de Coss and G. Oskam, Nanotechnology, 2008, 19, 145605 CrossRef CAS PubMed.
  15. W. Liang, T. L. Church and A. T. Harris, Green Chem., 2012, 14, 968–975 RSC.
  16. T.-D. Pham and B.-K. Lee, Int. J. Environ. Res. Public Health, 2014, 11, 3271–3288 CrossRef CAS PubMed.
  17. W. Teng, X. Li, Q. Zhao and G. Chen, J. Mater. Chem. A, 2013, 1, 9060–9068 CAS.
  18. Z. Zhao, Y. Wang, J. Xu and Y. Wang, RSC Adv., 2015, 5, 59297–59305 RSC.
  19. S. Wang, H. Qian, Y. Hu, W. Dai, Y. Zhong, J. Chen and X. Hu, Dalton Trans., 2013, 1122–1128 RSC.
  20. C. Su, L. Liu, M. Zhang, Y. Zhang and C. Shao, CrystEngComm, 2012, 14, 3989–3999 RSC.
  21. S. S. Thind, G. Wu, M. Tian and A. Chen, Nanotechnology, 2012, 23, 475706 CrossRef PubMed.
  22. D. Chu, A. Younis and S. Li, J. Phys. D: Appl. Phys., 2012, 45, 355306 CrossRef.
  23. P. Ramasamy, D.-M. Seo, S.-H. Kim and J. Kim, J. Mater. Chem., 2012, 22, 11651–11657 RSC.
  24. H.-J. Dang, Y.-X. Tang and Q.-Z. Qin, Appl. Surf. Sci., 1998, 136, 206–212 CrossRef CAS.
  25. J. Jakobi, A. Menéndez-Manjón, V. S. K. Chakravadhanula, L. Kienle, P. Wagener and S. Barcikowski, Nanotechnology, 2011, 22, 145601 CrossRef PubMed.
  26. H.-R. Kuhn and D. Günther, Anal. Chem., 2003, 75, 747–753 CrossRef CAS.
  27. C. Liu, X. Mao, S. S. Mao, R. Greif and R. E. Russo, Anal. Chem., 2005, 77, 6687–6691 CrossRef CAS PubMed.
  28. V. Osterman and A. Harry Jr, Critical Melting Points and Reference Data for Vacuum Heat Treating, Solar Atmospheres Inc., 2010 Search PubMed.
  29. H. Zeng, W. Cai, Y. Li, J. Hu and P. Liu, J. Phys. Chem. B, 2005, 109, 18260–18266 CrossRef CAS PubMed.
  30. S. I. Shah, C. Huang, J. Chen, D. Doren and M. Barteau, Nanoscale Science and Engineering Grantees Conference, Grant No, 0210284, 2003 Search PubMed.
  31. C. Bhakat, P. P. A. L. Singh and D. Bhakat, Int. J. Eng. Sci., 2012, 4, 3081 Search PubMed.
  32. Y. Djaoued, S. Badilescu, P. Ashrit, D. Bersani, P. Lottici and R. Brüning, J. Sol-Gel Sci. Technol., 2002, 24, 247–254 CrossRef CAS.
  33. S. Shahini, M. Askari and S. Sadrnezhaad, Bull. Mater. Sci., 2011, 34, 1189–1195 CrossRef CAS.
  34. R. Chauhan, A. Kumar and R. Chaudhary, Res. Chem. Intermed., 2012, 38, 1443–1453 CrossRef CAS.
  35. M. Nasr-Esfahani and M. H. Habibi, Int. J. Photoenergy, 2008, 2008, 11 CrossRef PubMed.
  36. Y. Li, T. Sasaki, Y. Shimizu and N. Koshizaki, Small, 2008, 4, 2286–2291 CrossRef CAS PubMed.
  37. Y. Li, T. Sasaki, Y. Shimizu and N. Koshizaki, J. Am. Chem. Soc., 2008, 130, 14755–14762 CrossRef CAS PubMed.
  38. Y. Cao, H. Tan, T. Shi, T. Tang and J. Li, J. Chem. Technol. Biotechnol., 2008, 83, 546–552 CrossRef CAS PubMed.
  39. L. J. Lewis and D. Perez, Appl. Surf. Sci., 2009, 255, 5101–5106 CrossRef CAS PubMed.
  40. D. Liu, C. Li, F. Zhou, T. Zhang, H. Zhang, X. Li, G. Duan, W. Cai and Y. Li, Sci. Rep., 2015, 5 Search PubMed.
  41. D. Kil, Y. Suh, H. Jang, J. Lee, C. Song and W. Kim, Mater. Trans., 2005, 46, 2509–2513 CrossRef CAS.
  42. R. A. Ganeev, M. Baba, A. I. Ryasnyansky, M. Suzuki and H. Kuroda, Opt. Commun., 2004, 240, 437–448 CrossRef CAS PubMed.
  43. R. Tilaki and S. Mahdavi, Appl. Phys. A, 2006, 84, 215–219 CrossRef CAS.
  44. T. Nishi, N. Suzuki, H. Sugiyama, K. Yano and H. Azuma, J. Photochem. Photobiol., A, 2011, 226, 64–67 CrossRef CAS PubMed.
  45. V. V. Pinto, M. J. Ferreira, R. Silva, H. A. Santos, F. Silva and C. M. Pereira, Colloids Surf., A, 2010, 364, 19–25 CrossRef CAS PubMed.
  46. C. Z. Zhang Hu, J. Mater. Environ. Sci., 2014, 5, 6 Search PubMed.
  47. S. I. Alnassar, E. Akman, B. G. Oztoprak, E. Kacar, O. Gundogdu, A. Khaleel and A. Demir, Opt. Laser Technol., 2013, 51, 17–23 CrossRef CAS PubMed.
  48. C. Jacobs and R. H. Müller, Pharm. Res., 2002, 19, 189–194 CrossRef CAS.
  49. T. Prathna, N. Chandrasekaran and A. Mukherjee, Colloids Surf., A, 2011, 390, 216–224 CrossRef CAS PubMed.
  50. M. G. Carneiro-da-Cunha, M. A. Cerqueira, B. W. Souza, J. A. Teixeira and A. A. Vicente, Carbohydr. Polym., 2011, 85, 522–528 CrossRef CAS PubMed.
  51. J. M. Berg, A. Romoser, N. Banerjee, R. Zebda and C. M. Sayes, Nanotoxicology, 2009, 3, 276–283 CrossRef CAS.
  52. Q. Zhang, C. Sun, Y. Zhao, S. Zhou, X. Hu and P. Chen, Environ. Sci. Technol., 2010, 44, 8270–8275 CrossRef CAS PubMed.
  53. A. Zaleska, Recent Pat. Eng., 2008, 2, 157–164 CrossRef CAS.
  54. J. Mungkalasiri, L. Bedel, F. Emieux, J. Doré, F. N. R. Renaud, C. Sarantopoulos and F. Maury, Chem. Vap. Deposition, 2010, 16, 35–41 CrossRef CAS PubMed.
  55. M. Li, M. E. Noriega-Trevino, N. Nino-Martinez, C. Marambio-Jones, J. Wang, R. Damoiseaux, F. Ruiz and E. M. Hoek, Environ. Sci. Technol., 2011, 45, 8989–8995 CrossRef CAS PubMed.
  56. J. S. Kim, E. Kuk, K. N. Yu, J.-H. Kim, S. J. Park, H. J. Lee, S. H. Kim, Y. K. Park, Y. H. Park, C.-Y. Hwang, Y.-K. Kim, Y.-S. Lee, D. H. Jeong and M.-H. Cho, Nanomedicine: Nanotechnology, Biology and Medicine, 2007, 3, 95–101 CrossRef CAS PubMed.
  57. J. Kim, I. Cho, I. Kim, C. Kim, N. H. Heo and S. Suh, Rev. Roum. Chim., 2006, 51, 1121 CAS.
  58. P. J. Subhranshu Sekhar Samal and V. Vishwakarma, J. Miner. Mater. Charact. Eng., 2010, 9, 6 Search PubMed.
  59. J. Dobias and R. Bernier-Latmani, Environ. Sci. Technol., 2013, 47, 4140–4146 CrossRef CAS PubMed.
  60. M. Haghi, M. Hekmatafshar, M. B. Janipour, S. S. gholizadeh, M. K. Faraz, F. Sayyadifar and M. Ghaedi, Int. J. Adv. Biotechnol. Res., 2012, 3, 4 Search PubMed.
  61. I. Sondi and B. Salopek-Sondi, J. Colloid Interface Sci., 2004, 275, 177–182 CrossRef CAS PubMed.
  62. M. Rai, A. Yadav and A. Gade, Biotechnol. Adv., 2009, 27, 76–83 CrossRef CAS PubMed.

This journal is © The Royal Society of Chemistry 2015