 Open Access Article
Catanionic vesicles and DNA complexes: a strategy towards novel gene delivery systems†
C.
Pucci
*a,
A.
Scipioni
a,
M.
Diociaiuti
b,
C.
La Mesa
a,
L.
Pérez
c and
R.
Pons
*c
aDept. of Chemistry, La Sapienza University, P.le A. Moro 5, I-00185, Rome, Italy. E-mail: carlotta.pucci@uniroma1.it
bDip. di Tecnologie e Salute, Istituto Superiore di Sanità, Viale R. Elena 299, I-00185 Rome, Italy
cInstitut Química Avançada de Catalunya, IQAC-CSIC, Jordi Girona 18-26, 08034 Barcelona, Spain. E-mail: ramon.pons@iqac.csic.es
First published on 18th September 2015
Abstract
Catanionic vesicles are appealing vectors in non-viral gene transfection. They possess high kinetic stability and the preparation procedures are easy and cheap. In addition, their size and charge are easily modulated by varying the mole ratio between the components. For these reasons, we investigated the interactions between positively charged catanionic vesicles made of didecyldimethylammonium bromide (DiDAB) and 8-hexadecyl sulfate (8-SHS) with calf thymus DNA. Strongly associating complexes are obtained and their structure depends on DNA content. At low concentration, DNA/vesicles complexes are stable, with features very similar to bare vesicles. In the presence of DNA, multi-lamellar entities are formed; the process is promoted by the aggregation and rearrangement of DNA/vesicle complexes. Surface adsorption onto vesicles increases in proportion to DNA content. In such conditions, ζ-potential abruptly decreases, because of the formation of large clusters in which the vesicular identity is retained. Thereafter, precipitation occurs. The solid obtained accordingly is a lamellar phase with DNA sandwiched between the lamellae. The 1D distance between DNA molecules in the lamellar phase and the precipitate composition depend on the biopolymer content. The double helix of DNA undergoes a reversible compaction process that favors penetration into cells and protects it from nucleases degradation. Finally, addition of the anionic surfactant to the complexes favors DNA release, allowing for a specific signal controlled release.
Introduction
Gene transfection allows determining the mechanisms of gene expression, but it can be also used for therapeutic applications. Nucleic acid penetration through cellular membranes is not an easy task,1–3 and needs to be mediated by proper vectors. The most efficient transfectors are based on adeno- or retro-viruses. However, both carry small gene fragments and cause strong immune responses. For these reasons, research has focused on non-viral vectors, among which liposomes are the most promising. Conventional liposomes consist of phospholipids, or cationic lipids in mixtures with helper neutral ones. These components are expensive and they can be chemically and/or biologically unstable.4 Moreover, liposomes do not form spontaneously, and their storage time is limited.5In the 90's, Kaler et al.6 described the spontaneous formation of vesicles obtained by mixing two oppositely charged surfactants in non-stoichiometric ratios. The resulting catanionic vesicles, CVs, are of potential interest as non-viral gene carriers, since the related preparation procedures are simple and cheap. In addition, CVs own high kinetic stability and lower cytotoxicity compared to the individual components.7 Their size and charge can be modulated varying the mole ratio between the two surfactants.8 The latter aspect is intriguing, since vesicles size and charge are key parameters in gene delivery and play an important role in the interactions with biomacromolecules, such as DNA.9 Recently, it was demonstrated that CVs made of sodium dodecylsulfate (SDS) and cetyltrimethylammonium bromide (CTAB) transfect exogenous DNA.10 This fact strongly encourages widening studies along this direction.
The characterization of the complexes formed upon DNA/catanionic vesicles interactions is a crucial point. In fact, DNA delivery, internalization pathways, intracellular localization and release depend on its supramolecular arrangement in the complexes. This point is not yet clear, in spite of many previous studies in the field.11 Catanionic systems, in fact, self-organize in peculiar ways, and their characterization is mandatory before applications are at hand.
In this work, we investigated the interactions between calf thymus DNA and catanionic vesicles made of didecyldimethylammonium bromide (DiDAB) and 8-hexadecylsulfate (8-SHS). The phase behaviour of the aqueous mixtures composed by these surfactants has been previously reported.12 Stable vesicles do form in a wide region of the phase diagram. Their stability is slightly affected by temperature and salt concentration. Moreover, DiDAB and 8-SHS are chemically and biologically stable. In fact, in contrast to other few reports on pseudo-tetraalkyl catanionic mixtures, both surfactants contain simple polar heads, avoiding the influence of ionisable groups. Lastly, vesicles composed by pseudo-tetralkyl species own a packed and dense bilayer that reduces their in vivo damage caused by the attack of lipoproteins present in serum.13,14 Therefore, the above mixtures fulfill most requirements for an efficient delivery. We chose the optimal composition and mole ratio required to get positively charged vesicles. The morphology and surface charge density of the complexes were studied at different DNA concentrations by dynamic light scattering, small angle X-ray scattering, electrophoretic mobility, TEM and elemental analysis. DNA conformational transitions upon interactions with vesicles were investigated by circular dichroism (CD) spectroscopy. Finally, we checked DNA release by adding 8-SHS to preformed DNA/surfactants complexes.
Materials
Didecyldimethylammonium bromide (98%) from Sigma Aldrich was used as received. Sodium 8-hexadecylsulfate was synthesized by sulfonation of 8-hexadecanol with chlorosulfonic acid in acetic acid.15 The resulting sulfonic acid was neutralized by sodium bicarbonate. The purity of the final product was checked by 1H, 13C NMR and elemental analysis; it resulted to be above 99%.12 Water was bi-distilled using a Milli-Q four-bowl system. The phase behaviour of the two surfactants has been investigated previously.12The sodium salt of calf thymus DNA (Type I, fibres) was from Sigma Aldrich. Its nominal molecular mass is 10–15 MDa. It was dissolved in water and sonicated for 5 minutes to get a homogenous distribution of fragments. The DNA hydrodynamic diameter in water after sonication is reported in Fig. S1.† Absence of proteins or other impurities was verified by checking that the absorbance ratio at 260 and 280 nm is always in the range 1.7–1.9.
Solutions of the two surfactants were prepared individually by weighing appropriate amount of the compounds and diluting them with water. Catanionic vesicles were formed by mixing the above solutions, having exactly the same molality (CTOT,surfactant overall surfactant content of 2.5 mmol kg−1) at a [DiDAB]/[8-SHS] mole ratio = 4. The latter composition has the best combination for small size and polydispersity and suitable surface charge density.12
DNA/vesicle complexes were obtained by adding known amounts of aqueous DNA to the vesicular dispersions. When required, mild centrifugation allowed characterizing the supernatant and the precipitate separately. DNA concentration, expressed in moles of phosphate groups, was evaluated by absorption spectroscopy at λ = 260 nm. Data are reported as a function of the charge ratio R = [PO4−]/[DiDA+]. The surfactant concentration is kept constant, while that of the nucleotide changes. R parameter allows comparing results from different systems, but cannot be used for quantitative purposes. We do not account for the surfactant distribution between the two vesicle leaflets. Presumably, only surfactants located on the outer vesicle surface contribute to its charge. No counter-ion condensation on DNA is assumed. Probably, concentration of negative charges is lower than the nominal one.
Methods
Dynamic light scattering (DLS)
Measurements were run using a Malvern Zetasizer unit, Nano ZS series HT, working at λ = 638.2 nm in back-scattering mode (at 173°), at 25.0 ± 0.1 °C. A digital correlator analyzes the scattered light intensity fluctuations, I(q,t), due to the Brownian motion of the dispersed particles, at times t and (t + τ)sτ is the delay time, obtained by the intensity autocorrelation function G2(q,t), and q is the scattering vector. G2(q,t) is related to the electromagnetic field autocorrelation function g1(q,t). The function g1(q,t) is expanded in a cumulant analysis,16 where the first term provides the diffusion coefficient, D, related to the hydrodynamic radius RH of the particles through the Stokes–Einstein equation. The second cumulant is proportional to the polydispersity index, PdI.ζ-Potential
Electrophoretic mobility measurements, μ, were run at 25.0 ± 0.1 °C using a Laser-Doppler facility available in the DLS equipment. The dispersions were placed into U-shaped cuvettes, equipped with gold electrodes. The ζ-potential, ζ, is related to μ by the relation17 | (1) |
Absorption spectroscopy
Absorption spectra were collected on a Jasco V-550 or a Varian Cary 300 spectrophotometer, at 25.0 °C. Quartz cells of suitable path length were used. Cnucleotide was determined from the absorbance at 260 nm, knowing that the extinction coefficient per base pair is 6600 M−1 cm−1. Cnucleotide refers to the total amount of DNA. In fact absorption spectra cannot discriminate between free or bound DNA. Data normalization allows determining the concentration in the precipitate.Small angle X-ray scattering (SAXS)
X-ray scattering at small angles (SAXS) was performed using a S3-MICRO (Hecus X-ray systems GMBH Graz. Austria) coupled to a GENIX-Fox 3D X-ray source (Xenox, Grenoble), giving a detector-focused X-ray beam. The Cu Kα-line radiation, with λ = 0.1542 nm, has over 97% purity and less than 0.3% Kα. The transmitted scattered radiation was detected using a PSD 50 Hecus unit working at small-angle regimes (0.09 nm−1 < q < 6 nm−1). Temperature was controlled through a Peltier TCCS-3 Hecus unit. The samples were inserted in a flow-through glass capillary with 1.0 mm inner diameter and 10 μm wall thickness or, in case of non-fluid samples, inserted between two Mylar sheets. SAXS scattering curves were plotted as a function of the scattering vector modulus, q = (4π/λ)sin(θ/2) where θ is the scattering angle and λ the wavelength of the incident radiation. The scattering vector was calibrated by comparison with a standard silver behenate crystalline sample (>98% RoseChemicals Ltd UK.). We used a detector-focused small beam 300 × 400 μm full width at half maximum. The main smearing effect is due to the detector width, which widens the peaks without noticeable effect on their positions. The background was subtracted from the scattering curves. The latter were scaled in absolute units by comparison with water scattering.18,19 The instrumentally smeared experimental SAXS curves were fitted to numerical models, convoluted for beam size and detector width effects.20 A least-squares routine based on the Levenberg–Marquardt scheme was used.21Energy-filtered transmission electron microscopy (EF-TEM)
The samples were observed in a Zeiss EM902 transmission electron microscope, operating at 80 kV and equipped with an ‘‘in column’’ electron energy filter. The filter was settled to collect only elastic electrons (ΔE = 0), with the result to enhance image contrast and resolution thanks to the elimination of inelastic electrons in the image formation (reduction of the chromatic aberration). The sample was stained with 2% (w/v) phosphotungstic acid (PTA) in buffered aqueous solution at pH = 7.3 (NaOH), previously filtered by polycarbonate 0.2 μm filters to eliminate impurities. Images were acquired with a digital charge-coupled device camera, model PROSCAN HSC2 (1k × 1k pixels), thermostated by a Peltier unit. The image analysis was performed by a digital analyzer SIS 3.0. The overall resolution is in the range of 2 nm.22Elemental analysis
Determination of C, H, N and S% in DiDAB/8-SHS/DNA complexes was performed by an elemental microanalyzer (A7) model Flash 2000, at the “IQAC's Microanalysis Service” facility. A modified Pregl–Dumas technique (dynamic flash combustion), with helium as carrier gas, was used. Instruments are calibrated according to the standards methods. Analyses are carried out in duplicate. All results are given as weight percent for each element. From the results, the number of DiDAB and 8-SHS molecules per nucleotide in the complex was determined. Values are adjusted until the theoretical %C/%N ratio and %S match those found experimentally. The DNA base pair composition and the chemical structure of the surfactants were introduced as input parameters.Circular dichroism spectroscopy (CD)
CD spectra were recorded on a Jasco J-715 spectropolarimeter equipped with a Peltier device for the temperature control operating at 1.0 nm resolution. Quartz cells of suitable path length were used. Spectra are the average of at least four runs, performed in the range 220–330 nm. All the spectra are normalized by the nucleotide concentration previously determined by absorption spectroscopy. CD spectra are normalized and reported as molar circular dichroism, Δε (M−1 cm−1).Results and discussion
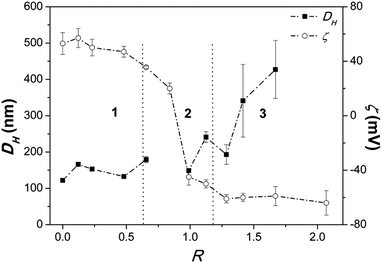
Addition of DNA to the vesicular dispersions produces variations in particles size and ζ-potential depending on the [PO4−]/[DiDA+] charge ratio. In Fig. 1 three regions can be identified:1. At small R (<0.6), DH and ζ do not change significantly. DNA adsorbs electrostatically onto vesicles and the related complexes are stable. Small amounts of precipitate start to form in close proximity of region 2.
2. At intermediate R (up to 1.2), ζ abruptly decreases and reaches a value close to 0 mV (the isoelectric point) when R is close to 0.9. In these conditions, the particles diameter diverges beyond the detection limits (≈10 μm). Above the isoelectric point, ζ inverts its sign and DH becomes comparable to the initial values. Precipitation is always observed.
3. At still higher DNA amount (R > 1.2), ζ remains constant, whereas DH increases. Size distributions become polydisperse. The precipitate is partly redissolved.
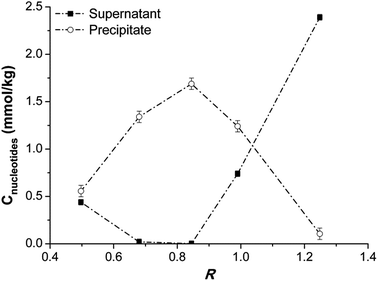
Aqueous DNA has a higher hydrodynamic radius than vesicles (see ESI, Fig. S1†). For example, in the DNA/vesicles system at R = 0,25, (Cnucleotide = 0.5 mmol kg−1) the measured hydrodynamic diameter is 166 ± 3 nm (Fig. 1). At the same concentration, DNA in water has an hydrodynamic radius of 440 ± 50 nm. At low R values, moreover, the correlograms of the complexes are very similar to those of bare vesicles (ESI, Fig. S2†). At such ratios, likely, DNA wraps around the vesicles surface, and the final complexes have sizes similar to those of the bare vesicles. At higher R values, the DNA/vesicle complexes become less charged, as it can be seen by ζ-potential values, resulting in the decrease of the electrostatic repulsions between them. The complexes are no longer stable. They aggregate forming large particles and precipitate. Above the isoelectric point, ζ changes its sign, and the precipitate is partly redissolved. Such “charge inversion” phenomenon was previously observed in other polymer/vesicles systems.23 DNA can still bind to the free sites on the complex, imparting a negative charge. In region 3, ζ reaches a constant value. In this region, the correlograms and the particles size are similar to those of aqueous DNA (ESI, Fig. S1 and S2†). Their shape is peculiar to anisometric particles such as DNA in random coil conformation. This suggests that the DNA in excess is free in solution. In fact, the samples viscosity is very similar to that of aqueous DNA. Optical absorbance data (Fig. 2) suggest that when precipitation starts, at low R values, a large fraction of DNA is still in the supernatant, likely bound to the vesicles. These complexes are stable in solution because vesicles are not completely saturated by DNA and their surface charge is high enough to assure an efficient electrostatic repulsion. The unsaturated complexes (i.e. non-neutralized vesicles) coexist with saturated ones. The latter are less stable, because of reduced electrostatic repulsions, and precipitate. The coexistence of stable complexes and precipitate can be ascribed to a cooperative binding of the DNA onto already occupied vesicles. The origin of this phenomenon is not entirely clear yet. It was previously observed in studies on DNA interaction with surfactants in solution at concentrations below the CMC.24 In the latter case, surfactant binding on the same molecule is favoured by the nucleation and aggregation into micelles. In the present situation surfactants are already aggregated and it is unconceivable that their constituent ions transfer from vesicles to DNA. The origin of the observed behaviour relies on the fact that DNA in solution tends to aggregate in fibres. To satisfy this tendency, it binds to vesicles onto which other such molecules are already adsorbed. In the above conditions vesicles are destabilized and their surface charge decreases. Vesicle/DNA complexes are progressively saturated on increasing DNA concentration.
As it is evident from Fig. 2, almost all DNA is precipitated near the isoelectric point (R ≈ 0.9) measured by the electrophoretic mobility measurements. Above this threshold the fraction of free DNA in the supernatant increases and the precipitate is partly redissolved.
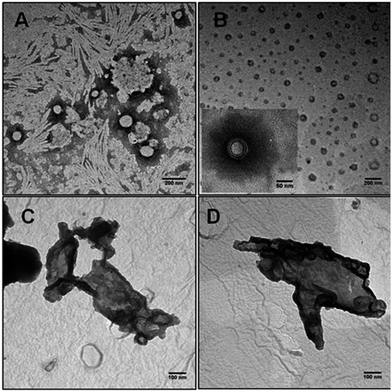
TEM measurements gave more insights on the morphology of the complexes (Fig. 3). At R = 0.25 (Fig. 3B) DNA/vesicles complexes retain the same size as bare vesicles (Fig. 3A), supporting DLS measurements. However, bare vesicles are uni-lamellar whereas in the sample containing DNA also multi-lamellar aggregates are observed (inset in Fig. 3B). Hence, the formation of such entities depends on the interaction with the biomacromolecule. The electrostatic repulsion between vesicles decreases when they are covered by DNA. This induces fusion, aggregation and rearrangement, phenomena that leads to the formation of multi-lamellar DNA/vesicles complexes.24 Below and above the isoelectric point, Fig. 3C and D, respectively, large clusters do form. In some cases, it is possible to recognize the vesicular structural identity inside clusters. Thus, vesicle shape is partly retained.
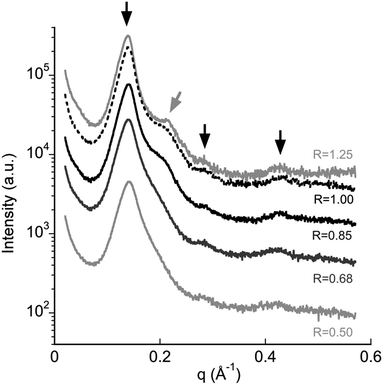
The precipitate was investigated by SAXS. In the spectra (Fig. 4) three peaks at 1![[thin space (1/6-em)]](https://www.rsc.org/images/entities/char_2009.gif) :
:![[thin space (1/6-em)]](https://www.rsc.org/images/entities/char_2009.gif) 2
2![[thin space (1/6-em)]](https://www.rsc.org/images/entities/char_2009.gif) :
:![[thin space (1/6-em)]](https://www.rsc.org/images/entities/char_2009.gif) 3 q ratios can be observed. The spacings are compatible with lamellar order. An additional weak peak near the first is evident too; its position depends on DNA content. The latter can be ascribed to one-dimensional spacing of DNA molecules in the complex.25 From the spectra, it is possible to calculate the repetition distance of the lamellar phase, dlam, and the DNA–DNA spacing, dDNA (Table 1). The peaks relative to the lamellar order are nearly at the same positions for all samples and dlam is ≈ 4.5 nm. As indicated in previous work,12 the bilayer thickness of the lamellar phase formed by the individual surfactants is 2.3 nm.
3 q ratios can be observed. The spacings are compatible with lamellar order. An additional weak peak near the first is evident too; its position depends on DNA content. The latter can be ascribed to one-dimensional spacing of DNA molecules in the complex.25 From the spectra, it is possible to calculate the repetition distance of the lamellar phase, dlam, and the DNA–DNA spacing, dDNA (Table 1). The peaks relative to the lamellar order are nearly at the same positions for all samples and dlam is ≈ 4.5 nm. As indicated in previous work,12 the bilayer thickness of the lamellar phase formed by the individual surfactants is 2.3 nm.
| R | d lam (nm) | d DNA (nm) |
|---|---|---|
| 0.50 | 4.47 ± 0.03 | — |
| 0.68 | 4.49 ± 0.03 | 3.31 ± 0.03 |
| 0.85 | 4.52 ± 0.03 | 3.11 ± 0.03 |
| 1.00 | 4.52 ± 0.03 | 3.01 ± 0.03 |
| 1.25 | 4.55 ± 0.03 | 2.92 ± 0.03 |
This value is compatible with hydrocarbon chains in a fully extended conformation. The distance between two bilayers in the complex should be around 2.2 nm. Since DNA molecules have a diameter of 2.5 nm, including its hydration shell, there is room enough to accommodate one DNA layer.25 Thus, the precipitate has a lamellar structure dictated by the surfactants location in the bilayer with DNA molecules sandwiched in between. The distance between DNA molecules, dDNA, on the contrary, decreases on increasing R (Table 1). The values reported therein agree with the minimum possible distance between DNA helices, observed in dehydrated fibres (2.5 nm).26
The composition of the precipitates below (R = 0.68) and beyond (R = 1) the isoelectric point was determined from elemental analysis data. The procedure to determine the proportion of the different species in the precipitates is detailed in the (ESI, Procedure S1†). The results in Table 2 allow evaluating that the DiDAB/8-SHS ratio in the precipitate is higher than the nominal one in the catanionic mixture (4/1). The real mole ratio in bare vesicles does not necessarily correspond to the nominal one, since the more soluble surfactant could be partitioned in the bulk.27 In this case, DiDAB/8-SHS in the precipitate increases with DNA content; therefore, 8-SHS units are partly released from the bilayer. Accordingly, variations in the composition should depend on the interactions with DNA. When the anionic surfactant is expelled from the complex, more DiDAB molecules may interact with DNA. When the amount of free DiDAB molecules in the bilayer increases, more binding sites are available for DNA. This increases the tendency of DNA helices to sandwich closely among the bilayers. Consequently, dDNA decreases with R. From the composition of the precipitate, it was also deduced that the number of DiDAB units per base required for precipitation is not stoichiometric. In fact, some DiDAB molecules are neutralized by 8-SHS, and the free ones, which effectively interact with DNA, are 1.27 and 1.21 DiDAB per DNA nucleotide, for R = 0.68 and 1, respectively. The value is nearly independent of R. Therefore, there is a DiDABfree/base threshold beyond which the complexes are unstable and precipitate. Low DNA amounts are required to destabilize the complexes and form the precipitate.
| R | C% | H% | N% | S% | DiDAB × base | 8-SHS × base | DiDAB/8-SHS | DiDABfree × base |
|---|---|---|---|---|---|---|---|---|
| 0.68 | 59.63 | 10.20 | 7.40 | 0.93 | 1.59 | 0.32 | 5 | 1.27 |
| 1.00 | 57.11 | 9.43 | 7.53 | 0.78 | 1.45 | 0.24 | 6 | 1.21 |
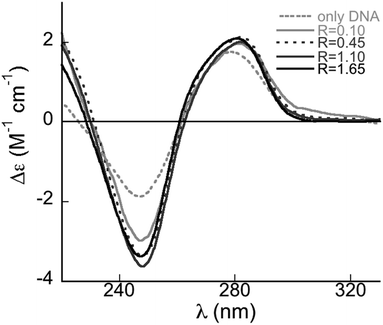
The conformation of DNA adsorbed onto catanionic vesicles was investigated by CD spectroscopy in solution. Calf thymus DNA in water adopts the B-form indicated by the conservative spectrum in Fig. 5 (light grey dashed line). Differences in the band intensities are due to variations in the number of base pairs per helix turn.27 Due to a large-scale helicity, condensed DNA presents both positive and negative CD signals with large amplitudes. DNA adsorbed onto the complexes has a different CD spectrum with respect to that in water (Fig. 5). The amplitude of the negative band increases, while the maximum of the positive ones is slightly red-shifted. Such variations imply that conformational transitions from B to C-form occur.28 The C-form is characterized by a lower number of residues per turn (9.3) with a consequent increase in helicity and a shallow major groove. This makes the double helix more compact. In particular, the increase of the negative band intensity is related to an increase in DNA helicity.29 Hence, DNA undergoes conformational changes as a consequence of the interactions with vesicles but maintains its main structural features. Compaction is promoted by electrostatic interactions with the positive charges facing outward the vesicle surface. It is well known that the B–C transition is favoured by a lower hydration.30 Solvent effects play a significant role in double helix stabilization, in particular for the B-form.31 Counter-ions screen the phosphate charges in DNA backbone and control water content around the double helix.32,33 When DNA interacts with the positive binding sites on the vesicles, counter-ions are expelled and the hydration shell looses water molecules. This increases helicity and compaction. B–C transition is reversible and is important in transfection technologies since it favours DNA penetration into the target cells and protects it from nuclease degradation.34
The mechanism of DNA release from lipoplexes in vivo is not yet fully understood. Probably, the complex is internalized into cells by endocytosis; it destabilizes the endosomal membrane inducing flip-flop of anionic lipids located in the cytoplasmic-facing monolayer. The anionic lipids diffuse into the complex and form a neutral ion pair with cationic species. The decrease of bilayer surface charge in the complex reduces electrostatic attractions with DNA, favouring its release into the cytoplasm.35 Other internalization paths are possible (destabilization or fusion with plasma membranes, for instance) but these imply flip-flop and diffusion of anionic lipids in the complex.36 Our situations is different but it is useful to try to mimic these mechanism in order to have some evidences on the behaviour of our systems in real conditions. Accordingly, we added the anionic surfactant to the precipitate formed by DNA/vesicles complexes to simulate the diffusion of the anionic lipids of the cell membrane into the lipoplexes. Therefore, known amounts of 8-SHS were added to preformed DiDAB/8-SHS/DNA entities. Samples with charge ratio R = 0.85 were considered. In these conditions, there is a quantitative precipitation of the lamellar phase. The initial [DiDAB]/[8-SHS] ratio in the vesicular dispersion is 4, but 8-SHS was added to DNA/vesicles complexes to reach final [DiDAB]/[8-SHS] ratios of 3, 2 and 1.
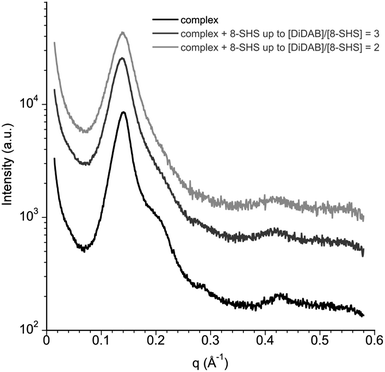
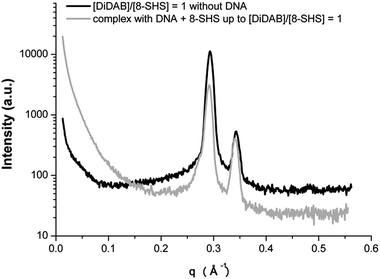
Addition of the anionic surfactant results in partial re-dissolution of the precipitate. In the SAXS spectra (Fig. 6) the peak relative to the 1D spacing of DNA in the lamellar phase is shifted to smaller q on increasing [DiDAB]/[8-SHS] ratio (Table 3). This is a consequence of the incorporation of the anionic surfactant in the bilayer. In fact, 8-SHS neutralizes DiDAB molecules, decreasing the number of available binding sites for the nucleotides and the surface charge of the outer layer. Then, a lower amount of DNA is absorbed. Absorption measurements at 260 nm on the supernatant support these results (ESI, Fig. S3†). In fact, the increase of the [DiDAB]/[8-SHS] ratio produces an increase of DNA concentration in the supernatant, as a result of its re-dissolution from the precipitate. It is worth noting that adding 8-SHS up to a final [DiDAB]/[8-SHS] ratio equal to 1 leads to the separation of a phase similar to the 1![[thin space (1/6-em)]](https://www.rsc.org/images/entities/char_2009.gif) :
:![[thin space (1/6-em)]](https://www.rsc.org/images/entities/char_2009.gif) 1 complex formed by the surfactants without DNA, as suggested by SAXS results in Fig. 7. Therefore, DNA release from the complex is effective and is a consequence of the formation of ion pairs between the two surfactants. It is also possible that a similar process can be exploited to release DNA from non-precipitated complexes.
1 complex formed by the surfactants without DNA, as suggested by SAXS results in Fig. 7. Therefore, DNA release from the complex is effective and is a consequence of the formation of ion pairs between the two surfactants. It is also possible that a similar process can be exploited to release DNA from non-precipitated complexes.
| Final [DiDAB]/[8-SHS] ratio | d lam (nm) | d DNA (nm) |
|---|---|---|
| 4 | 4.52 ± 0.03 | 3.11 ± 0.03 |
| 3 | 4.57 ± 0.03 | 3.55 ± 0.03 |
| 2 | 4.52 ± 0.03 | 4.01 ± 0.03 |
Conclusions
DiDAB/8-SHS catanionic vesicles interact with calf thymus DNA by associative phenomena. The structure of the complexes they form depends on DNA concentration. At low content, DNA adsorbs onto vesicles; the complexes are stable and similar in size and morphology to bare vesicles. Multi-lamellar structures are also observed by TEM. At high DNA content, a lamellar phase precipitates, with DNA sandwiched in between. The distance between double helices, dDNA, decreases with DNA content, and the surfactant bilayer is progressively depleted of the anionic species. Precipitation starts to occur below the isoelectric point, detected by ζ-potential, above a critical [PO4−]/[DiDAB] threshold. In such conditions, DNA is present in the supernatant. Its adsorption is cooperative and binding occurs on already occupied vesicles. At the isoelectric point, complexes form large clusters, but the vesicular identity within the aggregates is retained. Beyond the isoelectric point “charge inversion” occurs and the precipitate is partly redissolved. The DNA double helix in the complexes undergoes compaction from B-to C-form, which favours DNA penetration in the cell membrane and protects it from nucleases degradation. The results suggest that catanionic vesicles made by DiDAB and 8-SHS can be promising vectors in non-viral gene therapy. The complexes they form with DNA are stable, and their structure is modulated by composition. In future research, this will allow correlating transfection efficiency and internalization pathways with the arrangement of DNA in the complex. Addition of more 8-SHS to precipitates induces DNA release allowing for a specific signal controlled release mechanism. This is a useful triggering signal for DNA release.Acknowledgements
We thank Jaume Caelles, SAXS-WAXS service at IQAC, for X-Ray measurements. We also thank Imma Carrera and Amalia Mezei for experimental support and stimulating discussions during the work. Financial support from MINECO-CTQ2013-41514 P and MAT2012-38047-CO-02 is gratefully acknowledged. Financial support from “Sapienza” University, Rome (IT) is acknowledged.References
- T. Heimburg and D. Marsh, Biophys. J., 1995, 68, 536–546 CrossRef CAS PubMed.
- M. J. Zuckerman and T. Heimburg, Biophys. J., 2001, 81, 2458–2472 CrossRef.
- H. L. Holtorf and A. G. Mikos, Pharm. Perspect. Nucleic Acid-Based Ther., 2002, pp. 367–387 Search PubMed.
- M. Foradada, M. D. Pujol, J. Bermudez and J. Estelrich, Chem. Phys. Lip., 2000, 104, 133–148 CrossRef CAS PubMed.
- C. G. Ferguson, R. D. James, C. S. Bigman, D. A. Shepard, Y. Abdiche, P. S. Katsamba, D. G. Myszka and G. D. Prestwich, Bioconjugate Chem., 2005, 16, 1475–1483 CrossRef CAS PubMed.
- E. W. Kaler, K. L. Herrington, A. K. Murthy and J. A. N. Zasadzinski, J. Phys. Chem., 1992, 96, 6698–6707 CrossRef CAS.
- J.-H. S. Kuo, M.-S. Jan, C.-H.- Chang, H.-W. Chiu and C.-T. Li, Colloids Surf., B, 2005, 41, 189–196 CrossRef CAS PubMed.
- P. Andreozzi, S. S. Funari, C. La Mesa, P. Mariani, M. G. Ortore, R. Sinibaldi and F. Spinozzi, J. Phys. Chem. B, 2010, 114, 8056–8060 CrossRef CAS PubMed.
- C. Pucci, A. Scipioni and C. La Mesa, Soft Matter, 2012, 8, 9669–9675 RSC.
- L. Russo, V. Berardi, F. Tardani, C. La Mesa and G. Risuleo, BioMed Res. Int., 2013, 734596, 1–7 CrossRef PubMed.
- D. D. Lasic, H. Strey, M. C. A. Stuart, R. Podgornik and P. M. Frederik, J. Am. Chem. Soc., 1997, 119, 832–833 CrossRef CAS.
- C. Pucci, L. Peréz, C. La Mesa and R. Pons, Soft Matter, 2014, 10, 9657–9667 RSC.
- A. Nagayasu, K. Uchiyama and H. Kiwada, Adv. Drug Delivery Rev., 1999, 40, 75–87 CrossRef CAS PubMed.
- D. C. Drummond, O. Meyer, K. Hong, D. B. Kirpotin and D. Papahadjopoulos, Pharmacol. Rev., 1999, 51, 691–743 CAS.
- E. E. Dreger, G. I. Keim, G. D. Miles, L. Shedlovsky and J. Ross, Ind. Eng. Chem., 1944, 36, 610–617 CrossRef CAS.
- D. E. Koppel, J. Chem. Phys., 1972, 57, 4814–4820 CrossRef CAS.
- A. W. Adamson, in Physical Chemistry of Surfaces, Wiley & Sons, New York, 5th edn, 1990, ch. 5, p. 203 Search PubMed.
- D. Orthaber, A. Bergmann and O. Glatter, J. Appl. Crystallogr., 2000, 33, 218–225 CrossRef CAS.
- L. Peréz, A. Pinazo, M. R. Infante and R. Pons, J. Phys. Chem. B, 2007, 111, 11379–11387 CrossRef PubMed.
- J. Morros, M. R. Infante and R. Pons, Soft Matter, 2012, 8, 11353–11362 RSC.
- J. S. Pedersen, Adv. Colloid Interface Sci., 1997, 70, 171–210 CrossRef CAS.
- M. Diociaiuti, J. Electron Spectrosc. Relat. Phenom., 2005, 143, 189–203 CrossRef CAS.
- F. Bordi, C. Cametti, M. Diociaiuti, D. Gaudino, T. Gili and S. Sennato, Langmuir, 2004, 20, 5214–5222 CrossRef CAS PubMed.
- R. S. Dias, B. Lindman and M. G. Miguel, J. Phys. Chem. B, 2002, 106, 12608–12612 CrossRef CAS.
- R. S. Dias, B. Lindman and M. G. Miguel, J. Phys. Chem. B, 2002, 106, 12600–12607 CrossRef CAS.
- H. M. Berman, Biopolymers, 1996, 44, 23–44 CrossRef.
- L. L. Brasher, K. L. Herrington and E. W. Kaler, Langmuir, 1995, 11, 4267–4277 CrossRef CAS.
- V. I. Ivanov, L. E. Minchenkova, A. K. Shchelkina and A. I. Poletaev, Biopolymers, 1973, 12, 89–110 CrossRef CAS PubMed.
- Z. Zhang, W. Huang, J. Tang, E. Wang and S. Dong, Biophys. Chem., 2002, 97, 7–16 CrossRef CAS PubMed.
- S. B. Zimmerman, Annu. Rev. Biochem., 1982, 51, 395–427 CrossRef CAS PubMed.
- M. Harmouchi, G. Albiser and S. Premilat, Eur. Biophys. J., 1990, 19, 87–92 CrossRef CAS PubMed.
- M. G. Kubinec and D. E. Wemmer, J. Am. Chem. Soc., 1992, 114, 8739–8740 CrossRef CAS.
- D. C. Rau and A. Parsegian, Biophys. J., 1992, 61, 246–269 CrossRef CAS PubMed.
- C. Bombelli, F. Faggioli, P. Luciani, G. Mancini and M. G. Sacco, J. Med. Chem., 2005, 48, 5378–5382 CrossRef CAS PubMed.
- Y. Xu and F. C. Szoka Jr, Biochemistry, 1996, 35, 5616–5623 CrossRef CAS PubMed.
- P. F. Devaux, Annu. Rev. Biophys. Biomol. Struct., 1992, 21, 417–439 CrossRef CAS PubMed.
Footnote |
| † Electronic supplementary information (ESI) available: DNA hydrodynamic diameter in water (Fig. S1) correlations curves of DiDAB/8-SHS vesicles and DNA complexes at different ratios (Fig. S2); nucleotides concentration vs. [DiDAB]/[8-SHS] final ratio in the supernatant and in the precipitate (Fig. S3). Procedure to determine the proportion of precipitate composition (Procedure S1). See DOI: 10.1039/c5ra15466a |
| This journal is © The Royal Society of Chemistry 2015 |

