A thermophysical and structural characterization of ionic liquids with alkyl and perfluoroalkyl side chains†
N. S. M. Vieiraa,
P. M. Reisa,
K. Shimizub,
O. A. Cortesa,
I. M. Marruchoa,
J. M. M. Araújoa,
J. M. S. S. Esperançaa,
J. N. Canongia Lopes*ab,
A. B. Pereiro*a and
L. P. N. Rebeloa
aInstituto de Tecnologia Química e Biológica António Xavier, Universidade Nova de Lisboa, 2780-157, Oeiras, Portugal. E-mail: anab@itqb.unl.pt
bCentro de Química Estrutural, Instituto Superior Técnico, Universidade de Lisboa, Av. Rovisco Pais, 1049-001 Lisboa, Portugal. E-mail: jnlopes@ist.utl.pt
First published on 24th July 2015
Abstract
This work represents an essential step towards the understanding of the dynamics and thermodynamic characteristics of a novel family of ionic liquids, namely fluorinated ionic liquids based on the combination of 1-alkyl-3-methylimidazolium cations with perfluoroalkylsulfonates or perfluoroalkylcarboxylates anions. The so far scarce information about these fluids constitutes a limiting factor for their potential applications. In this work, we provide detailed evidence on the influence of hydrogenated and fluorinated alkyl chain lengths in the final characteristics of the fluorinated ionic liquids. Different properties, namely, melting point, decomposition temperature, density, dynamic viscosity, ionic conductivity and refractive index, were determined and the experimental results were discussed taking into account the influence of the length of the hydrogenated and fluorinated alkyl chains. Molecular dynamic simulations were also performed to study the nanoscale structure of these novel compounds.
Introduction
During the last two decades the interest in ionic liquids (ILs) has increased. Researchers, scholars and industry have developed multiple types of studies using these specific fluids.1,2 Nowadays, ILs are being used at an industrial scale by different companies (e.g., BASF, Petronas, Degussa, SASOL, among others) in processes such as organic transformations, separations, extractions, hydrogenations and alkylations.3,4 The pharmaceutical industry has recognised the potential of ILs, and, recently, several research groups have successfully tried to take advantage of the unique properties of ILs to improve or develop biomedical products.5–7 This broad frame of applications is a consequence of the unique properties of ILs that make these compounds very valuable. Generally, ILs present low melting points, negligible vapour pressures at room temperature, low flammability, high thermal and chemical stability, high electrical conductivity, high solvation ability for organic, inorganic and organometallic compounds, improved selectivity and easy recycling.8,9 The great advantage of ILs is the possibility to manage the final characteristics of the compounds through diverse combinations of cations and anions. This tunability allows the manipulation of several properties like hydrophobicity, thermophysical properties, bioavailability and toxicity.9,10This work is specifically focused on fluorinated ionic liquids (FILs)11 which may contain three nanosegregated domains (polar, nonpolar and fluorous).12 FILs present many of the unique properties of fluorocarbon compounds, like their capacity of dissolving gases,13 low surface tension,13,14 low intensity interactions with organic compounds and low toxicity for different cell lines.11 These properties, in addition to the different possible arrangements of the three domains, enable us to design the best fluid for a desired application.
The uses of FILs may be related to the recovery/recycling of perfluorocarbons contaminants.11 Furthermore, these fluorinated compounds could also be applied as refrigerants, surfactants, polymers, components of pharmaceuticals, fire retardants and insecticides.15 Another possible powerful application of non-toxic FILs may be related to biomedical applications where these compounds may be used as gas carriers in liquid ventilation and intravenous formulations by enhancing the emulsion stability and increasing the solubility of respiratory gases.11,13,16,17
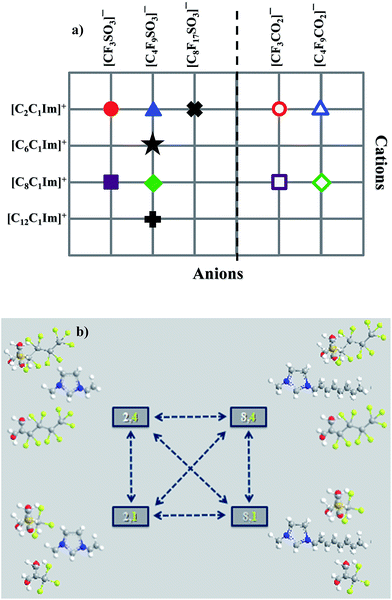
This work provides comparisons between several thermophysical properties of different FILs based on alkylmethylimidazolium cations, [CnC1Im]+, conjugated with different perfluorosulfonate and perfluorocarboxylate anions, [CnF2n+1SO3] and [CnF2n+1CO2], respectively. These compounds are both illustrated in Fig. 1 and Table S1 of the ESI.† The main objective of this study was to evaluate the influence of increasing both the hydrogenated and fluorinated alkyl chain lengths. Besides the thermophysical characterization, molecular dynamic simulations were also performed.
Experimental methods
Samples
1-Ethyl-3-methylimidazolium perfluoromethanesulfonate ([C2C1Im][CF3SO3], >99% mass fraction purity, <0.01% halide impurities), 1-methyl-3-octylimidazolium perfluoromethanesulfonate ([C8C1Im][CF3SO3], >99% mass fraction purity, <0.01% halide impurities), 1-ethyl-3-methylimidazolium perfluorobutanesulfonate ([C2C1Im][C4F9SO3], >97% mass fraction purity, <1% halide impurities), 1-hexyl-3-methylimidazolium perfluorobutanesulfonate ([C6C1Im][C4F9SO3], >99% mass fraction purity, <0.025% halide impurities), 1-mehtyl-3-octylimidazolium perfluorobutanesulfonate ([C8C1Im][C4F9SO3], >98% mass fraction purity, <0.025% halide impurities), 1-dodecyl-3-methylimidazolium perfluorobutanesulfonate ([C12C1Im][C4F9SO3], >98% mass fraction purity, <1% halide impurities) and 1-ethyl-3-methylimidazolium perfluorooctanesulfonate ([C2C1Im][C8F17SO3], >98% mass fraction purity, <0.47% halide impurities) were supplied by IoLiTec GmbH. The purity of the commercial ionic liquids was checked by 1H and 19F NMR. 1-Ethyl-3-methylimidazolium perfluoroethanoate ([C2C1Im][CF3CO2]), 1-methyl-3-octylimidazolium perfluoroethanoate ([C8C1Im][CF3CO2]), 1-ethyl-3-methylimidazolium perfluoropentanoate ([C2C1Im][C4F9CO2]) and 1-methyl-3-octylimidazolium perfluoropentanoate ([C8C1Im][C4F9CO2]) were synthesized by an ion exchange resin method, as developed by Ohno et al.,18 and also implemented in our lab.19 All these procedures are described in the ESI.† Purity was checked by 1H and 19F NMR as well as by elemental analysis and electrospray ionisation mass spectra (ESI-MS). The quantitative integration of their characteristic 1H and 19F NMR resonance peaks reveals the expected cation/anion correlations using an internal standard. To ensure the absence of water and volatile substances' contents all FILs were dried under vacuum (3 × 10⁻² Torr) and vigorously stirred at 323.15 K for at least 2 days, immediately prior to their use. The water content, determined by Karl Fischer coulometric titration (Metrohm 831 KF Coulometer), was less than 100 ppm.Thermal analysis
Thermogravimetric analysis (TGA) were carried out with a TA instrument Model TGA Q50 to measure the decomposition temperatures of the FILs. Nitrogen was used for the TGA measurements at a flow rate of 60 ml min−1. Samples were placed inside aluminium pans and heated up to 873 K at a rate of 1 K min−1 until complete thermal degradation was achieved. Universal Analysis, version 4.4A software, was used to determine the onset (Tonset), starting (Tstart) and decomposition (Tdec) temperatures corresponding to the temperature at which the baseline slope changed during heating, the weight loss was less than 1%, and the weight loss was 50%, respectively. The relative uncertainty of the temperature is ±2 K.A DSC Q200 Differential Scanning Calorimeter (TA Instrument) was used to measure the thermal properties of the FILs. The sample was continuously purged with 50 ml min−1 of dry dinitrogen gas. About 5 to 10 mg of FIL was crimped in an aluminium standard sample pan. Indium (mp, T = 429.76 K) was used as the standard compound for the calibration of the DSC. The cooling–heating cycles were repeated three times at different rates (10, 5, and 1 K min−1). The transition temperatures obtained from the second and subsequent cycles at the same rate were reproducible.
Viscosity measurements
Measurements of dynamic viscosity were performed in the temperature range from 293.15 to 353.15 K at atmospheric pressure using an automated SVM 3000 Anton Paar rotational Stabinger viscometer. The SVM 3000 uses Peltier elements for fast and efficient thermostability. The temperature uncertainty is ±0.02 K. For each FIL, duplicates were measured and the reported result is the average value with a maximum relative standard deviation (RSD) of 1%. The overall uncertainty of the measurements (taking into account the purity and handling of the samples) is estimated to be 2%.Density measurements
Density was measured with an Anton Paar vibrating tube densimeter, model DMA 5000, operating at atmospheric pressure and in the temperature range from 293.15 K to 353.15 K. The internal calibration of the instrument was confirmed by measuring the densities of atmospheric air and bi-distilled water, according to the recommendations of the manufacturer. The DMA 5000 cell is embedded in a cavity inside a metallic block, the temperature of which is controlled by several Peltier units. This arrangement allows a temperature stability better than 0.002 K for periods over 10 min. Under these operating conditions, the density measurement repeatability was better than 5 × 10⁻⁵ g cm−3 and the expanded uncertainty is estimated to be ±3 × 10⁻⁴ g cm−3. All reported density data were corrected for the effect of viscosity using the internal calibration of the densimeter. During the measurements the liquid (ca. 2 cm3) was transferred to a syringe and injected into the densimeter. To prevent any air bubble, the vibrating tube was first filled with some of the contents of the syringe (ca. 1 cm3), and a first density measurement was taken (after the temperature set point was reached). Another measurement was carried out after the liquid of the vibrating tube was replaced by that remaining in the syringe. The agreement between both values judges both the effectiveness of the method and the absence of air bubbles.Ionic conductivity measurements
Ionic conductivities were measured using a CDM210 Radiometer Analytical conductimeter in a jacketed glass cell containing a magnetic stirrer. The cell was thermostatized with a water bath controlled to ±0.01 K. The cell temperature was measured by a platinum resistance thermometer coupled to a Keithley 199 System DMM/Scanner. The thermometer was calibrated against high-accuracy mercury thermometers (0.01 K). Then, 1.5 ml of the sample was added to the thermostatic cell and stirred. The cell was closed with screw caps to ensure a secure seal and flushed with dry nitrogen to prevent humidity. The conductimeter was calibrated at each temperature with certified 0.01 D and 0.1 D KCl standard solutions supplied by Radiometer Analytical. This technique was validated using pure ionic liquids as described previously.20 Every conductivity value was determined at least two times and the uncertainty of the measurements is estimated to be ≤1%.Refractive index
The refractive index of the pure ionic liquids was determined by an ABBEMAT 500 Anton Paar automatic refractometer with a resolution of ±10−6 and an uncertainty of ±4 × 10⁻⁵. The apparatus was calibrated by measuring the refractive index of Millipore quality water and tetrachloroethylene (provided by the supplier) before each series of measurements.Molecular dynamics simulations details
When studying microstructured fluids, the size of the systems and the duration of the simulations are of particular importance since periodic boundary conditions can induce artificial finite-size effects on the length scales of the observed nanostructures. System sizes were chosen as to contain around 13![[thin space (1/6-em)]](https://www.rsc.org/images/entities/char_2009.gif) 000 atoms, yielding cubic simulation boxes slightly larger than 125 nm3. The number of ion pairs and the size of the simulation box for all studied ILs are presented in Table 1.
000 atoms, yielding cubic simulation boxes slightly larger than 125 nm3. The number of ion pairs and the size of the simulation box for all studied ILs are presented in Table 1.
| System | N ion pairs | Vbox/nm3 | lbox/nm |
|---|---|---|---|
| [C2C1Im][CF3CO2] | 1000 | 280.5 | 6.55 |
| [C2C1Im][CF3SO3] | 1000 | 298.8 | 6.69 |
| [C2C1Im][C4F9SO3] | 350 | 148.8 | 5.30 |
| [C6C1Im][C4F9SO3] | 250 | 134.6 | 5.12 |
| [C8C1Im][CF3CO2] | 700 | 314.5 | 6.80 |
| [C8C1Im][CF3SO3] | 700 | 326.6 | 6.89 |
| [C8C1Im][C4F9SO3] | 250 | 148.8 | 5.30 |
| [C12C1Im][C4F9SO3] | 250 | 175.7 | 5.60 |
Due to the slow dynamics of this type of system, special care was taken to ensure the attainment of true equilibrium conditions.
All simulations started from low-density configurations that were subjected to 3 ns equilibration runs under isobaric isothermal ensemble conditions at p = 0.1 MPa and T = 343 K, with Nosé–Hoover thermostats and barostats with relaxation time constants of 1 and 4 ps, respectively. The density of each system reached constant and consistent values, indicating that equilibrium had been attained and possible ergodicity problems had been overcome. Then, all ionic liquids were re-equilibrated at 298 K for 1.3 ns. Finally, several (at least six) consecutive production stages of 1.0 ns each were performed. The combined production runs were used for the structural and aggregation analysis of all studied ionic liquids (see below).
The total static structure factor functions, S(q), were calculated using a previously described methodology.27 In brief, S(q) was obtained from:
 | (1) |
 | (2) |
The connectivity analysis of either the polar moieties that compose the polar network or the alkyl chains that form the nonpolar aggregates are based on previously described algorithms30,31 that generate neighbor lists of interaction centers of a given type, in a three-stage sequential process.
First, the different types of interaction centers are defined: (i) the center of mass of the imidazolium ring and/or the sulfur atom of the perfluoroalkylsulfonate anion and/or the carbon atom of the carboxylate group of the perfluoroethanoate anion, in the case of the charged aggregates; (ii) all carbon atoms of the alkyl and/or perfluoroalkyl side chains except those directly connected to the charged moieties of the ions, in the case of the nonpolar aggregates.
Second, a connectivity threshold for each case is established by considering the corresponding gij(r) data.30,31 Within the polar network the cation–anion interionic distance has been set to 0.8 nm, corresponding to the first coordination shell limit of the gij(r) data; in the case of the alkyl side chains, the threshold has been set to 0.5 nm for the distance between any two carbon atoms belonging to two different side chains. This is also related to contact distances taken from the gij(r) data.30
Third, the use of the threshold criteria allows the computation of closest-neighbor lists for each interaction center for all recorded configurations in the production runs, thus ascertaining the connectivity within the polar network or the nonpolar domains. In the case of the polar network, the connectivity is stipulated as always being between ions of opposite sign (cations connected to anions and vice versa); in the nonpolar domains, two chains are considered to belong to the same aggregate if the distance between any two carbon atoms of the two chains is lower than the threshold value.
Finally, the probability distribution function, P(na), of finding an ionic moiety or alkyl side chain in an aggregate of a given size (with na ionic moieties or alkyl side chains) was computed from the generated connectivity lists.30
Results and discussion
Thermal properties
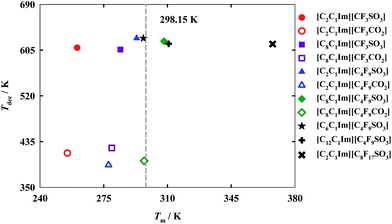
For industrial applications of FILs as alternative green solvents the determination of both decomposition and melting temperatures is paramount. These properties determine the liquid range of the compounds, and, consequently, their range of applications. While the melting temperature specifies from which temperature the FIL becomes liquid, the decomposition temperature determines the upper operating temperature for that fluid.11 In accord with the results illustrated in Fig. 2 (also reported in Table S2 of the ESI†), only [C8C1Im][C4F9SO3], [C12C1Im][C4F9SO3] and [C2C1Im][C8F17SO3] exhibit a melting temperature greater than 298.15 K. Thermal properties for [C6C1Im][C4F9SO3] and [C8C1Im][C4F9SO3] published previously11 are also shown for comparison purposes.These results suggest that both the increment of the hydrogenated alkyl chain length and the increment of the fluorinated alkyl chain length are related to an increase in the melting temperature. The differences between the carboxylate and sulfonate anions in the melting temperatures are not significant, showing a slightly lower value for the carboxylate anions. The main difference is detected for the [C8C1Im]+ cation. This cation, conjugated with the sulfonate anion [C4F9SO3]−, has a melting temperature above room temperature, in contrast with the IL with a carboxylate anion, [C4F9CO2]−, which reveals a melting slightly below 298.15 K. Besides, FILs with sulfonate anions present a much higher decomposition temperature as compared with those based on the carboxylate anions. These high decomposition temperatures of FILs incorporating sulfonate anions may be used in the energy industry, due to their high capacity of energy storage.1
Viscosity and density
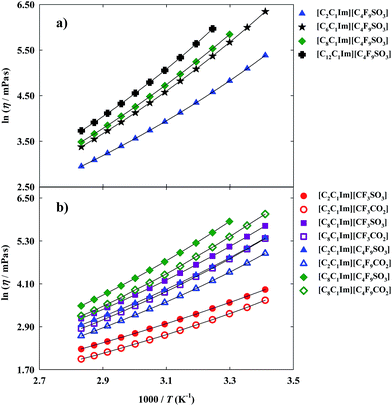
Thermophysical properties display a very important role in the application of FILs in the design and development of industrial and chemical processes.1,4,32 Nowadays, there is a scarce of information about these properties for this specific family of ionic liquids.11 Besides, even for traditional ionic liquids, the limited number of available data of their thermophysical properties, as viscosity and density,1,4 in addition to the lack of accuracy of the most common reported methods and the limited temperatures studied (most of them at 298.15 K) present a barrier for their industrial application as cleaner solvents in industrial processes.11,33 Viscosity and density are the most important properties for any fluid phase. Viscosity, a transport property, is a measure of the resistance of a fluid which is being deformed by either shear stress or tensile stress. High values of viscosity represent a disadvantage in processes that involve pumping, mixing, stirring, and mass transfer operations.1,11 This property is very dependent on temperature and, therefore measurements were performed in a range of temperatures from 293.15 K to 353.15 K. The dynamic viscosity data for the FILs based on the imidazolium cation are plotted in Fig. 3 and experimental data are reported in Table S3 of the ESI† ([C6C1Im][C4F9SO3] and [C8C1Im][C4F9SO3] have been previously published11 and are also shown for comparison purposes).For the studied ionic liquids there is only available in the literature experimental data for [C2C1Im][CF3SO3].34–36 Our data compare within experimental error with those of Freire et al.36 However, larger deviations (±6%) are observed in respect to other sets of available viscosity data. These differences arise from distinct samples with different purity levels, handling of the sample, and diverse measuring methods.
Arrhenius fittings for viscosity, η, were well carried out by the Vogel–Fulcher–Tammann (VFT) equation:
 | (3) |
 | (4) |
Furthermore, FILs based on carboxylate anions show higher fluidity than FILs based on sulfonate anions as can be verified by comparing different imidazolium-based cations available in this work: [C2C1Im][CF3SO3] < [C2C1Im][CF3CO2]; [C8C1Im][CF3SO3] < [C8C1Im][CF3CO2]; [C2C1Im][C4F9SO3] < [C2C1Im][C4F9CO2] and [C8C1Im][C4F9SO3] < [C8C1Im][C4F9CO2].
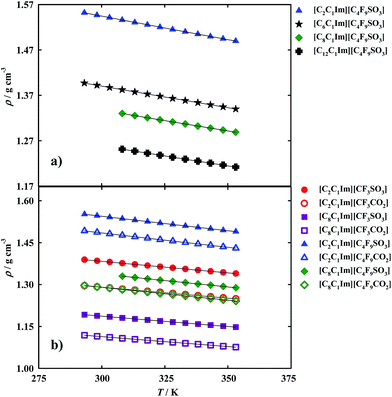
On the other hand, density is an important property for the design of separation and extraction process.11 However, as aforementioned there are discrepancies between results already published16,37,38 for fluorinated ionic liquids and those used in this work. The more precise method, found in literature for these measurements, is the U-shaped vibrating-tube densimeter11 which was used in this work. The density results are illustrated in Fig. 4 and reported in Tables S3 and S5 of the ESI.†
Comparing our density results for [C2C1Im][CF3SO3] with those available in literature,34–36,39 we can see that they fall within a ±0.1% uncertainty which is acceptable for ionic liquids mainly when measuring them using different experimental techniques, from distinct sources and handling procedures.40,41 Tsamba et al. data42 are completely away from the other experimental data available.
The temperature dependence of the density was studied applying the following expression:
ln![[thin space (1/6-em)]](https://www.rsc.org/images/entities/char_2009.gif) ρ = A0 + A1T ρ = A0 + A1T
| (5) |
From the analysis of the experimental results, it was observed that the increment of the hydrogenated alkyl chain length is related to a decrease in density. For example, the density of: [C2C1Im][CF3SO3] > [C8C1Im][CF3SO3]; and [C2C1Im][C4F9SO3] > [C6C1Im][C4F9SO3] > [C8C1Im][C4F9SO3] > [C12C1Im][C4F9SO3].
However, an increment on the fluorinated alkyl chain length is related to an increase in density as can be observed in the following examples: [C2C1Im][CF3SO3] < [C2C1Im][C4F9SO3]; [C8C1Im][CF3SO3] < [C8C1Im][C4F9SO3]; [C2C1Im][CF3CO2] < [C2C1Im][C4F9CO2]; and [C8C1Im][CF3CO2] < [C8C1Im][C4F9CO2]. Another interesting point is that carboxylate anions show lower densities than sulfonate anions for FILs based on the same cation.
The isobaric thermal expansion coefficient, αp, is defined as the temperature derivative of ln(ρ), as expressed in equation:
αp (K−1) = −[∂ln![[thin space (1/6-em)]](https://www.rsc.org/images/entities/char_2009.gif) ρ/∂T (K)]p ρ/∂T (K)]p
| (6) |
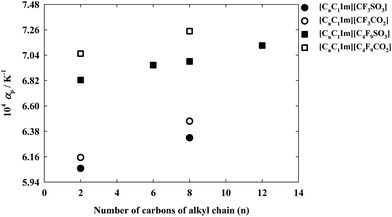
The isobaric thermal expansion coefficients for this family of ionic liquids are shown in Fig. 5. The overall estimated uncertainty of the calculate αp values is 2%. From the definition of αp we can observe that the use of a linear fitting of ln(ρ) vs. T originates a temperature independent thermal expansion coefficient. The results obtained show that αp increases with the increment in the alkyl chain length of both cation and anion. Moreover, it is also possible to verify that the effect of increasing from the alkyl chain attached to the imidazolium cation from C2H5 to C8H17 is less than half of the obtained by changing from CF3 to C4F9 in the anion.
Measurements of the refractive index (experimental data in Table S3 of the ESI†) provide us with useful information about the forces between molecules as well as their behaviour in solution.43 The refractive index can be used as a measure of the electronic polarizability of a molecule and can provide useful information when studying the forces between molecules or their behaviour in solution.43 The Lorenz–Lorentz equation relates the electronic polarizability, αe, with the refractive index, nD, and can also be expressed in terms of the molar refraction, or molar polarizability,44 Rm, using the expression:
 | (7) |
The values of the molar refractions of these FILs were calculated and are listed in Table S6 of the ESI† together their molar volumes. As expected, both molar refractions and molar volumes increase with the increment of hydrogenated and/or fluorinated alkyl chain lengths. The very strong C–F bonds existents in FILs could cause an increment in rigidity of the molecular structure and a decrease in polarity. These two properties, molar refractions and molar volumes, present slightly greater values for FILs based on the sulfonate anion with the same cation than for FILs based on the carboxylate anion: [C2C1Im][C4F9SO3] > [C2C1Im][C4F9CO2] and [C8C1Im][C4F9SO3] > [C8C1Im][C4F9CO2].
To ease the prediction of molar volumes and densities of novel ionic liquids, a simple, albeit precise method, was established by Rebelo et al.45–48 Table 2 shows the effective molar volumes of distinct fluorinated anions, V*a, that were obtained in this work and the equivalent effective molar volumes of their corresponding hydrogenated counterparts. The average increase in volume per CH2 group is 17.1 cm3 mol−1 which compares well with the 17.2 cm3 mol−1 found in literature.45 The experimental data show that the average increment in volume for each CF2 group is 26.1 cm3 mol−1. This increment is independent of the nature of the anions (perfluorosulfonates or perfluorocarboxylates). Moreover, replacing a CH3 group by a CF3 one in the anion increases the molar volume of the ionic liquid for about 21.5 cm3 mol−1. Interestingly, if one takes our already published effective molar volume of the anion [C4H9SO3]−, 117.9 cm3 mol−1, remove three CH2 groups, add three CF2 groups and add the change in volume from CH3 to CF3 group, we obtain a molar volume of 166.4 cm3 mol−1, for the anion [C4F9SO3]− which perfectly matches our experimental data.
| IL anion | V*a/cm3 mol−1 | IL anion46 | V*a/cm3 mol−1 |
|---|---|---|---|
| [CF3SO3]− | 88.1 | [CH3SO3]− | 66.5 |
| [C4F9SO3]− | 166.4 | [C4H9SO3]− | 117.9 |
| [CF3CO2]− | 74.3 | [CH3CO2]− | 53.0 |
| [C4F9CO2]− | 152.5 |
Since we are dealing with fluorinated ionic liquids and the calculation of the CF2 contribution for their molar volume, we have decided to check how this contribution relates to that in perfluoroalkane molecules. The main difference is that for molecular species the comparisons must be performed at the same reduced temperature, Tr.49 The results for perfluoroalkanes using already published density data50 show that the molar volume increases per CF2 group added is dependent on the selected reduced temperature and varies from 30.3 cm3 mol−1 at a Tr = 0.66 to 27.7 at a Tr = 0.55, which is the lower limit in terms of temperature for which there is relevant data. This trend is compatible with the value of 26.1 cm3 mol−1, found for the CF2 contribution in FILs. It also corroborates the previously found relations and trends between the CH2 contributions in ILs, alkanes and n-alkanols.49
Ionicity
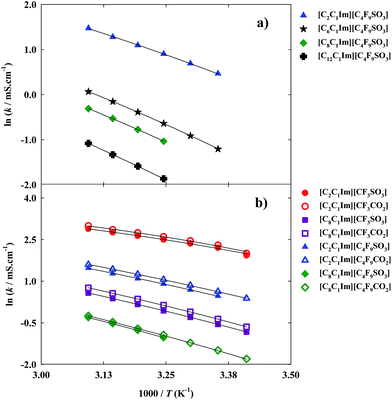
Ionicity is also an important transport property for industrial applications.11 This property establishes a relationship between the molar electrical conductivity (calculated from the ionic conductivity) and the viscosity (Fig. 3) of a solution. The temperature dependence of the ionic conductivity (experimental data in Table S3 of the ESI†) was also fitted using the VFT equation:
 | (8) |
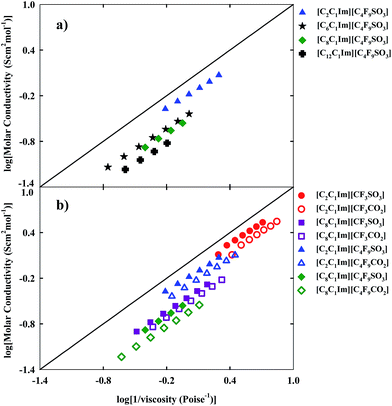
Ionicity provides us with useful information about transport properties, mobility and the possible formation of aggregates. The presence of aggregates may decrease the mobility and the molar conductivity of FILs and increase their viscosity, obtaining an ionic behaviour away from the ideal electrolyte. The ionicity of inorganic salts and ionic liquids can be represented by the Walden plot which establishes a relationship between the molar conductivity and the fluidity (inverse of viscosity) of a fluid.51,52 In the case of an ideal FIL conductor, conductivity is only influenced by the viscosity.53 The black straight line of Fig. 7, fixes the position of the “ideal” electrolyte (aqueous potassium chloride solution) which is fully dissociated and does have ions of equal mobility.54
Depending on the position occupied by the FIL, close to or far from the ideal electrolyte, and according to the classification proposed by Angel and co-workers, the FIL could be considered either a “good” or a “poor” ionic fluid.55 The analysis of the studied matrix (see Fig. 1) for ionicity enables us to consider that for the increment of the hydrogenated and fluorinated alkyl chain lengths, the ionicity of the FIL decreases and there are divergences to the behaviour of the ideal electrolyte. The Walden plot shows a linear behaviour with temperature for each FIL, as expected. Another conclusion is that FILs based on the carboxylate anion are more far away from the ideal electrolyte, in contrast with the higher ionicity of FILs based on sulfonate anions combined with identical imidazolium cations.
Structural analysis using MD simulation data
In order to rationalize at a molecular level the bulk thermophysical properties of the different ionic liquids, we have conducted a series of Molecular Dynamics (MD) simulations on eight of the eleven systems: four systems belong to the homologous series [CnC1Im][C4F9SO3] (n = 2, 6, 8, 12); two other systems, combined with two systems from the previous set, form the four-sided arrangement [CnC1Im][CmF2m+1SO3] (n = 2, 8; m = 1, 4) depicted in Fig. 1b; finally, the last two are based on carboxylate anions, [C2C1Im][CmF2m+1CO2] (m = 1, 4).Global structure factor functions and overall structure
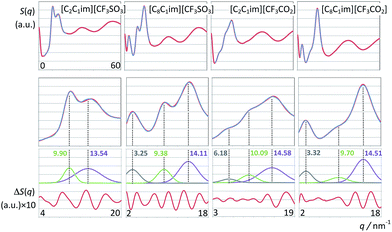
Fig. 8 and 9 depict the global structure factor functions, S(q), calculated via the appropriate Fourier transforms of the pair correlation functions obtained from the MD trajectories (see MD simulation details sub-section). The graphs in the top row of each figure show the S(q) functions in the studied q-value range (0 < q/nm−1 < 60); those in the second row focus on the low-q region (for q < 20 nm−1), which corresponds to intermolecular structural features. The graphs in the bottom rows show the deconvolution of the low-q peaks present in each case and the corresponding fitting deviations.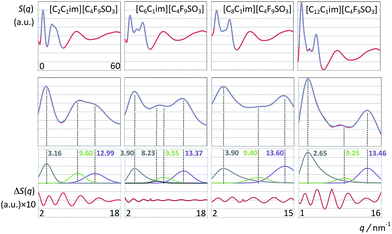 | ||
| Fig. 9 Structure factor functions, S(q), of imidazolium-based ionic liquids combined with the perfluorobutanesulfonate anion, graphs as in Fig. 8. | ||
First we consider the [C2C1Im][CF3SO3] system (Fig. 8, left column). The deconvolution of the two low-q peaks yields two Gaussian functions centered at 9.90 and 13.54 nm−1, corresponding to the so-called charge-ordering peak (COP) and the contact peak (CP), respectively.
The q-value of the contact peak (CP) is related in real space to distances between neighboring atoms belonging to different ions. It broadly defines the boundary between intra- and intermolecular structural features and is a general structural feature present in most ionic liquids and molecular fluids.
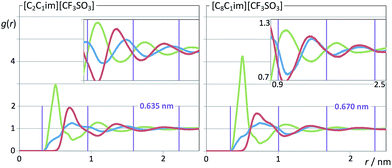
On the other hand, the charge-ordering peak (COP) is a distinctive feature of ionic liquids or molten salts.27,30,56–63 It stems from the fact that in order to establish local electro-neutrality conditions each ion in an ionic liquid is surrounded by counter-ions and vice versa. Such three-dimensional network of alternate ions—the so-called polar network—will exhibit correlation functions between pairs of ions with opposite charge and pairs of ions with the same charge that are in opposition of phase to each other and have unique characteristic wavelengths (cf. Fig. 9–11). In reciprocal space such wavelengths (0.635 nm for [C2C1Im][CF3SO3]) will correspond to the q value of the COP peak (9.90 = 2π/0.635). It must be stressed that the correlations between same-charged ions and opposite-charged ions contribute with different signs for the emergence of the COP peak.60,61 In some ionic liquids (not [C2C1Im][CF3SO3]) the COP can be almost absent not because there is no polar network, but simply because the contributions from the different charge–charge correlations are canceling each other.64
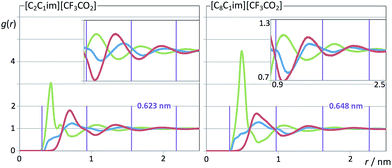 | ||
| Fig. 11 Pair radial distribution functions, g(r), for two perfluoroethanoate-based ionic liquids. Graphs as in Fig. 10. | ||
When one moves from the [C2C1Im][CF3SO3] to the [C8C1Im][CF3SO3] system, a new, distinctive low-q peak appears at 3.25 nm−1 (Fig. 8, second column from the right). The new peak is the so-called pre-peak or polar–nonpolar peak (PNPP) and is a consequence of nano-segregation occurring in the ionic liquid, between its polar network and nonpolar domains formed by the nonpolar moieties of the molecular ions (the octyl side chains in the case of [C8C1Im][CF3SO3]). The q-value of the PNPP is related in real space to distances between different polar networks strands separated by nonpolar regions (d = 1.93 nm = 2π/0.325). The absence of a PNPP in the [C2C1Im][CF3SO3] system is a consequence of the fact that the volume occupied by the nonpolar domains (the ethyl moieties of the cation) is too small to cause the effective separation of the polar networks into different strands.
The comparison between the [C2C1Im][CF3SO3] and the [C8C1Im][CF3SO3] systems also shows that there are small shifts in the positions of the CP and the COP. The CP shifts can be attributed to a different composition of the sample (a higher proportion of hydrogenated moieties). The COP position shifts to lower q-values (from 9.90 to 9.38 nm−1) which mean that the characteristic distances within the polar network are increasing. It was shown in previous discussions30,56,63 that this fact is a consequence of the stretching of the polar network that needs to accommodate bulkier nonpolar domains without disrupting itself.
When the [CF3SO3]− anion is replaced by the smaller [CF3CO2]− anion in the two previously discussed systems (Fig. 8, two right-most columns) a couple of observations can be made: (i) the corresponding COPs are shifted to greater q-values; (ii) a small pre-peak shoulder is visible even for [C2C1Im][CF3CO2].
The COPs shifts are straightforward to explain: smaller ions will produce a polar network with smaller characteristic distances and higher COP q-values. The shift of the COP to higher q-values combined with the fact that the volume occupied by the non-polar domains in [C2C1Im][CF3CO2] is greater than that in [C2C1Im][CF3SO3] allows the observation of an incipient PNP shoulder at 6.18 nm−1.
The relation between S(q) low-q peaks and the structure of ionic liquids have been explored in the past for different homologous series with increasing alkyl side chains in the cation.30,56,63 In this work we can analyze the effect of having a long fluorinated alkyl side chain in the anion (Fig. 9). The S(q) function of the [C2C1Im][C4F9SO3] system exhibits three peaks at 3.16, 9.60 and 12.99 nm−1 (Fig. 9, left column), corresponding to the usual PNPP, COP and CPs. In the present case the PNPP must originate from the perfluorobutyl chain in the anion since the ethyl moiety in the cation is too small to yield a prominent PNPP (no PNPP is present in [C2C1Im][CF3SO3]).
The well-defined PNPPs in the [C8C1Im][CF3SO3] and [C2C1Im][C4F9SO3] systems are both the result of an effective separation between polar network strands. However those separations are caused by different nonpolar regions: octyl-based hydrogenated nonpolar domains in the case of [C8C1Im][CF3SO3]; perfluorobutyl-based fluorinated nonpolar domains in the case of [C2C1Im][C4F9SO3].
What if both the cation and the anion have long alkyl/perfluoroalkyl chains? The three left-most columns in Fig. 9 all show PNPPs. The difference is that none of them can be deconvoluted by simple Gaussian functions. In the case of [C8C1Im][C4F9SO3] and [C12C1Im][C4F9SO3] (where the alkyl chain is markedly larger than the perfluorobutyl chain) the PNPP can be fitted to a Gaussian function with an exponential decay. This means that the polar network strands are being separated not by distances based on a single characteristic distance but rather by nonpolar domains that contain nonpolar moieties of different length. The longer nonpolar moiety probably defines the q-value of the PNPP whereas the shorter moiety contributes to its exponential decay. In the case of the [C6C1Im][C4F9SO3] the two nonpolar moieties have similar lengths and the overall curve fitting of the low-q S(q) function had to be performed using four distinct fitting functions (CP, COP plus two PNPP). This suggests that not only the polar network is being effectively segregated from the non-polar regions but that there is also some degree of segregation between nonpolar domains (cf. aggregate analysis subsection below).
It must be stressed at this point that the fitting of the low-q S(q) functions with multiple complex functions was performed taking into account the position of the COP peak for each type of system. We have seen that there is a very strong link between the position of the COP and the correlation functions, g(r), between pairs of same-charge or opposite-charge ions. In order to avoid consistency problems associated with multi-peak fitting redundancies we have always checked that the characteristic wavelength of the charge-ordering g(r) functions of a given system and the position of the fitted COP peak were coherent. This is shown in Fig. 10–12, where the corresponding charge-ordering g(r) functions are depicted. A grid representing the characteristic wavelength for each system, obtained from the fitted COP values, is superimposed with the correlation functions and confirms the consistency of the fitting methodology.
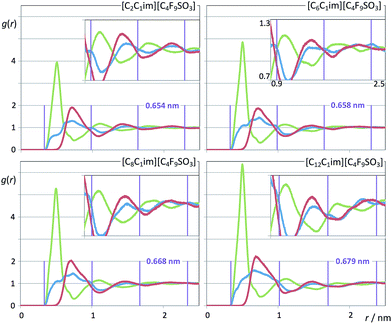 | ||
| Fig. 12 Pair radial distribution functions, g(r), for four perfluorobutanesulfonate-based ionic liquids. Graphs as in Fig. 10. | ||
In summary, both the hydrogenated and perfluorinated nonpolar moieties, if long enough, are able to promote an effective segregation between the polar network and the nonpolar regions of the ionic liquids under discussion. The presence of PNPPs reveals such ability: none in [C2C1Im][CF3SO3]; one simple peak in [C8C1Im][CF3SO3] caused by the octyl moieties; one simple peak in [C2C1Im][C4F9SO3] caused by the perfluorobutyl moieties; one complex peak in [C8C1Im][C4F9SO3] caused by the presence of both octyl and perfluorobutyl moieties.
To further study the segregation between hydrogenated and perfluorinated domains in systems with both types of nonpolar moieties it will be necessary to conduct a more selective study both in terms of correlation functions and aggregation analysis. This will be performed taking into account the six sulfonate-based systems.
Partial correlation functions and aggregate analysis
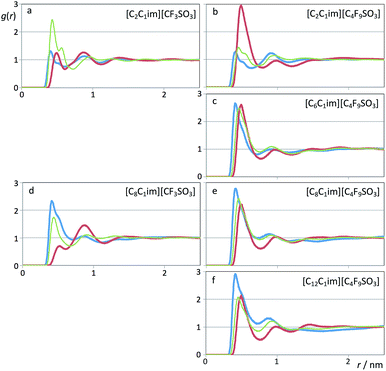
In previous studies65–68 several authors related the effective segregation of nonpolar domains within different ionic liquids to the pair correlation functions between the atoms at the end of the alkyl side chains.Fig. 13 shows pair radial distribution functions, g(r)s, between selected atoms at the end of the hydrogenated alkyl side chain of the cation (methyl carbon atoms, blue lines) and at the end of the fluorinated side chain of the anion (perfluoromethyl carbon atoms, red lines) for the six systems under discussion.
The calculated g(r) trends are quite straightforward if one considers the quartet formed by [CnC1Im][CmF2m+1SO3] (n = 2 and 8, m = 1 and 4, first and third rows of Fig. 13): no segregated nonpolar domains in (n = 2, m = 1), segregated hydrogenated chains in (8, 1), segregated fluorinated chains in (2, 4) and segregation of hydrogenated and fluorinated domains in (8, 4).
On the other hand, if one analyzes the [CnC1Im][C4F9SO3] homologous series with n = 2, 6, 8 and 12 (right column of Fig. 13), one sees an increase of the correlations between the terminal carbon atoms of the hydrogenated chains and the concomitant decrease of the correlations between the terminal carbon atoms of the fluorinated chains.
These trends are entirely consistent with the emergence and nature of the different PNPPs discussed in the previous sub-section.
The next question is to know if those nonpolar domains are intermingled or not. The thin green lines in Fig. 13 represent the pair distribution functions between terminal carbon atoms belonging to the two distinct types of chain. Except for the [C2C1Im][CF3SO3] system, the correlations between terminal atoms of different chains are always lower than the correlation between the atoms belonging to the dominant type of aggregate.
The exception noted for the [C2C1Im][CF3SO3] system case is quite simple to explain: since the side chains are too short, their arrangement is dictated by the alternate ionic character of the polar network. This means that most ethyl groups will be adjacent to perfluoromethyl groups, i.e. the g(r) first peak of the correlation between the terminal carbon atoms belonging to different chains (–CH2![[C with combining low line]](https://www.rsc.org/images/entities/char_0043_0332.gif) H3 and –
H3 and –![[C with combining low line]](https://www.rsc.org/images/entities/char_0043_0332.gif) F3) will be larger relative to the correlation between terminal carbon atoms belonging to the same type of chain. The two types of nonpolar “domain” are effectively intermingled due to their proximity to the polar network.
F3) will be larger relative to the correlation between terminal carbon atoms belonging to the same type of chain. The two types of nonpolar “domain” are effectively intermingled due to their proximity to the polar network.
In the other five studied cases, the intermediate character of the cross correlation relative to the two self-correlations (lower than the dominant type of self-correlation, similar or slightly larger than the other self-correlation) suggests that apart from the segregation between the polar network and the nonpolar domains, there is also some degree of segregation between fluorinated and hydrogenated domains.
To further elucidate such idea we have performed an aggregation analysis based on the interconnectivity of the different chains present in each system. The results are given in Fig. 14 as discrete probability distribution histograms of nonpolar aggregate sizes, P(na), as a function of aggregate size number, na.
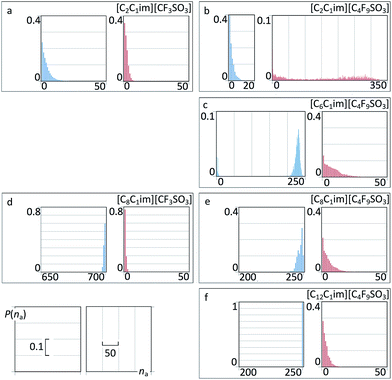 | ||
| Fig. 14 Discrete probability distribution functions of nonpolar aggregate sizes, P(na), as a function of aggregate size number, na, for six perfluoroalkylsulfonate ionic liquids. For comparison purposes, the graphs occupy the same positions as those in Fig. 13. | ||
For [C2C1Im][CF3SO3] there are only small nonpolar aggregates dispersed in the midst of the polar network (Fig. 14a and 15a). Interestingly the ethyl groups are able to form larger aggregates than their perfluoromethyl counterparts.
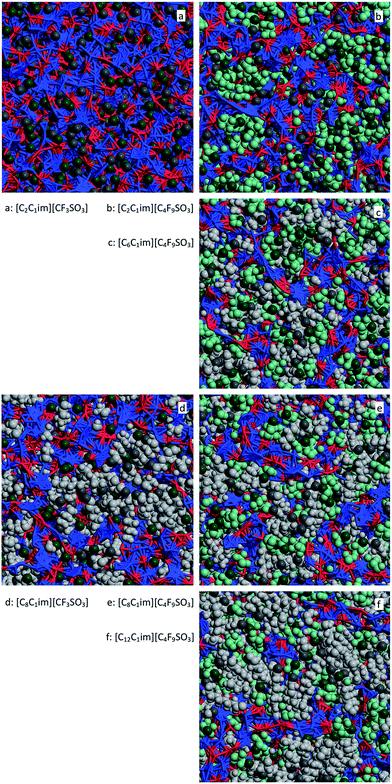 | ||
| Fig. 15 MD simulation snapshots for six perfluoroalkylsulfonate-based ionic liquids. The sides of the squares have a length of 5.1 nm. For comparison purposes, the graphs occupy the same positions as those in Fig. 13. Red and blue segments represent interactions within the polar network, light gray and light green space-filled areas represent the alkyl and perfluoroalkyl nonpolar domains, respectively. Dark gray and dark green spheres locate the positions of the terminal methyl and perfluoromethyl of the two types of chain, respectively. | ||
For [C8C1Im][CF3SO3] (Fig. 14d and 15c) there is a continuous hydrogenated nonpolar sub-phase: the 700 octyl chains present in the system are gathered most of the time into a single aggregate spanning the entire simulation box. Together with the polar network this nonpolar domain forms a bicontinuous structure, characteristic of many ionic liquids containing long alkyl side chains. Such arrangement produces the partial disruption of the polar network and the emergence of polar strands separated by non-polar regions, which in turns causes the appearance of the corresponding S(q) PNPPs.
The perfluoromethyl groups form smaller aggregates in [C8C1Im][CF3SO3] than in [C2C1Im][CF3SO3] due to the smaller volume fraction occupied by the polar network to which they are directly attached. In terms of the g(r) functions presented in Fig. 13d this fact has an interesting consequence: the cross function is significantly larger than the corresponding self-function involving the perfluoromethyl carbon atoms. This can be explained by the fact that the isolated perfluoromethyl groups surrounding the polar network will be righty at the interface between the polar and nonpolar domains. This means that the probability of one perfluoromethyl group contacting an octyl terminal carbon will be greater than that of finding another perfluoromethyl group.
One could assume that the [C2C1Im][C4F9SO3] system (Fig. 14b and 15b) would be a counterpart of the [C8C1Im][CF3SO3] system, with the long perfluorobutyl chains replacing the role of the long octyl chains. In part this is true: the P(na) functions show small hydrogenated aggregates and large fluorinated ones. However, around 60% of the hydrogenated aggregates contain 2 to 10 octyl chains, whereas 80% of the corresponding fluorinated aggregates in [C2C1Im][C4F9SO3] are single –CF3 groups. Again, the ethyl groups seem more versatile in terms of aggregation than their perfluoromethyl counterparts. One of the consequences of the improved ethyl clustering is that there will be a better segregation between the perfluorobutyl nonpolar domains and the small ethyl clusters, as shown in the cross g(r) function of Fig. 13b and in the simulation snapshot of Fig. 15b.
Another difference between the octyl aggregates in [C8C1Im][CF3SO3] and the perfluorobutyl aggregates in [C2C1Im][C4F9SO3] is that in the former case almost all octyl chains belong to a single nonpolar cluster percolating the entire simulation box, whereas in the case of the [C2C1Im][C4F9SO3] we are just at the threshold of such percolating event. This can be confirmed by the large distribution of aggregate sizes, which means that not all perfluorobutyl chains belong to a single cluster but rather to different intermediate-sized clusters. This state of affairs is simply motivated by the fact that the C4F9 chains are not long or bulky enough to overcome effectively the bicontinuous segregation threshold. A case in point is the fact that for most [CnC1Im]-based ionic liquid families such threshold is generally only attained around the n = 5–6 range.
Finally one can follow the [CnC1Im][C4F9SO3] (n = 6, 8, 12) sequence where hydrogenated and fluorinated domains will co-exist. Three issues become apparent when looking at the P(na) functions depicted in Fig. 14c, e and f: (i) the hydrogenated nonpolar clusters are continuous whereas the fluorinated ones are not; (ii) the presence of the fluorinated clusters interferes with the continuity of the hydrogenated domains (cf. for instance the octyl aggregate distributions in Fig. 14d and e); and (iii) a more balanced situation between fluorinated and hydrogenated domains probably would occur for [C5C1Im][C4F9SO3] (a system that was not studied experimentally and will not be considered in this work).
The main conclusion to be drawn from the data is that the cross correlations within these three systems are always lower than the average of the two pure correlations (Fig. 13c, e and f). This seems to confirm some level segregation between the hydrogenated and fluorinated domains, albeit smaller than in the [C2C1Im][C4F9SO3], as can be seen in the different snapshots of Fig. 15.
Conclusions
In the present work, the thermal and thermophysical properties, namely, their melting and decomposition temperatures, ionic conductivity, density, dynamic viscosity, and refractive index, were determined for fluorinated ionic liquids with different alkyl and perfluoroalkyl side chains. A comparison between FILs based on perfluoroalkylsulfonate and perfluoroalkylcarboxylate anions was also performed. The analysis of the results shows a strong dependency of these properties when the alkyl and perfluoroalkyl side chains increase. Furthermore, FILs based on carboxylate anion show lower decomposition temperatures, density and ionicity but higher fluidity when compared with FILs based on the sulfonate anion.Moreover, molecular dynamic studies demonstrate that the effective segregation between the polar network and the nonpolar regions of these FILs is different for hydrogenated and perfluorinated nonpolar moieties. Furthermore, there is also some degree of segregation between fluorinated and hydrogenated domains. The short alkyl chains of imidazolium cation are more versatile in terms of aggregation then their perfluoromethyl counterparts. Perfluorobutyl chains are not long or bulky enough to overcome effectively the bicontinuous segregation threshold. In addition, the fluorinated clusters interfere with the continuity of the hydrogenated domains.
Acknowledgements
The authors thank FCT/MEC (Portugal) for financial support through grants SFRH/BD/100563/2014 (N. S. M. V.) and SFRH/BPD/94291/2013 (K. S.), FCT Investigator contracts (A. B. P., J. M. M. A., I. M. M. and J. M. S. S. E) and through projects PTDC/CTM-NAN/121274/2010, FCT-ANR/CTM-NAN/0135/2012, PTDC/EQU-FTT/118800/2010, UID/QUI/00100/2013 and UID/Multi/04551/2013. The NMR spectrometers are part of The National NMR Facility, supported by FCT/MEC (RECI/BBB-BQB/0230/2012).Notes and references
- S. Aparicio, M. Atilhan and F. Karadas, Ind. Eng. Chem. Res., 2010, 49, 9580 CrossRef CAS.
- I. M. Marrucho, L. C. Branco and L. P. N. Rebelo, Annu. Rev. Chem. Biomol. Eng., 2014, 5, 527 CrossRef CAS PubMed.
- H. Olivier-Bourbigou and L. Magna, J. Mol. Catal. A: Chem., 2002, 419, 182 Search PubMed.
- N. V. Plechkova and K. R. Seddon, Chem. Soc. Rev., 2008, 37, 123 RSC.
- R. Ferraz, L. C. Branco, I. M. Marrucho, J. M. M. Araújo, L. P. N. Rebelo, M. N. Ponte, C. Prudêncio, J. P. Noronha and Z. Petrovski, MedChemComm, 2012, 3, 494 RSC.
- C. Florindo, J. M. M. Araújo, F. Alves, C. Matos, R. Ferraz, C. Prudêncio, J. P. Noronha, Z. Petrovski, L. Branco, L. P. N. Rebelo and I. M. Marrucho, Int. J. Pharm., 2013, 456, 553 CrossRef CAS PubMed.
- J. Stoimenovski, D. R. MacFarlane, K. Bica and R. D. Rogers, Pharm. Res., 2010, 27, 521 CrossRef CAS PubMed.
- M. J. Earle, J. M. S. S. Esperança, M. A. Gilea, J. N. C. Lopes, L. P. N. Rebelo, J. W. Magee, K. R. Seddon and J. A. Widegren, Nature, 2006, 439, 831 CrossRef CAS PubMed.
- R. D. Rogers and K. R. Seddon, Science, 2003, 32, 792 CrossRef PubMed.
- J. Ranke, S. Stolte, R. Störmann, J. Arning and B. Jastorff, Chem. Rev., 2007, 107, 2183 CrossRef CAS PubMed.
- A. B. Pereiro, J. M. M. Araújo, S. Martinho, F. Alves, S. Nunes, A. Matias, C. M. M. Duarte, L. P. N. Rebelo and I. M. Marrucho, ACS Sustainable Chem. Eng., 2013, 1, 427 CrossRef CAS.
- A. B. Pereiro, M. J. Pastoriza-Gallego, K. Shimizu, I. M. Marrucho, J. N. C. Lopes, M. M. Piñeiro and L. P. N. Rebelo, J. Phys. Chem. B, 2013, 117, 10826 CrossRef CAS PubMed.
- A. B Pereiro, L. C. Tomé, S. Martinho, L. P. N. Rebelo and I. M. Marrucho, Ind. Eng. Chem. Res., 2013, 52, 4994 CrossRef.
- M. J. Pratas de Melo, A. M. A. Dias, M. Blesic, L. P. N. Rebelo, L. F. Vega, J. A. P. Coutinho and I. M. Marrucho, Fluid Phase Equilib., 2006, 242, 210 CrossRef CAS PubMed.
- A. B. Lindstrom, M. J. Strynar and E. L. Libelo, Environ. Sci. Technol., 2011, 45, 7954 CrossRef CAS PubMed.
- D. Almantariotis, T. Gefflaut, H. Pádua, J.-Y. Coxam and M. F. C. Gomes, J. Phys. Chem. B, 2010, 114, 3608 CrossRef CAS PubMed.
- M. J. Muldoon, S. N. V. K. Aki, J. L. Anderson, J. K. Dixon and J. F. Brennecke, J. Phys. Chem. B, 2007, 111, 9001 CrossRef CAS PubMed.
- K. Fukumoto, M. Yoshizawa and H. Ohno, J. Am. Chem. Soc., 2005, 127, 2398 CrossRef CAS PubMed.
- J. M. M. Araújo, C. Florindo, A. B. Pereiro, N. S. M. Vieira, A. A. Matias, C. M. M. Duarte, L. P. N. Rebelo and I. M. Marrucho, RSC Adv., 2014, 4, 28126 RSC.
- A. B. Pereiro, J. M. M. Araújo, F. S. Oliveira, C. E. S. Bernardes, J. M. S. S. Esperança, J. N. C. Lopes, I. M. Marrucho and L. P. N. Rebelo, Chem. Commun., 2012, 48, 3656 RSC.
- J. N. C. Lopes, J. Deschamps and A. A. H. Pádua, J. Phys. Chem. B, 2004, 108, 2038 CrossRef CAS.
- J. N. C. Lopes and A. A. H. Pádua, J. Phys. Chem. B, 2004, 108, 16893 CrossRef CAS.
- J. N. C. Lopes and A. A. H. Pádua, Theor. Chem. Acc., 2012, 131, 1129 CrossRef.
- W. L. Jorgensen, D. S. Maxwell and J. Tirado-Rives, J. Am. Chem. Soc., 1996, 118, 11225 CrossRef CAS.
- W. Smith and T. R. Forester, The DL_POLY Package of Molecular Simulation Routines (v.2.2), The Council for The Central Laboratory of Research Councils, Daresbury Laboratory, Warrington, 2006 Search PubMed.
- D. Chandler, Introduction to Modern Statistical Mechanics 7.3, Oxford University Press, 1987, pp. 195–201 Search PubMed.
- K. Shimizu, C. E. S. Bernardes, A. Triolo and J. N. C. Lopes, Phys. Chem. Chem. Phys., 2013, 15, 16256 RSC.
- P. J. Brown, A. G. Fox, E. N. Maslen, M. A. O’Keefe and T. M. Willis, International Tables for Crystallography, ed. E. Prince, International Union of Crystallography, Dordrecht, 2004, vol. C, pp. 554–595 Search PubMed.
- E. Lorch, J. Phys. C: Solid State Phys., 1969, 2, 229 Search PubMed.
- K. Shimizu, C. E. S. Bernardes and J. N. C. Lopes, J. Phys. Chem. B, 2014, 118, 567 CrossRef CAS PubMed.
- C. E. S. Bernardes, M. E. Minas da Piedade and J. N. C. Lopes, J. Phys. Chem. B, 2011, 115, 2067 CrossRef CAS PubMed.
- S. Gupta and J. D. Olson, Ind. Eng. Chem. Res., 2003, 42, 6359 CrossRef CAS.
- J. M. P. França, C. A. N. Castro, M. M. Lopes and V. M. B. Nunes, J. Chem. Eng. Data, 2009, 54, 2569 CrossRef.
- H. Rodríguez and J. F. Brennecke, J. Chem. Eng. Data, 2006, 51, 2145 CrossRef.
- J. M. Vuksanovica, M. S. Caladob, G. R. Ivanisa, M. Lj. Kijevcanina, S. P. Serbanovica and Z. P. Visakb, Fluid Phase Equilib., 2013, 352, 100 CrossRef PubMed.
- M. G. Freire, A. R. R. Teles, M. A. A. Rocha, B. Schroder, C. M. S. S. Neves, P. J. Carvalho, D. V. Evtuguin, L. M. N. B. F. Santos and J. A. P. Coutinho, J. Chem. Eng. Data, 2011, 56, 4813 CrossRef CAS.
- G. D. Smith, O. Borodin, J. J. Magda, R. H. Boyd, Y. Wang, J. E. Bara, S. Miller, D. L. Gin and R. D. Noble, Phys. Chem. Chem. Phys., 2010, 12, 7064 RSC.
- H. Xue and J. M. Shreeve, Eur. J. Inorg. Chem., 2005, 13, 2573 CrossRef PubMed.
- E. Vercher, A. V. Orchillés, F. J. Llopis, V. Gonzalez-Alfaro and A. Martínez-Andreu, J. Chem. Eng. Data, 2011, 56, 4633 CrossRef CAS.
- K. N. Marsh, J. F. Brennecke, R. D. Chirico, M. Frenkel, A. Heintz, J. W. Magee, C. J. Peters, L. P. N. Rebelo and K. R. Seddon, Pure Appl. Chem., 2009, 81, 781 CrossRef CAS.
- R. D. Chirico, V. Diky, J. W. Magee, M. Frenkel and K. N. Marsh, Pure Appl. Chem., 2009, 81, 791 CrossRef CAS.
- B. E. M. Tsamba, S. Sarraute, M. Traïkia and P. Husson, J. Chem. Eng. Data, 2014, 59, 1747 CrossRef.
- M. Tariq, P. A. S. Forte, M. F. C. Gomes, J. N. C. Lopes and L. P. N. Rebelo, J. Chem. Thermodyn., 2009, 41, 790 CrossRef CAS PubMed.
- M. R. Moldover, Measurement of the Thermodynamic Properties of Single Phases, in IUPAC Experimental Thermodynamics, Elsevier, 2008, vol. VI, pp. 435–451 Search PubMed.
- L. P. N. Rebelo, V. Najdanovic-Visak, R. Gomes de Azevedo, J. M. S. S. Esperança, M. N. Ponte, H. J. R. Guedes, Z. P. Visak, H. C. Sousa, J. Szydlowski, J. N. C. Lopes and T. C. Cordeiro, in Ionic Liquids, IIIA: Fundamentals, Progress, Challenges, and Opportunities-Properties and Structure, ACS Symposium Series 901, ed. R. D. Rogers and K. R. Seddon, American Chemical Society, Washington DC, 2005, pp. 270– 291 Search PubMed.
- J. M. S. S. Esperança, H. J. R. Guedes, M. Blesic and L. P. N. Rebelo, J. Chem. Eng. Data, 2006, 51, 237 CrossRef.
- L. P. N. Rebelo, J. N. C. Lopes, J. M. S. S. Esperança, H. J. R. Guedes, J. Lachwa, V. Najdanovic-Visak and Z. P. Visak, Acc. Chem. Res., 2007, 40, 1114 CrossRef CAS PubMed.
- A. J. L. Costa, M. R. C. Soromenho, K. Shimizu, I. M. Marrucho, J. M. S. S. Esperança, J. N. C. Lopes and L. P. N. Rebelo, ChemPhysChem, 2012, 13, 1902 CrossRef CAS PubMed.
- G. Adamová, J. N. C. Lopes, L. P. N. Rebelo, L. M. N. B. Santos, K. R. Seddon and K. Shimizu, Phys. Chem. Chem. Phys., 2014, 16, 4033 RSC.
- P. Morgado, J. Ben Lewis, C. M. C. Laginhas, L. F. G. Martins, C. McCabe, F. J. Blas and E. J. M. Filipe, J. Phys. Chem. B, 2011, 115, 15013 CrossRef CAS PubMed.
- A. B Pereiro, J. M. M. Araújo, F. S. Oliveira, J. M. S. S. Esperança, J. N. C. Lopes, I. M. Marrucho and L. P. N. Rebelo, J. Chem. Thermodyn., 2012, 55, 29 CrossRef PubMed.
- K. R. Harris, J. Phys. Chem. B, 2010, 1, 9572 CrossRef PubMed.
- N. Papaiconomou, O. Zech, P. Bauduin, J. M. Lévêque and W. Kunz, Electrochim. Acta, 2012, 70, 124 CrossRef CAS PubMed.
- M. S. Miran, H. Kinoshita, T. Yasuda, M. A. B. H. Susan and M. Watanabe, Phys. Chem. Chem. Phys., 2012, 14, 5178 RSC.
- W. Xu, E. I. Cooper and C. A. Angell, J. Phys. Chem. B, 2003, 107, 6170 CrossRef CAS.
- C. E. S. Bernardes, K. Shimizu, A. I. M. C. L. Ferreira, L. M. N. B. F. Santos and J. N. C. Lopes, J. Phys. Chem. B, 2014, 118, 6885 CrossRef CAS PubMed.
- M. A. A. Rocha, C. M. S. S. Neves, M. G. Freire, O. Russina, A. Triolo, J. A. P. Coutinho and L. M. N. B. F Santos, J. Phys. Chem. B, 2013, 117, 10889 CrossRef CAS PubMed.
- O. Russina, A. Triolo, L. Gontrani, R. Caminiti, D. Xiao, L. G. Hines Jr., R. A. Bartsch, E. L. Quitevis, N. Plechkova and K. R. Seddon, J. Phys.: Condens. Matter, 2009, 21, 424121 CrossRef.
- A. Triolo, O. Russina, H. Bleif and E. Di Cola, J. Phys. Chem. B, 2007, 111, 4641 CrossRef CAS PubMed.
- H. V. R. Annapureddy, H. K. Kashyap, P. M. De Biase and C. J. Margulis, J. Phys. Chem. B, 2010, 114, 16838 CrossRef CAS PubMed.
- H. K. Kashyap, J. J. Hettige, H. V. R. Annapureddya and C. J. Margulis, Chem. Commun., 2012, 48, 5103 RSC.
- A. Triolo, O. Russina, B. Fazio, R. Triolo and E. Di Cola, Chem. Phys. Lett., 2008, 457, 362 CrossRef CAS PubMed.
- K. Shimizu and J. N. C. Lopes, J. Mol. Liq., 2015 DOI:10.1016/j.molliq.2015.04.014.
- A. A. Freitas, K. Shimizu and J. N. C. Lopes, J. Chem. Eng. Data, 2014, 59, 3120 CrossRef CAS.
- S. M. Urahata and M. C. C. Ribeiro, J. Chem. Phys., 2004, 120, 1855 CrossRef CAS PubMed.
- Y. Wang and G. A. Voth, J. Am. Chem. Soc., 2005, 127, 12192 CrossRef CAS PubMed.
- A. A. H. Pádua and J. N. C. Lopes, J. Phys. Chem. B, 2006, 110, 3330 Search PubMed.
- M. A. A. Rocha, C. F. R. A. C. Lima, L. R. Gomes, B. Schröder, J. A. P. Coutinho, I. M. Marrucho, J. M. S. S. Esperança, L. P. N. Rebelo, K. Shimizu, J. N. C. Lopes and L. M. N. B. F. Santos, J. Phys. Chem. B, 2011, 115, 10919 CrossRef CAS PubMed.
Footnote |
| † Electronic supplementary information (ESI) available: The ESI contains the synthesis and characterization of novel FILs and experimental data of thermal properties, density, viscosity, refractive index and ionic conductivity. Moreover, the fitting parameters of these properties and values of molar volume and molar refraction are also showed. See DOI: 10.1039/c5ra13869h |
| This journal is © The Royal Society of Chemistry 2015 |

