MoS2–graphene nanosheet–CNT hybrids with excellent electrochemical performances for lithium-ion batteries

Fusen Pana, Jiaqing Wanga, Zhenzhong Yangc, Lin Guc and Yan Yu*ab
aKey Laboratory of Materials for Energy Conversion, Chinese Academy of Sciences, Department of Materials Science and Engineering, University of Science and Technology of China, Hefei, Anhui Province 230026, China. E-mail: yanyumse@ustc.edu.cn
bState Key Laboratory of Fire Science, University of Science and Technology of China, Hefei, Anhui 230026, China
cBeijing Laboratory for Electron Microscopy, Institute of Physics, Chinese Academy of Sciences (CAS), Beijing, 100190, China

Received 7th July 2015 , Accepted 7th September 2015

First published on 7th September 2015


Abstract

A flower-like MoS2–graphene nanosheet–CNT (MoS2–GNS–CNT) nanocomposite is successfully prepared by a facile hydrothermal process for fast lithium storage. The introduction of a graphene backbone and CNTs prevent the growth of MoS2, resulting in the formation of few layered nano-MoS2 (about 5–10 nm). The CNTs are intimately embedded in the composites to form highly conductive 3D networks, which serve as a highly conductive substrate leading to the high-rate performance. In addition, CNTs in the unique hybrid nanostructure prevent the restacking of GNS. The MoS2–GNS–CNT composite exhibits superior rate capability (300 mA h g−1 at 20 A g−1) and ultralong cyclability (728 mA h g−1 at 5 A g−1 after 1000 cycles). We believe that our strategy could be broadly applicable for the preparation of other transition metal dichalcogenide (TMD) materials with great promise for various applications.

1. Introduction

In the past decades, lithium ion batteries (LIBs) have been widely used as power sources for portable electronic devices, and recently have also been proposed for application in state grid and electric vehicles (EV).1–3 To meet the demands of application in emerging applications, such as EV, it is crucial to develop advanced LIBs with high energy density and high power density.1–5 In principle, energy density is related to capacity and operating voltage, it can be improved by employing either high-capacity electrodes or high-voltage cathode materials.1–3 Conventional graphite has been widely used as the anode material in commercial LIBs, but it only shows limited theoretical capacity of 372 mA h g−1.6 Therefore, many efforts have been made to seek alternative high-capacity anode materials.7–9

Transition metal dichalcogenides (TMDs) MX2 (M = Mo, W, V, Ti and X = S or Se) with lamellar structures similar to that of graphite have received significant attention due to their unique electrical, chemical, mechanical and thermal properties.10–13 Among them, MoS2 has been considered as a promising alternative anode material for LIBs because of its high theoretical capacity (∼669 mA h g−1). For most carbon anode materials, such as tube in tube carbon nanotubes14 and nitrogen-doped graphene nanosheets,15 the volume expansion in charge–discharge process is not significant. However, substantial volume changes in the MoS2 during charge–discharge cycle leads to pulverization and aggregation of electrode particles.16 Currently, the practical application of MoS2 has been prevented by the poor cyclability and rate capability resulting from low electrical conductivity,5 the huge volume expansion during cycling,16 and the formation of thick and unstable solid electrolyte interface (SEI) film.17 Many approaches have been reported to address these issues. One of the most popular approach is to construct single layer or few layers MoS2 in order to release the mechanical stress, shorten the transport length for both electrons/ions.4,18–20 Another effective way is to design MoS2–carbon composites which show the following advantages: (1) improving the electronic conductivity; (2) buffering the volume change during cycling.19,21 Following this concept, various carbon-based materials have been integrated with MoS2 including porous carbon,22 CNTs,23,24 graphene25,26 and conductive polymer.27 Especially, graphene has been demonstrated as the most promising matrix owing to its special properties, such as high electrical conductivity, high chemical stability and good flexibility.28–30

It is well known that MoS2 shows a sandwich structure. The Mo layer is sandwiched between two layers of S, which has a similar structure to that of graphene.17 As a result, the re-stacking of graphene nanosheets (GNS) and MoS2 layers is inevitable. Additionally, the high contact resistance between GNS definitely leads to a lower rate performance of the composite, because the layers structure maybe slide from each other and aggregate at rapid charge–discharge.31 One possible strategy to alleviate the aggregation mentioned above is to use one-dimensional (1D) CNTs to physically separate 2D graphene to preserve graphene's high surface area.32,33

In this work, we developed a solution-based method to synthesize flower-like MoS2–GNS–CNT nanocomposite, in which the few layered 0D MoS2 nanocrystalline is grown on 2D graphene and 1D CNTs. This special architecture combines the advantages of both 0D, 1D and 2D, which provides the following benefits (i) 1D CNTs possesses long and tortuous character, which acts as a connecter to bridge the defects for electron transfer between graphene layers and 0D MoS2 nanoparticles; (ii) the CNTs could also bridge adjacent GNS and prevent their aggregation, leading to a high contact area between the electrolyte/electrode and facilitating fast transportation of Li+/e during cycling. This flower-like MoS2–GNS–CNT nanocomposite shows enhanced lithium storage performance (830 mA h g−1 after 100 cycles at a current density of 0.5 A g−1), especially high rate performance (300 mA h g−1 at the rate of 20 A g−1). For comparison, we also prepared MoS2–GNS via similar process but without introduction of CNTs.

2. Experimental

2.1 Synthesis of sample

Graphene oxide (GO) was synthesized by a modified Hummers method with a concentration of 2.5 mg ml−1.34,35

Fabrication of MoS2–GNS–CNT nanocomposite: MoS2–GNS–CNT can be obtained by a facile hydrothermal method. Briefly, 16 ml of GO suspension, 0.8 g of sodium dodecyl benzene sulfonate (SDBS), 0.04 g of CNTs and 0.4 g of glucose were dispersed in 64 ml DI water and ultrasonicated for 1 h. Then, 0.35 g of ammonium molybdate tetrahydrate was added and stirred for another 1 h. Further, 0.4 g of thiourea was added to the above solution and ultrasonicated for 15 min. The dispersion was then transferred into a 100 ml Teflon-lined autoclave and maintained at 200 °C for 24 h. After cooling naturally, the resultant black precipitate was centrifuged, washed and freeze-dried. The composite was annealed at 750 °C for 2 h in a flowing 5% Ar/H2 atmosphere to obtain the final product.

The fabrication of MoS2–GNS nanocomposite: MoS2–GNS was prepared by the same procedure as MoS2–GNS–CNT except that using the same weight of GO instead CNTs.

The fabrication of MoS2–CNT nanocomposite: MoS2–CNT was prepared by the same procedure as MoS2–GNS except that using the same weight of CNTs instead of GO.

2.2 Materials characterization

X-ray powder diffraction (XRD) (TTR-III, Rigaku, Japan) using Cu Kα radiation source (λ = 1.54178 Å) was used to characterize the crystal structures of the MoS2–GNS–CNT and MoS2–GNS. Field-emission scanning electron microscopy (FESEM) measurements were conducted using a JSM-6700 FESEM (JEOL, Tokyo, Japan) operated at 5 kV. The morphology and microstructure of the two materials were investigated by JEOL 2010H field-emission transmission electron microscope (FETEM) (JEOL, Tokyo, Japan) and JEOL 4000EX transmission electron microscope (HRTEM) (JEOL, Tokyo, Japan). Raman spectrum was performed on a LanRanHR (HORIBA Scientific, Paris, France) spectrometer equipped with an Ar+ laser at an excitation wavelength of 514.5 nm. Thermo gravimetric analysis (TGA) was carried out on a TGA 600H instrument at a heating rate of 10 °C min−1 in air. X-ray photoelectron spectroscopy (XPS) spectra were recorded using an Axis Ultra Instrument (Kratos Analytical Ltd, UK) to investigate the two components.

2.3 Electrochemical characterization

The electrodes were prepared by well dispersing the active materials (MoS2–GNS–CNT and MoS2–GNS), acetylene carbon black (AC), and poly(vinylidene fluoride) binder (PVDF) in a weight ratio of 8[thin space (1/6-em)]:[thin space (1/6-em)]1[thin space (1/6-em)]:[thin space (1/6-em)]1 in N-methyl-2-pyrrolidone (NMP) to form a slurry. Then, the resultant slurry was pasted on pure copper foil and dried in a vacuum oven. CR2032-type coin cells were assembled in an argon-filled glove box (MBRAUN LABMASTER 130, Germany). Lithium foil was used as counter and reference electrode. Glass fiber (Whatman) was used as the separator. The electrolyte was 1 M LiPF6 dissolved in ethylene carbonate (EC) and diethyl carbonate (DEC) in a volume ratio of 1[thin space (1/6-em)]:[thin space (1/6-em)]1. The loading amount of the working electrode is about 1–2 mg cm−2. Cyclic voltammetry (CV) was conducted on a CHI 660D electrochemical workstation (CHI 660D, CH instruments Inc., Shanghai) between 0.005 V and 3 V at a scan rate of 0.2 mV s−1. The electrochemical impedance measurements (EIS) was performed on CHI 660D working at single frequency with amplitude of 5 mV over the frequency range from 0.01 Hz to 100 kHz. The galvanostatic charge–discharge measurements were tested at different current densities with a NEWARE battery test system in the voltage range of 0.005 V to 3 V vs. Li/Li+.

3. Results and discussion

Scheme 1 shows a schematic for the preparation of MoS2–GNS–CNT nanocomposite via a simple hydrothermal reaction. The hydrothermal process utilizes GO, CNTs and glucose as carbon precursors, SDBS as dispersing agent, (NH4)6Mo7O24·4H2O as Mo precursors and CSN2H4 as inorganic S precursors. Briefly, the GO, CNTs glucose and SDBS were dispersed in DI water and ultrasonicated in order to achieve a homogeneous dispersion. Such pre-dispersed GO–CNT mixture precursor solution can effectively inhibit the agglomeration and restacking of both GNS and CNTs, formation of a 3D interconnection backbone. After that, Mo precursors were mixed with pre-dispersed GO–CNT mixture. The hydrophilic functionalities, such as –OH, −COOH, on the surface of GO make it negatively charged, meanwhile, it can effectively bind with the positively charged Mo precursors by electrostatic interaction. The CNTs cannot bind with the positively charged Mo precursors for without electriferous functionalities, which could prevent MoS2 and GO aggregation. During the subsequent hydrothermal process, the GO was reduced to reduced graphene nanosheets (GNS), simultaneously, glucose transferred to amorphous carbon resulting in an excellent contact between the MoS2 nanoflowers and the 3D porous carbon matrix.36
image file: c5ra13262b-s1.tif
Scheme 1 Schematic illustration for the structure of MoS2–GNS–CNT hybrid.

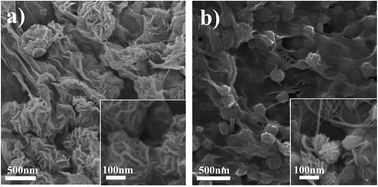
Fig. 1a shows the overview SEM image of MoS2–GNS. The MoS2 shows flower-like morphology with an average size ranging between 0.5 and 1.0 μm, and the surface of MoS2 is covered with sheet-like subunits. The FESEM images of MoS2–GNS nanocomposite (inset of Fig. 1a) show the conventional flake-like morphology. The flake structures are partly aggregated, which could be caused by the preaggregated graphene sheets. The FESEM image of MoS2–GNS–CNT (Fig. 1b) reveal that the flower-like morphology MoS2 that constructed from plenty of nanoflakes. The size of particles for microspheres MoS2 (100–200 nm) in MoS2–GNS–CNT is much smaller than that of MoS2–GNS (0.5–1.0 μm), indicating the growth of MoS2 is effectively restrict through introduction of CNTs. The inset of Fig. 1b confirms that most MoS2 spheres grown on the GNS surfaces and part of the CNTs are uniformly wrapped over the spheres.


image file: c5ra13262b-f1.tif
Fig. 1 SEM images of MoS2–GNS (a) and MoS2–GNS–CNT (b) composites at different magnifications. The inset in (a) and (b) are the high magnification of MoS2–GNS and MoS2–GNS–CNT, respectively.

The structure of both samples are further characterized by transmission electron microscopy (TEM) and high resolution transmission electron microscopy (HRTEM). Fig. 2 shows the TEM images and the corresponding HRTEM images of MoS2–GNS (Fig. 2a and c) and MoS2–GNS–CNT (Fig. 2b and d) composites, respectively. The TEM images (Fig. 2a and b) indicate the homogeneous distribution of flowerlike MoS2 embed in GNS or GNS–CNT backbone. It is found that plenty of nanoflakes with several nanometers thickness constructed flower-like morphology. Each graphene layers and MoS2 petal is curled and thin, and has a smooth surface. CNTs in the MoS2–GNS–CNT also have a smooth surface and naturally interwoven in the matrix. The size of particles in MoS2–GNS–CNT is much less than that in MoS2–GNS, which is consistent with the results estimated from the SEM characterization. The 3D architecture can be attribute to the self-assembly of in situ reduced GO in to a 3D architecture by the partial overlapping or coalescing of the flexible graphene during the hydrothermal process.37 The GNS, MoS2 lattice fringe or CNTs can be clearly seen in the HRTEM images (Fig. 2c and d). The interlayer distance of MoS2 in MoS2–GNS and MoS2–GNS–CNT are 0.689 nm and 0.693 nm, respectively. The number of layers of MoS2 in MoS2–GNS–CNT is less than that in MoS2–GNS, agreeing with the results in SEM or TEM images. MoS2 layers parallel to graphene sheets, indicating that MoS2 tightly bonded to the carbon support.


image file: c5ra13262b-f2.tif
Fig. 2 TEM images and the corresponding high-resolution TEM images of MoS2–GNS (a and c) and MoS2–GNS–CNT (b and d) composites respectively.

The crystallinity and chemical composition of the MoS2–GNS–CNT and MoS2–GNS were confirmed by X-ray diffraction (XRD), as shown in Fig. 3a. Both samples show similar XRD patterns. The diffraction peaks at 2θ = 13, 33, 39 and 59° can be assigned to the (002), (100), (103) and (110) planes of 2H-MoS2 (JCPDS 37-1492), respectively. The diffraction peak at 2θ = 26° related to the (002) planes of graphene or CNTs. Compared with a standard hexagonal 2H-MoS2 structure, the (002) diffraction peak of MoS2–GNS–CNT shifts to low angle (from 14.38° to 13.01°), revealing an expanded interlayer. The expanded interlayer behavior is consistent with the results estimated from the HRTEM (Fig. 2c and d).


image file: c5ra13262b-f3.tif
Fig. 3 (a) XRD patterns of MoS2–GNS and MoS2–GNS–CNT composites. (b–d) XPS spectrum of MoS2–GNS–CNT hybrid. (c) and (d) are the high-resolution Mo 3d and S 2p spectrum peaks respectively. (e) EDX spectrum of MoS2–GNS–CNT hybrid.

The existence of MoS2 is also confirmed by energy-dispersive X-ray photoelectron microscopy (XPS). XPS spectrum (Fig. 3b) not only could confirm the existence of MoS2, but also could gain some insights on the elemental compositions. The XPS spectrum of MoS2–GNS–CNT reveals the presence of C, O, Mo and S peaks. The C 1s peak can be attributed to graphite-like sp2 hybridized carbon. O 1s peak can be attributed to oxygen containing functional groups such as –OH, −COOH. Fig. 3c is the high-resolution Mo 3d spectrum, which can be deconvoluted into two peaks at 229.1 and 232.2 eV, which are attributed to the Mo 3d5/2 and Mo 3d3/2. Those two peaks indicate the existence of Mo4+ oxidation state.38 The core-level S 2p spectrum (Fig. 3d) shows that the two doublets at 161.9 and 163.5 eV, are related to S 2p3/2 and S 2p1/2 species, respectively. In addition, the quantitative XPS analysis indicates that the atomic ratio of Mo to S is 1[thin space (1/6-em)]:[thin space (1/6-em)]2, which is consistent with FESEM-EDS results (Fig. 3e).

Thermogravimetric analysis (TGA) was employed to determine the weight percentage of MoS2 present in the composites. The TGA curves in Fig. 4a represent the MoS2–GNS and MoS2–GNS–CNT respectively. Both MoS2–GNS–CNT and MoS2–GNS show similar TGA profiles. The weight loss appears below 400 °C can probably be ascribed to the oxidation of MoS2 to MoO3. The weight loss takes place at approximately 450 °C, which could be contribute to the oxidation of carbon. The inconspicuous difference thermal behavior of the two weight losses might be caused by the decomposition of the amorphous carbon present in this nanocomposite. By assuming that the remaining product after 550 °C in the TGA process is pure MoO3, which has a weight percentage of approximately 59.3%, 66.3% of MoS2–GNS–CNT and MoS2–GNS, respectively. The MoS2 content in the MoS2–GNS–CNT and MoS2–GNS were approximately 61.8% and 68.6%, respectively. The difference between the Fig. 4a for MoS2–GNS and MoS2–GNS–CNT could be attributed to the different MoS2 contents in both samples and the presence of CNTs in MoS2–GNS–CNT. MoS2–GNS and MoS2–GNS–CNT were further examined by Raman spectroscopy. Raman spectra in Fig. 4b indicates two characteristic peaks at 1350, 1580 cm−1, corresponding to the D, G bands, respectively. The ratio of the D and G band intensities (ID/IG) of MoS2–GNS is 0.9911, and the ID/IG of MoS2–GNS–CNT is 0.9685. The decrease of ID/IG indicating a high graphitic carbon in MoS2–GNS composite. The composites have two obvious peaks at 383 cm−1 and 408 cm−1, which corresponding to E12g(Γ) and A1g(Γ) Raman modes of MoS2, respectively.18


image file: c5ra13262b-f4.tif
Fig. 4 (a) TGA of MoS2–GNS and MoS2–GNS–CNT. The TGA was conducted in air using a heating rate of 10 °C min−1. (b) Raman patterns of MoS2–GNS and MoS2–GNS–CNT composites.

Fig. 5a and b show the cyclic voltammograms (CV) curves of the first 3 cycles for MoS2–GNS and MoS2–GNS–CNT electrode, respectively. Both electrodes show similar CV curves, which is agree with the results of previous literature.16,18 The electrochemical Li+ insertion of MoS2 can be described by the following two equations:39,40

 
MoS2 + 2Li → Li2MoS2 (1)
 
Li2MoS2 + 2Li → 2Li2S + Mo (2)


image file: c5ra13262b-f5.tif
Fig. 5 (a and b) The CV of MoS2–GNS and MoS2–GNS–CNT composites at a scanning rate of 0.2 mV s−1, respectively. (c and d) Charge–discharge voltage profiles at a current density of 0.5 A g−1 for MoS2–GNS and MoS2–GNS–CNT composites, respectively.

As shown in Fig. 5a, in the first lithiation step, the first dominant reduction peak at 1.04 V could attribute to the transformation from the trigonal prisms to an octahedral phase in the MoS2 structure.28,41 The second peak at 0.54 V probably describes the electrochemical conversion reaction:28,42 MoS2 + 4Li → Mo + 2Li2S. In the first charge (delithiation) process, the first peak at 1.73 V is ascribed to the oxidation of Li2S into sulfur and/or Li2MoS2; the second peak at 2.38 V is ascribed to the oxidation of Li2MoS2 into MoS2. In the second cycle, the first dominant reduction peak at 1.78 V derives from the lithium insertion and Li2MoS2 (eqn (1)); the second broad reduction peak at ∼0.92 V could be assigned to the further reduction of Li2MoS2 into Mo metal and Li2S (eqn (2)). In case of MoS2–GNS–CNT has a better repeatability peak than that of MoS2–GNS, it could be attribute to the better structure stability and higher electronic conduction when CNTs added. The CV curves overlap after the 1st cycle, indicating that the MoS2–GNS–CNT display good capacity retention after the initial capacity loss that mainly results from SEI formation and the irreversible lithium storage in GNS and CNTs.

To investigate the specific capacity behavior, galvanostatic charge–discharge measurements for both electrodes were performed (Fig. 5c and d) in the voltage window between 0.005 and 3.0 V (vs. Li+/Li) at a constant current density of 0.5 A g−1. The first 3 charge–discharge curves of MoS2–GNS–CNT (Fig. 5d) are similar with that of MoS2–GNS (Fig. 5c). For MoS2–GNS–CNT, two distinct voltage plateaus at around 0.6 and 1.0 V in 1st discharge process, and a potential plateau at around 1.7 V in the following discharge process. A potential plateau at around 2.3 V is observed during charge process, which is due to the conversion of Li2S to S82−.43,44 All these are consistent with the CV results.

The first charge capacity of the MoS2–GNS and MoS2–GNS–CNT are 955 and 915 mA h g−1, respectively. The initial coulombic efficiencies (CE) of MoS2–GNS and MoS2–GNS–CNT are 72.5%% and 58.7%, respectively (Fig. 6a). This loss is most likely due to formation of SEI layer on the electrode surface during the first discharge step and the lithium storage in the defect sites of MoS2 with porous morphology.45 After the initial capacity lost, both MoS2–GNS and MoS2–GNS–CNT electrodes display similar reversible capacity. For MoS2–GNS–CNT, it could still deliver a reversible capacity of 824 mA h g−1 after 100 cycles, which corresponds to capacity retentions of 90.1% of the first charge capacity.


image file: c5ra13262b-f6.tif
Fig. 6 Cycling behaviors of MoS2–GNS and MoS2–GNS–CNT electrodes at a current density of 0.5 A g−1 (a) and 5 A g−1 (b). (c) Long cycling behavior of MoS2–GNS–CNT electrodes at a current density of 5 A g−1. The first 4 cycles at 0.5 A g−1.

To further demonstrate the improved electrochemical performance of MoS2–GNS–CNT, we compared the electrochemical properties of lithium storage for MoS2–GNS–CNT and MoS2–GNS at a higher current density of 5 A g−1. Fig. 6b shows the cycling performance of MoS2–GNS and MoS2–GNS–CNT electrodes. After 40th cycles, the reversible capacity of MoS2–GNS–CNT still keeps 420 mA h g−1. While for the MoS2–GNS, it shows a high discharge capacity for only the first 5 cycles, after that it decays very fast to 143 mA h g−1. The improved electrochemical performance of MoS2–GNS–CNT indicates the introduction of CNTs enhanced the electronic conductivity of MoS2. Fig. 6c shows the long recyclability of MoS2–GNS–CNT for 1000 cycles at 5 A g−1. Obviously, it shows an initial discharge capacity of 1481 mA h g−1 and exhibits a remarkable capacity of 728 mA h g−1 after 1000 cycles. The CE of MoS2–GNS–CNT could achieve to ∼100% after 1st cycles, indicating the electrochemical Li+ insertion/extraction process is quite reversible. Similar to most metallic oxides or metal sulfides carbon nanocomposite, the capacity gradually increased in charge–discharge process.15,16,46 There are two possible reasons for the gradually increase of the capacities. One reason is attributed to the activation process of MoS2–GNS–CNT anode that occurs during the cycling.35 Another reason is believed to be the formation of gel-like films resulting from the decomposition of electrolyte.47,48

The rate performances of both samples are tested at various current densities (Fig. 7a). The reversible capacities of MoS2–GNS–CNT were 870, 703, 619, 524, 461, 434, 287 mA h g−1, at current densities of 0.5 to 1, 2, 5, 8, 10, and 20 A g−1, respectively. In case of MoS2–GNS, it delivers similar rate performance when cycled at 0.5 and 1 A g−1. When increase the current density to 2, 5, 8, 10, and 20 A g−1, it could only deliver reversible capacities of 370, 188, 110, 93, 42 mA h g−1, respectively. The MoS2–GNS–CNT demonstrates a much better lithium storage performance compared to MoS2–GNS, especially at high current density. The excellent rate performance of MoS2–GNS–CNT is benefit from the smaller MoS2 particle, less layer staked, shorter Li-ion diffusion path and better electronic conduction with the CNTs support. Additionally, the CNTs and carbonaceous material derived from glucose could effectively buffer the volume change during lithiation process and offer conductive network.


image file: c5ra13262b-f7.tif
Fig. 7 Rate capability (a) and Nyquist plots (b) of MoS2–GNS and MoS2–GNS–CNT electrodes. The Nyquist plots carryout with amplitude of 5 mV over the frequency range from 100 kHz to 0.01 Hz. The inset in (b) is the equivalent circuit model.

To achieve more insight, the electrochemical impedance measurements (EIS) were carried out for both electrodes after 100 cycles, as shown in Fig. 7b. The spectra of both samples (Fig. 7a) contain a semicircle in the high frequency and a straight line in the low frequency. The straight lines in the low frequency region in the Nyquist plots are typical Warburg behavior, while the depressed semicircles in the high-medium frequency represent the charge transfer process. It is clear that the radius of semicircle of the MoS2–GNS–CNT composite is much smaller than that of MoS2–GNS, indicating much lower contact and charge transfer resistance. The equivalent circuit model of the studied system is also shown in Fig. 7b.49 The fitted impedance parameters are listed in Table 1. Re represents the internal resistance of the test battery, Rf and CPE1 are associated with the resistance and constant phase element of the SEI film, Rct and CPE2 are associated with the charge-transfer resistance and constant phase element of the electrode/electrolyte interface, and ZW is associated with the Warburg impedance corresponding to the lithium-diffusion process. It can be seen that the SEI film resistance Rf and charge-transfer resistance Rct of the MoS2–GNS–CNT electrode are 34.27 Ω and 53.24 Ω, respectively, which were significantly lower than those of MoS2–GNS (59.4 Ω and 130.4 Ω). It means that CNTs could preserve the high conductivity of the MoS2–GNS–CNT composite electrode and greatly enhanced rapid electron transport during the lithiation/delithiation reaction, resulting in significant improvement in the electrochemical high rate performances. To confirm the structure stability of this the structure, we investigate the morphologies of both electrodes after 100 cycles at 0.5 A g−1. As shown in Fig. 8a, the MoS2 in MoS2–GNS decay from flowerlike to dilapidated irregular large particles. In case of MoS2–GNS–CNT (Fig. 8b), it keeps the original morphology without any obvious pulverization, which indicates that the CNTs prevents the aggregation of MoS2 and graphene, leading to the structure stability upon long-term cycling.

Table 1 Impedance parameters derived using equivalent circuit model for MoS2–GNS and MoS2–GNS–CNT electrodes
Electrode Re (Ω) Rf (Ω) Rct (Ω)
MoS2–GNS 6.83 59.4 130.4
MoS2–GNS–CNT 4.6 34.27 53.24


image file: c5ra13262b-f8.tif
Fig. 8 TEM images of the MoS2–GNS (a) and MoS2–GNS–CNT (b) electrodes after 100 cycles at 0.5 A g−1.

In order to compare the electrochemistry property of MoS2–GNS–CNT with MoS2–CNT, we synthesized the MoS2–CNT nanocomposite. The SEM and TEM images of MoS2–CNT show that most MoS2 nanosheets grown on the CNTs surface (see ESI, Fig. S1a and b). Only a small number of MoS2 aggregate into large particles and peel off from the CNTs surface. The CV curve and charge–discharge profile for the first three cycles of MoS2–CNT (see ESI, Fig. S2a and b) is similar with that of MoS2–GNS or MoS2–GNS–CNT. In the cycling behaviors of MoS2–CNT anode, there is a rapid decrease after the 20th cycle (see ESI, Fig. S2c). Meanwhile, MoS2–CNT anode shows worse rate performance than that of MoS2–GNS–CNT, especially at high current density (see ESI, Fig. S2d). The improved electrochemical performance of MoS2–GNS–CNT can be attributed to synergistic effect of MoS2, CNT and graphene nanosheets, which enhance the electronic and ionic conductivity.

4. Conclusion

In summary, we have developed a facile hydrothermal method to fabricate flower like MoS2–GNS–CNT nanocomposites as an advanced anode material for high-performance LIBs. Such hybrid materials combine the advantages of 0D (MoS2 nanoparticles), 1D (carbon nanotubes), and 2D (graphene). The CNTs were intimately embedded in the composites to form highly conductive 3D networks, which serves as a highly conductive substrate leading to the high-rate performance. Moreover, integration of CNT and graphene could restrict the growth of the flower-like MoS2 nanoparticles, resulting in short Li+/e transport distance. When used as anode for LIBs, MoS2–GNS–CNT displays superior rate capability (300 mA h g−1 at 20 A g−1) and ultralong cyclability (728 mA h g−1 at 5 A g−1 after 1000 cycles). We believe that our strategy could be broadly applicable for preparation other TMDs materials with great promise for various applications.

Acknowledgements

This work was financially supported by the National Natural Science Foundation of China (no. 21171015, no. 21373195), the Recruitment Program of Global Experts, the program for New Century Excellent Talents in University (NCET), the Fundamental Research Funds for the Central Universities (WK2060140014, WK2060140016), the Collaborative Innovation Center of Suzhou Nano Science and Technology.

References

  1. M. Armand and J. M. Tarascon, Nature, 2008, 451, 652–657 CrossRef CAS PubMed.
  2. A. S. Arico, P. Bruce, B. Scrosati, J.-M. Tarascon and W. van Schalkwijk, Nat. Mater., 2005, 4, 366–377 CrossRef CAS PubMed.
  3. P. G. Bruce, B. Scrosati and J.-M. Tarascon, Angew. Chem., Int. Ed., 2008, 47, 2930–2946 CrossRef CAS PubMed.
  4. H. Hwang, H. Kim and J. Cho, Nano Lett., 2011, 11, 4826–4830 CrossRef CAS PubMed.
  5. D. Kong, H. He, Q. Song, B. Wang, W. Lv, Q.-H. Yang and L. Zhi, Energy Environ. Sci., 2014, 7, 3320–3325 CAS.
  6. H. Li, Z. Wang, L. Chen and X. Huang, Adv. Mater., 2009, 21, 4593–4607 CrossRef CAS PubMed.
  7. A. J. Heeger, J. Phys. Chem. B, 2001, 105, 8475–8491 CrossRef CAS.
  8. P. G. Bruce, B. Scrosati and J. M. Tarascon, Angew. Chem., Int. Ed., 2008, 47, 2930–2946 CrossRef CAS PubMed.
  9. A. S. Aricò, P. Bruce, B. Scrosati, J.-M. Tarascon and W. van Schalkwijk, Nat. Mater., 2005, 4, 366–377 CrossRef PubMed.
  10. M. Chhowalla, H. S. Shin, G. Eda, L.-J. Li, K. P. Loh and H. Zhang, Nat. Chem., 2013, 5, 263–275 CrossRef PubMed.
  11. H. S. S. Ramakrishna Matte, A. Gomathi, A. K. Manna, D. J. Late, R. Datta, S. K. Pati and C. N. R. Rao, Angew. Chem., 2010, 122, 4153–4156 CrossRef PubMed.
  12. J. N. Coleman, M. Lotya, A. O'Neill, S. D. Bergin, P. J. King, U. Khan, K. Young, A. Gaucher, S. De, R. J. Smith, I. V. Shvets, S. K. Arora, G. Stanton, H.-Y. Kim, K. Lee, G. T. Kim, G. S. Duesberg, T. Hallam, J. J. Boland, J. J. Wang, J. F. Donegan, J. C. Grunlan, G. Moriarty, A. Shmeliov, R. J. Nicholls, J. M. Perkins, E. M. Grieveson, K. Theuwissen, D. W. McComb, P. D. Nellist and V. Nicolosi, Science, 2011, 331, 568–571 CrossRef CAS PubMed.
  13. M. Chhowalla and G. A. Amaratunga, Nature, 2000, 407, 164–167 CrossRef CAS PubMed.
  14. Y. J. Xu, X. Liu, G. Cui, B. Zhu, G. Weinberg, R. Schlogl, J. Maier and D. S. Su, ChemSusChem, 2010, 3, 343–349 CrossRef CAS PubMed.
  15. H. Wang, C. Zhang, Z. Liu, L. Wang, P. Han, H. Xu, K. Zhang, S. Dong, J. Yao and G. Cui, J. Mater. Chem., 2011, 21, 5430 RSC.
  16. C. Zhu, X. Mu, P. A. van Aken, Y. Yu and J. Maier, Angew. Chem., Int. Ed., 2014, 53, 2152–2156 CrossRef CAS PubMed.
  17. K. Chang, D. Geng, X. Li, J. Yang, Y. Tang, M. Cai, R. Li and X. Sun, Adv. Energy Mater., 2013, 3, 839–844 CrossRef CAS PubMed.
  18. H. Liu, D. Su, R. Zhou, B. Sun, G. Wang and S. Z. Qiao, Adv. Energy Mater., 2012, 2, 970–975 CrossRef CAS PubMed.
  19. K. Chang, W. Chen, L. Ma, H. Li, H. Li, F. Huang, Z. Xu, Q. Zhang and J.-Y. Lee, J. Mater. Chem., 2011, 21, 6251–6257 RSC.
  20. P.-p. Wang, H. Sun, Y. Ji, W. Li and X. Wang, Adv. Mater., 2014, 26, 964–969 CrossRef CAS PubMed.
  21. C. Zhu, X. Mu, P. A. van Aken, J. Maier and Y. Yu, Adv. Energy Mater., 2015, 5 DOI:10.1002/aenm.201401170.
  22. X. Zhou, L.-J. Wan and Y.-G. Guo, Nanoscale, 2012, 4, 5868–5871 RSC.
  23. K. Bindumadhavan, S. K. Srivastava and S. Mahanty, Chem. Commun., 2013, 49, 1823–1825 RSC.
  24. S. Ding, J. S. Chen and X. W. Lou, Chem.–Eur. J., 2011, 17, 13142–13145 CrossRef CAS PubMed.
  25. H. Yu, C. Ma, B. Ge, Y. Chen, Z. Xu, C. Zhu, C. Li, Q. Ouyang, P. Gao, J. Li, C. Sun, L. Qi, Y. Wang and F. Li, Chem.–Eur. J., 2013, 19, 5818–5823 CrossRef CAS PubMed.
  26. Y. Gong, S. Yang, L. Zhan, L. Ma, R. Vajtai and P. M. Ajayan, Adv. Funct. Mater., 2014, 24, 125–130 CrossRef CAS PubMed.
  27. L. Yang, S. Wang, J. Mao, J. Deng, Q. Gao, Y. Tang and O. G. Schmidt, Adv. Mater., 2013, 25, 1180–1184 CrossRef CAS PubMed.
  28. K. Chang and W. Chen, ACS Nano, 2011, 5, 4720–4728 CrossRef CAS PubMed.
  29. Z. Wang, T. Chen, W. Chen, K. Chang, L. Ma, G. Huang, D. Chen and J. Y. Lee, J. Mater. Chem. A, 2013, 1, 2202–2210 CAS.
  30. K. Chang and W. Chen, Chem. Commun., 2011, 47, 4252–4254 RSC.
  31. Y. Gong, S. Yang, Z. Liu, L. Ma, R. Vajtai and P. M. Ajayan, Adv. Mater., 2013, 25, 3979–3984 CrossRef CAS PubMed.
  32. F. D. Novaes, R. Rurali and P. Ordejón, ACS Nano, 2010, 4, 7596–7602 CrossRef CAS PubMed.
  33. D. Yu and L. Dai, J. Phys. Chem. Lett., 2010, 1, 467–470 CrossRef CAS.
  34. W. S. Hummers Jr and R. E. Offeman, J. Am. Chem. Soc., 1958, 80, 1339 CrossRef.
  35. X. Liu, X. Zhong, Z. Yang, F. Pan, L. Gu and Y. Yu, Electrochim. Acta, 2015, 152, 178–186 CrossRef CAS PubMed.
  36. Q. Xiang, J. Yu and M. Jaroniec, J. Am. Chem. Soc., 2012, 134, 6575–6578 CrossRef CAS PubMed.
  37. Y. Xu, K. Sheng, C. Li and G. Shi, ACS Nano, 2010, 4, 4324–4330 CrossRef CAS PubMed.
  38. V. Koroteev, L. Bulusheva, I. Asanov, E. Shlyakhova, D. Vyalikh and A. Okotrub, J. Phys. Chem. C, 2011, 115, 21199–21204 CAS.
  39. X. Fang, X. Guo, Y. Mao, C. Hua, L. Shen, Y. Hu, Z. Wang, F. Wu and L. Chen, Chem.–Asian J., 2012, 7, 1013–1017 CrossRef CAS PubMed.
  40. X. Fang, C. Hua, X. Guo, Y. Hu, Z. Wang, X. Gao, F. Wu, J. Wang and L. Chen, Electrochim. Acta, 2012, 81, 155–160 CrossRef CAS PubMed.
  41. Y. Miki, D. Nakazato, H. Ikuta, T. Uchida and M. Wakihara, J. Power Sources, 1995, 54, 508–510 CrossRef CAS.
  42. C. Zhu, X. Mu, P. A. van Aken, J. Maier and Y. Yu, Adv. Energy Mater., 2015, 5 DOI:10.1002/aenm.201401170.
  43. X. Fang, X. Guo, Y. Mao, C. Hua, L. Shen, Y. Hu, Z. Wang, F. Wu and L. Chen, Chem.–Asian J., 2012, 7, 1013–1017 CrossRef CAS PubMed.
  44. X. Fang, C. Hua, X. Guo, Y. Hu, Z. Wang, X. Gao, F. Wu, J. Wang and L. Chen, Electrochim. Acta, 2012, 81, 155–160 CrossRef CAS PubMed.
  45. J. Xiao, X. Wang, X.-Q. Yang, S. Xun, G. Liu, P. K. Koech, J. Liu and J. P. Lemmon, Adv. Funct. Mater., 2011, 21, 2840–2846 CrossRef CAS PubMed.
  46. R. Wang, C. Xu, J. Sun, L. Gao and H. Yao, ACS Appl. Mater. Interfaces, 2014, 6, 3427–3436 CAS.
  47. L. Zhou, D. Zhao and X. W. Lou, Adv. Mater., 2012, 24, 745–748 CrossRef CAS PubMed.
  48. L. Su, X. Wu, J. Hei, L. Wang and Y. Wang, Part. Part. Syst. Charact., 2015, 32, 721–727 CrossRef CAS PubMed.
  49. P. Guo, H. Song and X. Chen, Electrochem. Commun., 2009, 11, 1320–1324 CrossRef CAS PubMed.

Footnote

Electronic supplementary information (ESI) available. See DOI: 10.1039/c5ra13262b

This journal is © The Royal Society of Chemistry 2015