Synthesis and electrochemical performance of Li4Ti5O12/TiO2/C nanocrystallines for high-rate lithium ion batteries

Wenjun Zhua, Hui Yanga, Wenkui Zhangb, Hui Huangb, Xinyong Taob, Yang Xiab, Yongping Ganb and Xingzhong Guo*a
aSchool of Materials Science and Engineering, Zhejiang University, 38 Zheda Road, Xihu District, Hangzhou 310027, China. E-mail: msewj01@zju.edu.cn; Fax: +86 571 87953054
bCollege of Materials Science and Engineering, Zhejiang University of Technology, Hangzhou 310014, China

Received 26th June 2015 , Accepted 24th August 2015

First published on 24th August 2015


Abstract

A Li4Ti5O12/TiO2/carbon (Li4Ti5O12/TiO2/C) nanocrystalline composite has been successfully synthesized by a facile sol–gel method and subsequent calcination treatment. Moreover, pure Li4Ti5O12, Li4Ti5O12/C and Li4Ti5O12/TiO2 composites have also been synthesized for comparison. All the samples present a nanocrystalline structure with a uniform size distribution, and abundant phase interfaces can be detected for the Li4Ti5O12/TiO2 and Li4Ti5O12/TiO2/C composites. Electrochemical measurements demonstrate that the resultant Li4Ti5O12/TiO2/C composite exhibits a superior rate capability and cycle stability in comparison with pure Li4Ti5O12, Li4Ti5O12/C and Li4Ti5O12/TiO2 composites, which can be attributed to a high grain boundary density, abundant phase interfaces and in situ formed carbon, for storing extra lithium ions, enhancing rapid lithium insertion/extraction kinetics and improving the electron transport rate.

Introduction

Rechargeable lithium-ion batteries (LIBs) have attracted great attention as a power source for most portable electronic devices and a promising energy-storage device in electric vehicles and electrical/hybrid vehicles, due to their large energy density, environmental friendliness and high output voltage.1–6 With the rapid development of portable electronic devices and hybrid electric vehicles, it is highly desired to explore new LIBs materials with high power density, long cycle life, and better safety. Currently, carbonaceous materials have been used as the most common commercial anode materials for LIBs. However, carbonaceous materials have some safety concerns, particularly when used for high power batteries. Lithium dendrites are likely to be formed on the surface of the carbon materials after long charge–discharge cycles, resulting in capacity decay.7–9 Therefore, searching for alternative anode materials with excellent rate-capability and good safety properties becomes an urgent topic for the LIBs field.3,10–13

Spinel lithium titanium oxide (Li4Ti5O12) has garnered particular interests as one of the most attractive LIBs anode materials owning to the stable and high flat Li ion insertion voltage (∼1.55 V vs. Li/Li+), which could effectively avoid the formation of the solid-electrolyte interphase (SEI) layer and suppress the deposition of lithium dendrites, largely enhance the safety of the cells. Moreover, the negligible volume change of spinel Li4Ti5O12 electrode during the repeated Li+ insertion and extraction processes guarantees the long-term electrochemical stability and the enhanced capacity retention.14–16 Thus, spinel Li4Ti5O12 is considered as a promising alternative to carbonaceous anodes. Despite of these advantages, the practical application of spinel Li4Ti5O12 is still largely restrained by the inherently kinetic problem derived from the low electronic conductivity (10−13 S−1) and sluggish lithium ion diffusion (10−13 to 10−9 cm2 s−1), resulting in a poor rate capability.8,17–19

Up to date, tremendous efforts have been made to circumvent the drawbacks of Li4Ti5O12. An effective strategy is reducing the particle size of Li4Ti5O12 to nanoscale range to acquire enhanced electrochemical performance by shortening the diffusion paths for electrons and lithium ions.15,20,21 Another effective strategy is synthesizing nanocomposites coating with conductive carbonaceous materials, such as graphite, graphene, carbon nanotubes, and carbon nanofibers, etc., which could effectively increase the electrical conductivity to further enhance the electrochemical performance of Li4Ti5O12 electrode, especially the rate capability.2,7,15,22–24 In addition, intensive studies have demonstrated that the dual phase Li4Ti5O12/anatase TiO2 composites present superior electrochemical performance than pure Li4Ti5O12. During the dual phase structure, the higher theoretical specific capacity of anatase TiO2 (336 mA h g−1) compared with that of spinel Li4Ti5O12 (175 mA h g−1) and the interfacial pseudocapacitive effect derived from abundant phase interfaces between spinel Li4Ti5O12 and anatase TiO2 make contribution to the improved specific capacity of Li4Ti5O12/TiO2 composite. Moreover, the lithium insertion/extraction ability of the Li4Ti5O12/TiO2 composite can be enhanced by phase interfaces and nanosized anatase TiO2.12,16,23,25–28 Based on the above discussions, it is attractive to design a novel Li4Ti5O12 material with the merits of nanoscale structure, abundant phase interfaces and decorating with carbon material.

In this work, we report a facile sol–gel route with a subsequent heat treatment to fabricate Li4Ti5O12/TiO2/C nanocrystalline composite. The structure and electrochemical performance of the as-prepared Li4Ti5O12/TiO2/C composite are investigated in detail. The resultant Li4Ti5O12/TiO2/C composite displays a superior rate capability and cycle stability in comparison with pure Li4Ti5O12, Li4Ti5O12/C and Li4Ti5O12/TiO2 composites. The improved electrochemical performance could be attributed to the synergetic effect of uniform nanocrystalline structure, plentiful grain boundaries and phase interfaces, and in situ formed carbon.

Experimental

Materials synthesis

Tetrabutyl titanate (Ti(OC4H9)4, TBOT, Aladdin) and lithium acetate dihydrate (CH3COOLi·2H2O, LiAc, Sinopharm Chemical Reagent Co., Ltd (China)) were utilized as titanium and lithium sources, respectively. Mixture of distilled water (H2O) and ethanol (EtOH, 99.5%) was used as the solvent. Glacial acetic acid (HAc, Sinopharm Chemical Reagent Co., Ltd (China)) was used as catalyst for gelation. Poly(vinylpyrrolidone) (PVP, Sigma-Aldrich, Mw = 10[thin space (1/6-em)]000) was used as a phase separation inducer. All chemicals were of analytical grade and used as received without further purification.

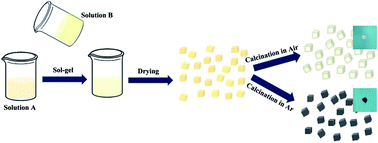
The whole fabrication procedure is shown in Fig. 1. In a typical synthesis, with the molar ratio of Li/Ti at 3.8[thin space (1/6-em)]:[thin space (1/6-em)]5, 1.5 mL (4.4 mM) TBOT and a certain amount of LiAc·2H2O were dissolved in 2.5 mL EtOH to obtain transparent solution A. 0.25 mL HAc, 0.3 mL deionized water and 2.0 mL EtOH were mixed, then 0.75 g PVP was added and stirred at room temperature about 30 min to gain pale yellow solution B. Then, the solution B was slowly dropped into the solution A under vigorous stirring. After continuously stirring for 5 min, the mix solution was kept in a sealed container at 60 °C for gelation, and white gels could be acquired after about 20 min. The colour of the gel was changed from white to light orange during the drying process. After dried at 80 °C for 2 d, the resulting dried gels were calcinated at 600 °C for 5 h in air and an argon atmosphere to obtain Li4Ti5O12/TiO2 and Li4Ti5O12/TiO2/C composites, respectively. For comparison, the pure Li4Ti5O12 and the Li4Ti5O12/C composite were also prepared with the molar stoichiometric ratio of Li/Ti (4[thin space (1/6-em)]:[thin space (1/6-em)]5) after the calcination at 600 °C for 5 h in air and an argon atmosphere, respectively.


image file: c5ra12397f-f1.tif
Fig. 1 Schematic illustration of the fabrication process of pure Li4Ti5O12, Li4Ti5O12/C, Li4Ti5O12/TiO2 and Li4Ti5O12/TiO2/C composites (insets are the corresponding optical photographs).

Structure characterizations

The phase purity and crystal structure of as-obtained products were characterized using powder X-ray diffractometry (XRD; X'Pert Pro diffractometer with a Cu Kα radiation, λ = 0.15418 nm). Morphology and microstructure were determined by scanning electron microscopy (SEM; Hitachi S-4800) and transmission electron microscopy (TEM; FEI, Tecnai G2 F20). The chemical valence state of elements for the samples was studied by X-ray photoelectron spectroscopy (XPS) performed on a Thermo ESCALAB 250 system with a monochromatic Al-Kα (1486.6 eV) as the X-ray source. Measurements of Raman spectra were collected on a Renishaw InVia Raman Spectrometer under a backscattering geometry (λ = 532 nm). The thermal decomposition behavior of the dried gel and the amount of carbon in the composites were examined by thermogravimetric analysis (TGA, TA Q500) at a heating rate of 10 °C min−1 from room temperature to 800 °C in air.

Electrochemical measurements

Electrochemical experiments were evaluated using standard CR 2025 type coin cells with lithium foil as the counter and reference electrodes. Active material (as-prepared samples), conductive super P and polyvinylidene fluoride (PVDF) binder were mixed at a weight ratio of 80[thin space (1/6-em)]:[thin space (1/6-em)]10[thin space (1/6-em)]:[thin space (1/6-em)]10 in N-methyl-2-pyrrolidene (NMP) solution to form a slurry. The slurry was homogeneously coated onto a Cu foil and dried in a vacuum oven at 120 °C for 12 h before coin-cell assembly. The weight of the active material in the electrode sheet was 2–3 mg cm−2. A solution of 1 M LiPF6 dissolved in a mixture of ethylene carbonate (EC)/dimethyl carbonate (DMC) (1[thin space (1/6-em)]:[thin space (1/6-em)]1 by volume) was used as the electrolyte, and a polypropyle (PP) microporous film (Cellgard 2300) as the separator. Galvanostatic charge–discharge measurements were performed on a Neware battery test system in the voltage range of 1.0–3.0 V at room temperature. A CHI 660b workstation (Shanghai Chenhua, China) was applied for cyclic voltammograms (CV) tests in the voltage range of 1.0–3.0 V at a scan rate of 0.1 mV s−1. The electrochemical impedance spectroscopy (EIS) measurements were collected on the same workstation over the frequency range 0.1 Hz to 100 kHz with a voltage amplitude of 5.0 mV.

Results and discussion

Fig. 2a shows the XRD patterns of the as-prepared products. It can be seen that all the samples present sharp peaks, indicating that all the samples are well crystallized after calcination at a relatively low temperature of 600 °C. Pure Li4Ti5O12 phase can be obtained in the pure Li4Ti5O12 and Li4Ti5O12/C composite (Fig. S1), and all the diffraction peaks are consistent with the cubic spinel phase Li4Ti5O12 (JCPDS no. 49-0207) without any impurities. The Li4Ti5O12/TiO2 and Li4Ti5O12/TiO2/C composites can be obtained at the ratio of Li/Ti (3.8[thin space (1/6-em)]:[thin space (1/6-em)]5), the additional peaks marked by dot are indexed to anatase TiO2 (JCPDS 65-5714). No obvious broad peaks corresponding to amorphous or crystalline carbon can be found against the background in the XRD pattern of Li4Ti5O12/C (Fig. S1) and Li4Ti5O12/TiO2/C composites, which could be attributed to the low crystallinity and the combination mode of the carbon.5,7,23,24,29 However, the carbon composition of Li4Ti5O12/TiO2/C composite can be confirmed by Raman spectrum (Fig. 2b) and TEM examination (described later).
image file: c5ra12397f-f2.tif
Fig. 2 XRD patterns (a), Raman spectra (b), full XPS survey spectra (c) and high-resolution Ti2p spectra (d) of pure Li4Ti5O12, Li4Ti5O12/TiO2 and Li4Ti5O12/TiO2/C composites, respectively.

The phase compositions of the as-obtained samples are further studied by Raman spectrum shown in Fig. 2b. The observed peaks at 236, 453 and 611 cm−1, corresponding to the characteristic peaks of spinel Li4Ti5O12.9,30 Besides, the typical vibration peaks of anatase TiO2 located at 149, 199, 400, 500, 515, 631 and 637 cm−1 are found for the samples of Li4Ti5O12/TiO2 and Li4Ti5O12/TiO2/C composites.7,31 Furthermore, two peaks at 1344 and 1590 cm−1 are observed for the Li4Ti5O12/TiO2/C composite, which are attributed to the typical disordered band (D band) and the graphene band (G band) of carbon, respectively.10,13,32 The compositions (Li4Ti5O12 and carbon) of the Li4Ti5O12/C composite are also confirmed by the Raman spectrum (Fig. S2). The result of Raman spectra indicates that the existence of carbon, which results from the in situ formed carbon derived from the pyrolysis of PVP in an argon atmosphere.7 Moreover, the IG/ID value (ratio of the intensity of G Raman peak and D Raman peak) is about 0.96, indicating that the carbon is mainly exist as disordered form with low crystallinity, which is agree with the results of XRD.

Further surface chemical compositions and elemental states of the as-prepared samples were collected via X-ray photoelectron spectroscopy (XPS). The binding energies obtained in the XPS spectrum were corrected with reference to the C1s peak at 284.6 eV. As shown in Fig. 2c, obvious peaks of O1s, Ti2p, N1s, C1s and Li1s peaks are observed for all the samples, indicating the existence of these elements. Fig. 2d shows the high resolution spectra of the Ti2p, the typical Ti2p1/2 and Ti2p3/2 of Ti4+ located at 463.8 and 458.0 eV can be detected from the pure Li4Ti5O12.7,15 The Li4Ti5O12/TiO2 and Li4Ti5O12/TiO2/C composites also present similar Ti2p1/2 and Ti2p3/2 characteristic peaks, and the peaks of Ti2p1/2 and Ti2p3/2 migrate to higher binding energy compared with pure Li4Ti5O12. This phenomenon is obvious for the Li4Ti5O12/TiO2/C composite. Moreover, the characteristic peak of Ti3+ at 457.6 eV is observed for the Li4Ti5O12/TiO2/C composite, which may be attributed to the increased oxygen vacancies in the Li4Ti5O12/TiO2/C composite due to the reduction effect derived from the argon atmosphere and in situ formed carbon.15,33 The existence of Ti3+ and oxygen vacancies is favorable to enhancing Li+ insertion and increasing electronic conductivity, which are beneficial to improving electrochemical performance of the Li4Ti5O12/TiO2/C composite.

Thermal analysis was used to analyze the thermal behavior of the dried gel and actual carbon content of Li4Ti5O12/C and Li4Ti5O12/TiO2/C composites. As shown in Fig. 3, for dried gel, there is a small weight loss of about 10% happened up to 120 °C, which is mainly due to the elimination of absorbed/trapped water contained in the sample. Subsequently, there is a distinct weight loss of about 32% occurred from 120 to 600 °C, which can be attributed to the chemical reaction of dried gel and the decomposition of PVP residue. Additionally, the distinct weight loss of Li4Ti5O12/TiO2/C composite is observed between 200 and 500 °C, which is ascribed to the decomposition of carbon and calculated to be 15%. That is to say, the carbon content of Li4Ti5O12/TiO2/C composite is about 15%. Similar results are observed from the Li4Ti5O12/C composite (Fig. S3), and the carbon content of Li4Ti5O12/C composite is 15.6%.


image file: c5ra12397f-f3.tif
Fig. 3 TG curves of the as-prepared dried gel and the Li4Ti5O12/TiO2/C composite.

The morphology of the products was characterized by SEM. As shown in Fig. 4 and S4, it can be observed from the low-magnification images (Fig. 4a, c and e and S4a) that all the samples present a similar morphology composed of uniform nanocrystalline particles due to the surfactant and phase separation induction effect of PVP.7 The high-magnification images (Fig. 4b, d and f and S4b) show that homogeneous nanocrystalline particles for all the samples display a similar size in the range of 50–100 nm, indicating that the second phase of anatase TiO2 and carbon have no effect on the size of particles.


image file: c5ra12397f-f4.tif
Fig. 4 Typical low-magnification and high-magnification SEM images of pure Li4Ti5O12 (a and b), Li4Ti5O12/TiO2 (c and d) and Li4Ti5O12/TiO2/C composites (e and f).

TEM and HRTEM were performed to further study the microstructure and carbon distribution (Fig. 5). Agree with the SEM images (Fig. 4), all the samples present a nanocrystalline structure (Fig. 5a, c and e). These nanoparticles interconnect into a network porous structure, which is beneficial to enhancing the electrochemical performances. Furthermore, the dispersion of carbon can be found in the Li4Ti5O12/TiO2/C composite, as marked by the arrows in Fig. 5e. The lattice spacing of 0.482 nm in Fig. 5b corresponds to the (111) crystal plane of spinel Li4Ti5O12. Compared with pure Li4Ti5O12, the characteristic lattice stripes of anatase TiO2 can be detected from the Li4Ti5O12/TiO2 and Li4Ti5O12/TiO2/C composites in Fig. 5d and f. The lattice spacing values of 0.356/0.357 and 0.236 nm are assigned to the (101) and (004) planes of anatase TiO2, respectively. Abundant grain boundaries and phase interfaces are produced due to nanocrystal components and dual-phase of Li4Ti5O12 and anatase TiO2, as marked by the red dashed line in Fig. 5d and f. Besides, the grey regions marked by black arrow in Fig. 5f could be detected from the Li4Ti5O12/TiO2/C composite, which could be attributed to the in situ formed carbon derived from PVP. The high crystallinity of the as-obtained samples can be further confirmed by the distinct lattice stripes in the HRTEM images (Fig. 5b, d and f), which is consistent with the results of XRD shown above.


image file: c5ra12397f-f5.tif
Fig. 5 TEM and HRTEM images of pure Li4Ti5O12 (a and b), Li4Ti5O12/TiO2 (c and d), and Li4Ti5O12/TiO2/C composites (e and f).

The electrochemical behaviour of pure Li4Ti5O12, Li4Ti5O12/C, Li4Ti5O12/TiO2 and Li4Ti5O12/TiO2/C composite electrodes was characterized by cyclic voltammetry (CV) at a scanning rate of 0.1 mV s−1 in the potential range of 1.0–3.0 V, as shown in Fig. 6. Only one oxidation/reduction peak at 1.51 and 1.62 V is observed for the pure Li4Ti5O12 and the Li4Ti5O12/C composite (Fig. S5) electrode, corresponding to the Li+ insertion/extraction reaction of spinel Li4Ti5O12 (Li4Ti5O12 + 3Li+ + 3e ↔ Li7Ti5O12).5,9,34 Besides, an additional pair of redox peaks located at 1.72/2.04 V is detected for the Li4Ti5O12/TiO2 and Li4Ti5O12/TiO2/C composites, which is attributed to the discharge and charge plateaus of anatase TiO2 phase (xLi+ + TiO2 + xe ↔ LixTiO2).7,9,35 It can be detected that the background of the redox peaks for Li4Ti5O12/C (Fig. S5) and Li4Ti5O12/TiO2/C composites is much more wider than that of pure Li4Ti5O12 and Li4Ti5O12/TiO2 composite, which can be assigned to the pseudocapacitive of the faradaic-limited process derived from the carbon.7,36


image file: c5ra12397f-f6.tif
Fig. 6 CV curves of pure Li4Ti5O12, Li4Ti5O12/TiO2 and Li4Ti5O12/TiO2/C composites.

As is well known, the volumic capacity is an important parameter for the practical application of Li4Ti5O12-based materials.37,38 The capacities of the samples in this work are addressed not only by weight dimensionality (mA h g−1) but also by volume (mA h cm−3). The densities of the pure Li4Ti5O12, Li4Ti5O12/C, Li4Ti5O12/TiO2 and Li4Ti5O12/TiO2/C composites are calculated to be 3.41, 2.97, 3.52 and 3.26 g cm−3, respectively. The initial three charge–discharge cycle profiles for pure Li4Ti5O12, Li4Ti5O12/C, Li4Ti5O12/TiO2 and Li4Ti5O12/TiO2/C composite electrodes with a current rate of 0.5C (1C = 175 mA g−1) are shown in Fig. 7a–d. Agree well with the result of CV curves (Fig. 6), two long flat plateaus at about 1.51 and 1.62 V are observed for all the samples due to the typical lithium insertion/extraction processes of Li4Ti5O12. Moreover, the voltage plateaus at around 1.98 and 1.72 V are verified as the lithium ion insertion/extraction reaction of anatase TiO2.5 The initial discharge capacities of pure Li4Ti5O12, Li4Ti5O12/C, Li4Ti5O12/TiO2 and Li4Ti5O12/TiO2/C composites are 134, 157, 144 and 170 mA h g−1, corresponding to 455, 466, 506 and 554 mA h cm−3, respectively. The charge–discharge profiles of all samples are nearly invariable after the second cycle. The reversible capacities of the third cycle for pure Li4Ti5O12, Li4Ti5O12/C, Li4Ti5O12/TiO2 and Li4Ti5O12/TiO2/C composites are approximately 87, 119, 117 and 143 mA h g−1, corresponding to 297, 353, 411 and 466 mA h cm−3, respectively. The higher specific capacity of Li4Ti5O12/TiO2/C composite is contributed by relatively high theoretical capacity of anatase TiO2 and carbon, and the extra lithium storage derived from phase interfaces.


image file: c5ra12397f-f7.tif
Fig. 7 Initial three discharge/charge curves of (a) pure Li4Ti5O12, (b) Li4Ti5O12/C, (c) Li4Ti5O12/TiO2 and (d) Li4Ti5O12/TiO2/C composites, respectively.

Fig. 8a compares the cyclic stability of the Li4Ti5O12/TiO2/C composite at 1C with that of pure Li4Ti5O12, Li4Ti5O12/C and Li4Ti5O12/TiO2 composites in the voltage range of 1.0–3.0 V. It can be observed that the Li4Ti5O12/TiO2/C composite electrode displays a higher capacity and better cycling performance compared with pure Li4Ti5O12, Li4Ti5O12/C and Li4Ti5O12/TiO2 composites. Moreover, it is noted that the reversible capacities of Li4Ti5O12/C and Li4Ti5O12/TiO2/C composites display an upward trend during the early cycles, this phenomena is commonly observed from the carbon-based composites, which may imply that more diffusion paths are created through the carbon.39–41 After 100 cycles, the reversible capacity of the Li4Ti5O12/TiO2/C composite is measured to be 102 mA h g−1 (333 mA h cm−3) with a high cycle stability, which is about 80% of the initial capacity. On the contrary, the reversible capacities for pure Li4Ti5O12, Li4Ti5O12/C and Li4Ti5O12/TiO2 composite electrodes are only 47, 90 and 81 mA h g−1, corresponding to 160, 267, and 264 mA h cm−3, respectively.


image file: c5ra12397f-f8.tif
Fig. 8 (a) Cycling performance at 1C and (b) rate performance (from 0.5C to 30C and back to 0.5C) of pure Li4Ti5O12, Li4Ti5O12/C, Li4Ti5O12/TiO2 and Li4Ti5O12/TiO2/C composites, respectively.

The cell was progressively charged and discharged at various rates from 0.5C to 30C for 10 cycles, and then again at 1 and 0.5C for 10 cycles. It can be detected in Fig. 8b that the Li4Ti5O12/TiO2/C composite presents the best rate capability, the result is consistent with Fig. 8a. Compared with pure Li4Ti5O12, Li4Ti5O12/C and Li4Ti5O12/TiO2 composites, it can be observed that the Li4Ti5O12/TiO2/C composite shows a slower capacity decay with the increase of C-rates, especially at high rates. A high capacity of 88 mA h g−1 (286 mA h cm−3) can be achieved for the Li4Ti5O12/TiO2/C composite at the high rate of 30C, whereas the value drops to only 17, 68 and 54 mA h g−1 for the pure Li4Ti5O12, Li4Ti5O12/C and Li4Ti5O12/TiO2 composites at the same rate, and the corresponding volumic capacities are 60, 202 and 190 mA h cm−3, respectively. It can be found that the Li4Ti5O12/TiO2/C composite presents the highest specific capacity both in mA h g−1 and mA h cm−3. The significantly improved rate capability of the Li4Ti5O12/TiO2/C composite is attributed to the improved electrical conductivity contributed by the in situ formed carbon, anatase TiO2 and phase interfaces. Moreover, when the current density is returned to 1 and 0.5C again, specific capacities of the samples except the pure Li4Ti5O12 can be recovered to a large extent, which could be attributed to the improved lithium insertion/extraction kinetics and the enhanced structure stability guaranteed by the abundant phase interfaces and the in situ formed carbon. It is noted that the specific capacities are calculated based on the weight of the whole composites in this work. According to the content of about 15% in the TG curve (Fig. 3 and S3) and a theoretical specific capacity of 372 mA h g−1, the specific capacity contributed by the carbon for Li4Ti5O12/C and Li4Ti5O12/TiO2/C composites is calculated to be 55.8 mA h g−1 (127 mA h cm−3). Actually, the actual value is less than that due to the low crystallinity and irregular in situ combination mode. Although the specifies of Li4Ti5O12/C and Li4Ti5O12/TiO2/C composites do not exhibit a large increase compared with the pure Li4Ti5O12 and Li4Ti5O12/TiO2 composite, a more stable cycle curves (Fig. 8a and b) can be observed for Li4Ti5O12/C and Li4Ti5O12/TiO2/C composites, which is contributed by the high electrical conductivity of the in situ formed carbon.

Electrochemical impedance spectroscopy (EIS) measurement was performed, and the corresponding Nyquist plots are displayed in Fig. 9. All the Nyquist plots exhibit one semicircle in the high frequency range and a sloping straight line in the low frequency range. The diameter of the semicircle is mainly related to the surface charge transfer resistance (Rct), associated with the interfacial electrochemical reaction activity, and the sloping straight line in low frequency region corresponds to the lithium ion diffusion process in the electrodes.2,8,15 Nyquist plots are fitted using the equivalent circuit (inset of Fig. 9). In this equivalent circuit, Rs is the electrode resistance, Rct is the charge-transfer resistance, CPE is the double layer capacitance and Zw represents the Warburg impedance.


image file: c5ra12397f-f9.tif
Fig. 9 Electrochemical impedance spectra (Nyquist plots) and corresponding simulation results of pure Li4Ti5O12, Li4Ti5O12/C, Li4Ti5O12/TiO2 and Li4Ti5O12/TiO2/C composites, respectively. The inset is the equivalent circuit used for plots fitting.

Fig. 10a shows the enlarged Nyquist plots at high frequency region. It is found that the sizes of semicircles for Li4Ti5O12/C and Li4Ti5O12/TiO2/C composites are smaller than that of pure Li4Ti5O12 and Li4Ti5O12/TiO2 composite. That is to say, the Li4Ti5O12/C and Li4Ti5O12/TiO2/C composites possess the smaller charge transfer resistance compared with pure Li4Ti5O12 and Li4Ti5O12/TiO2 composite, which could be attributed to enhanced electrical conductivity derived from the in situ formed carbon.7,15 Moreover, the slopes in low frequency are directly proportional to the lithium ion diffusion coefficient (DLi).42–44 The DLi can be calculated from the plots in low frequency region according to the following equations:42,45,46

 
D = R2T2/2A2n4F4CLi2σ2 (1)
 
Zre = Re + Rct + σω−1/2 (2)
where R is the gas constant, T is the absolute temperature, A is the surface area of the electrode, n is the number of electrons transferred in the half-reaction for the redox couple, F is the Faraday constant, CLi is the concentration of lithium ion in solid, and σ is the Warburg factor, which is relative to Zre-σ and can be obtained from the slope of the lines in Fig. 10b. As expressed in above equations, it is clear that D is inversely proportional to σ. Furthermore, the slope of the linear fitting lines of Zre vs. ω is σ. As shown in Fig. 10b, the Li4Ti5O12/TiO2 and Li4Ti5O12/TiO2/C composites have a smaller slope compared to pure Li4Ti5O12 and Li4Ti5O12/C composite, demonstrating that a higher Li+ diffusion coefficient could be obtained for the Li4Ti5O12/TiO2 and Li4Ti5O12/TiO2/C composites. The higher Li+ diffusion coefficient could be ascribed to the contribution of anatase TiO2 and the abundant phase interfaces.16,47 Meanwhile, the Li4Ti5O12/C composite presents a smaller slope in comparison with pure Li4Ti5O12 due to the existence of Ti3+. The results of EIS indicate that the Li4Ti5O12/TiO2/C composite possesses higher charge transfer kinetics and ionic mobility derived from large number of grain boundaries and phase interfaces, and in situ formed carbon, which could well explain the better electrochemical performance of the Li4Ti5O12/TiO2/C composite.


image file: c5ra12397f-f10.tif
Fig. 10 (a) Enlarged Nyquist plots at high frequency region and (b) graph of Zre plotted against ω−1/2 at low frequency region of pure Li4Ti5O12, Li4Ti5O12/C, Li4Ti5O12/TiO2 and Li4Ti5O12/TiO2/C composites, respectively.

The Li4Ti5O12/TiO2/C nanocrystalline composite reported here presents excellent rate capability and cycling stability, which are compared favourably to other Li4Ti5O12/TiO2/C composites and Li4Ti5O12/TiO2 based electrodes reported in the literatures.8,15,23,48,49 The superior electrochemical performance of the Li4Ti5O12/TiO2/C nanocrystalline composite might be attributed to the synergistic effects of nanocrystalline structure, large number of grain boundaries and phase interfaces, and in situ formed carbon. Firstly, nanocrystalline could shorten the diffusion distance for both electron and lithium ions. Secondly, overall conductivity of the electrode and the transportation of lithium ions can be enhanced by the in situ formed carbon and anatase TiO2, which result in excellent rate capability. Moreover, the higher theoretical capacities of anatase TiO2 and in situ formed carbon could contribute partial capacity to the improved capacity of the Li4Ti5O12/TiO2/C composite. Thirdly, the abundant grain boundaries and phase interfaces in the Li4Ti5O12/TiO2/C composite can store extra lithium ions and improve the kinetics of the electrode, which make contribution to increasing the specific capacity and guaranteeing the fast lithium-ion insertion/extraction reaction.

Conclusions

In summary, we have reported a novel strategy to synthesize Li4Ti5O12/TiO2/C nanocrystalline composite by a facile sol–gel process followed by calcination. As anode materials for LIBs, the Li4Ti5O12/TiO2/C nanocrystalline composite presents better electrochemical performance compared with pure Li4Ti5O12, Li4Ti5O12/C and Li4Ti5O12/TiO2 composites, which can deliver a favorable reversible capacity of 102 mA h g−1 (333 mA h cm−3) at 1C after 100 cycles and still show a relatively high discharge capacity of 88 mA h g−1 (286 mA h cm−3) at 30C. Therefore, the Li4Ti5O12/TiO2/C nanocrystalline composite can be a potential anode material for advanced LIBs.

Acknowledgements

This work was supported by the National Natural Science Foundation of China (51372225), and the Natural Science Foundation of Zhejiang Province, China (LY13B010001).

Notes and references

  1. J. M. Tarascon and M. Armand, Nature, 2001, 414, 359–367 CrossRef CAS PubMed.
  2. Y. Xia, Z. Xiao, X. Dou, H. Huang, X. H. Lu, R. J. Yan, Y. P. Gan, W. J. Zhu, J. P. Tu, W. K. Zhang and X. Y. Tao, ACS Nano, 2013, 7, 7083–7092 CrossRef CAS PubMed.
  3. H. Huang, W. Zhu, X. Tao, Y. Xia, Z. Yu, J. Fang, Y. Gan and W. Zhang, ACS Appl. Mater. Interfaces, 2012, 4, 5974–5980 CAS.
  4. Y. K. Sun, S. T. Myung, B. C. Park, J. Prakash, I. Belharouak and K. Amine, Nat. Mater., 2009, 8, 320–324 CrossRef CAS PubMed.
  5. M. Rahman, J. Z. Wang, M. F. Hassan, D. Wexler and H. K. Liu, Adv. Energy Mater., 2011, 1, 212–220 CrossRef CAS PubMed.
  6. G. H. Jeong, H. B. Bae, D. Choi, Y. H. Kim, S. Yoon and S. W. Kim, J. Phys. Chem. C, 2012, 116, 23851–23857 CAS.
  7. W. Zhu, H. Yang, K. Nakanishi, K. Kanamori and X. Guo, RSC Adv., 2015, 5, 24803–24813 RSC.
  8. T. F. Yi, Z. K. Fang, Y. Xie, Y. R. Zhu and S. Y. Yang, ACS Appl. Mater. Interfaces, 2014, 6, 20205–20213 CAS.
  9. J. Y. Liao, V. Chabot, M. Gu, C. M. Wang, X. C. Xiao and Z. W. Chen, Nano Energy, 2014, 9, 383–391 CrossRef CAS PubMed.
  10. W. Zhu, H. Huang, W. Zhang, X. Tao, Y. Gan, Y. Xia, H. Yang and X. Guo, Electrochim. Acta, 2015, 152, 286–293 CrossRef CAS PubMed.
  11. Y. Xia, W. K. Zhang, Z. Xiao, H. Huang, H. J. Zeng, X. R. Chen, F. Chen, Y. P. Gan and X. Y. Tao, J. Mater. Chem., 2012, 22, 9209–9215 RSC.
  12. J. Wang, H. L. Zhao, Q. Yang, C. M. Wang, P. P. Lv and Q. Xia, J. Power Sources, 2013, 222, 196–201 CrossRef CAS PubMed.
  13. W. J. Zhu, H. Huang, Y. P. Gan, X. Y. Tao, Y. Xia and W. K. Zhang, Electrochim. Acta, 2014, 138, 376–382 CrossRef CAS PubMed.
  14. Y. M. Jiang, K. X. Wang, X. Y. Wu, H. J. Zhang, B. M. Bartlett and J. S. Chen, ACS Appl. Mater. Interfaces, 2014, 6, 19791–19796 CAS.
  15. J. M. Sun, D. H. Teng, Y. Liu, C. Chi, Y. H. Yu, J. L. Lan and X. P. Yang, RSC Adv., 2014, 4, 48632–48638 RSC.
  16. J. Y. Liao, X. C. Xiao, D. Higgins, D. G. Lee, F. Hassan and Z. W. Chen, Electrochim. Acta, 2013, 108, 104–111 CrossRef CAS.
  17. L. Yu, H. B. Wu and X. W. Lou, Adv. Mater., 2013, 25, 2296–2300 CrossRef CAS PubMed.
  18. L. Sun, J. P. Wang, K. L. Jiang and S. S. Fan, J. Power Sources, 2014, 248, 265–272 CrossRef CAS PubMed.
  19. Y. Sun, L. Zhao, H. Pan, X. Lu, L. Gu, Y.-S. Hu, H. Li, M. Armand, Y. Ikuhara and L. Chen, Nat. Commun., 2013, 4, 1870 CrossRef PubMed.
  20. A. Nugroho, S. J. Kim, W. Chang, K. Y. Chung and J. Kim, J. Power Sources, 2013, 244, 164–169 CrossRef CAS PubMed.
  21. Y. G. Wang, H. M. Liu, K. X. Wang, H. Eiji, Y. R. Wang and H. S. Zhou, J. Mater. Chem., 2009, 19, 6789–6795 RSC.
  22. H. G. Jung, N. Venugopal, B. Scrosati and Y. K. Sun, J. Power Sources, 2013, 221, 266–271 CrossRef CAS PubMed.
  23. L. P. Wang, H. Q. Zhang, Q. J. Deng, Z. L. Huang, A. J. Zhou and J. Z. Li, Electrochim. Acta, 2014, 142, 202–207 CrossRef CAS.
  24. X. Li, Y. Zhou, P. X. Huang, H. Peng, W. Li, M. Z. Qu, Z. L. Yu, X. B. Huang and Y. D. Chen, Int. J. Electrochem. Sci., 2014, 9, 4816–4825 CAS.
  25. C. Lai, X. L. Cao, X. C. Yuan, Y. L. Wang and S. H. Ye, Solid State Ionics, 2013, 249, 151–157 CrossRef PubMed.
  26. G. Y. Liu, H. Y. Wang, G. Q. Liu, Z. Z. Yang, B. Jin and Q. C. Jiang, Electrochim. Acta, 2013, 87, 218–223 CrossRef CAS PubMed.
  27. B. T. Zhao, S. M. Jiang, C. Su, R. Cai, R. Ran, M. O. Tade and Z. P. Shao, J. Mater. Chem. A, 2013, 1, 12310–12320 CAS.
  28. L. Kavan, M. Kalbac, M. Zukalova, I. Exnar, V. Lorenzen, R. Nesper and M. Graetzel, Chem. Mater., 2004, 16, 477–485 CrossRef CAS.
  29. Z. Q. Zhu, F. Y. Cheng and J. Chen, J. Mater. Chem. A, 2013, 1, 9484–9490 CAS.
  30. Y. F. Tang, F. Q. Huang, W. Zhao, Z. Q. Liu and D. Y. Wan, J. Mater. Chem., 2012, 22, 11257–11260 RSC.
  31. H. C. Choi, Y. M. Jung and S. B. Kim, Vib. Spectrosc., 2005, 37, 33–38 CrossRef CAS PubMed.
  32. X. Zhang, Z. Xing, L. L. Wang, Y. C. Zhu, Q. W. Li, J. W. Liang, Y. Yu, T. Huang, K. B. Tang, Y. T. Qian and X. Y. Shen, J. Mater. Chem., 2012, 22, 17864–17869 RSC.
  33. Z. Song, J. Hrbek and R. Osgood, Nano Lett., 2005, 5, 1327–1332 CrossRef CAS.
  34. L. F. Shen, X. G. Zhang, E. Uchaker, C. Z. Yuan and G. Z. Cao, Adv. Energy Mater., 2012, 2, 691–698 CrossRef CAS PubMed.
  35. M. Armand and J. M. Tarascon, Nature, 2008, 451, 652–657 CrossRef CAS PubMed.
  36. Y. P. Gan, L. Y. Zhu, H. P. Qin, Y. Xia, H. Xiao, L. S. Xu, L. Y. Ruan, C. Liang, X. Y. Tao, H. Huang and W. K. Zhang, Solid State Ionics, 2015, 269, 44–50 CrossRef CAS PubMed.
  37. H.-G. Jung, M. W. Jang, J. Hassoun, Y.-K. Sun and B. Scrosati, Nat. Commun., 2011, 2, 516 CrossRef PubMed.
  38. A. Prakash, P. Manikandan, K. Ramesha, M. Sathiya, J. Tarascon and A. Shukla, Chem. Mater., 2010, 22, 2857–2863 CrossRef CAS.
  39. C. X. Peng, B. D. Chen, Y. Qin, S. H. Yang, C. Z. Li, Y. H. Zuo, S. Y. Liu and J. H. Yang, ACS Nano, 2012, 6, 1074–1081 CrossRef CAS PubMed.
  40. S. L. Xiong, J. S. Chen, X. W. Lou and H. C. Zeng, Adv. Funct. Mater., 2012, 22, 861–871 CrossRef CAS PubMed.
  41. L. Q. Tao, J. T. Zai, K. X. Wang, H. J. Zhang, M. Xu, J. Shen, Y. Z. Su and X. F. Qian, J. Power Sources, 2012, 202, 230–235 CrossRef CAS PubMed.
  42. T. F. Yi, S. Y. Yang, M. Tao, Y. Xie, Y. R. Zhu and R. S. Zhu, Electrochim. Acta, 2014, 134, 377–383 CrossRef CAS PubMed.
  43. A. Y. Shenouda and H. K. Liu, J. Alloys Compd., 2009, 477, 498–503 CrossRef CAS PubMed.
  44. G. J. Du, Z. L. Liu, S. W. Tay, X. G. Liu and A. S. Yu, Chem.–Asian J., 2014, 9, 2514–2518 CrossRef CAS PubMed.
  45. S.-L. Chou, J.-Z. Wang, H.-K. Liu and S.-X. Dou, J. Phys. Chem. C, 2011, 115, 16220–16227 CAS.
  46. J. Chen, L. Yang, S. Fang, S.-i. Hirano and K. Tachibana, J. Power Sources, 2012, 200, 59–66 CrossRef CAS PubMed.
  47. L. F. Shen, E. Uchaker, X. G. Zhang and G. Z. Cao, Adv. Mater., 2012, 24, 6502–6506 CrossRef CAS PubMed.
  48. Y. P. Tang, X. X. Tan, G. Y. Hou and G. Q. Zheng, Electrochim. Acta, 2014, 117, 172–178 CrossRef CAS PubMed.
  49. L. Gao, R. J. Liu, H. Hu, G. J. Li and Y. Yu, Nanotechnology, 2014, 25, 175402 CrossRef PubMed.

Footnote

Electronic supplementary information (ESI) available. See DOI: 10.1039/c5ra12397f

This journal is © The Royal Society of Chemistry 2015