DOI:
10.1039/C5RA11861A
(Paper)
RSC Adv., 2015,
5, 82247-82251
Inorganic microcapsules mineralized at the interface of water droplets in ethanol solution and their application as drug carriers†
Received
19th June 2015
, Accepted 18th September 2015
First published on 21st September 2015
Abstract
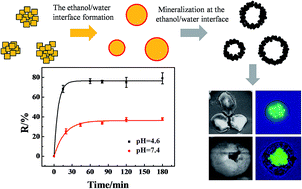
This paper reported a crystallization – dissolution – interface mineralization (CDIM) method on synthesizing calcium carbonate (CaC) and calcium phosphate (CaP) inorganic microcapsules with good biocompatibility and good pH sensitivity. The method is based on mineralization at the ethanol/water interface. The microcapsules were formed in a few seconds and did not need post treatment for removing the templates. The diameters of the microcapsules can be controlled by the size of the crystal clusters regulated by stirring time. Carboxyfluorescein (CF) molecules as model drugs were encapsulated inside the capsules after coating with FeIII–polyphenol tannic acid (TA) films. The pH sensitive carboxyfluorescein molecule releasing behavior was investigated. The lower pH caused faster and thorough release of CF. The CDIM method can be applied for fabricating other inorganic microcapsules, which holds great potential for drug delivery.
1. Introduction
Inorganic microcapsules have attracted tremendous attentions recently because of their applications in a wide range of areas, such as targeted drug delivery,1,2 wastewater treatment,3 micro reactors,4,5 micro templates,6 autonomous motors,7 lithium ion batteries,8,9 sensors10,11 and catalysts.12 With many significant and substantial efforts, facile and effective methods have been developed for the fabrication of various inorganic microcapsules, which can be divided into two categories, i.e., template-free synthesis, and template-based synthesis. The template-free synthesis is commonly based on Ostwald ripening.13–15 Wang et al.15 fabricated Fe3O4 microcapsules by inside-out Ostwald ripening as an anode material for lithium-ion batteries. The hard templates include particles of Cu2O16, SiO2,17 MnCO3,18 Co0.33Mn0.67CO3,19 silica,20 polystyrene21 and carbon spheres,22,23etc. Park et al.20 prepared uniform hollow metal oxide particles using silica templates through calcinating silica@coordination polymer. Zhang et al.24 fabricated TiO2 microcapsules using carbon spheres as templates for lithium storage. The soft templates are bubbles,25 emulsions,26 vesicles,27 micelles,28 and yeasts.29,30 Luo et al.25 reported a one-pot synthesis of metal sulfide microcapsules using CO2 and NH3 bubbles as soft templates. Xu et al.27 used cetyltrimethylammonium bromide (CTAB) multilamellar vesicles as soft templates to synthesize multishelled Cu2O microcapsules. The template-based synthesis is the most commonly used way to prepare microcapsules, but it requires tedious post-treatment which limits its applications and developments. It remains a significant challenge to develop a simple, effective, and suitable for massive production process for microcapsule fabrication.
Herein, we presented a novel and effective strategy to prepare microcapsules without post-treatment. We call it crystallization – dissolution – interface mineralization (CDIM) method. The crystal clusters of Na2CO3/K2HPO4 are formed in ethanol by adding saturated aqueous Na2CO3/K2HPO4 solution into ethanol. Because of the attraction of water by ethanol, the saturated Na2CO3/K2HPO4 solution becomes over saturated to result in crystals, as schematically shown in Fig. 1a. Upon adding additional water into the mixed solution, the crystals in ethanol are dissolved to form liquid droplets in the ethanol solution (Fig. 1b). If the ethanol contains CaI2, the mineralization occurs at the interface of salt water droplet and its surrounding ethanol (Fig. 1c). To the best of our knowledge, there is no report on fabricating microcapsules using CDIM method with the interface of water/ethanol. The calcium carbonate (CaC) and calcium phosphate (CaP) inorganic microcapsules were successfully fabricated using this method, which were then tested for drug release triggered by pH after coating with FeIII–polyphenol tannic acid (TA) film. CDIM method can be used for fabrication of various inorganic microcapsules.
|
| Fig. 1 The schematic of CDIM method for inorganic microcapsule formation. (a) Crystallization of salt, (b) dissolution upon addition of water, (c) interfacial mineralization to form microcapsules. | |
2. Experimental
2.1. Materials
Calcium iodide (CaI2, 98%) and 5(6)-carboxyfluorescein (C21H12O7, 95%) were purchased from Aladdin (China). Fluorescence latex beads (carboxylate-modified polystyrene, 0.03 μm, 2.5%) were purchased from Sigma (China). Dipotassium phosphate (K2HPO4·3H2O, 99%), dibasic sodium phosphate (Na2HPO4·2H2O, 99%) and sodium carbonate (Na2CO3, 99%) were purchased from Xilong chemicals (China). Citric acid (C6H8O7·H2O, 99.5%) was purchased from Tianjin Fengchuan (China). Ethanol (C2H5OH, 99.7%) was purchased from Tianjin Tianli chemicals (China). Ferric chloride (FeCl3, 97.0%) was purchased from Sinopharm chemicals (China). Tannic acid (C76H52O46) was purchased from Sigma-Aldrich (China). The solutions were prepared with ultrapure water (18.2 MΩ cm).
2.2. Preparation of CaC and CaP microcapsules
The details on preparing CaC microcapsules are described as below. 500 μL saturated Na2CO3 aqueous solution (1 M at 20 °C) was injected into 50 mL ethanol under magnetic stirring about 1400 rpm for 3 h to prepare Na2CO3 crystal clusters in ethanol. After that 1 mL Na2CO3 crystals in ethanol and 1 mL 0.2 M CaI2 ethanol solution were mixed homogeneously. The CaC microcapsules were formed in 1200 ms by the addition of 2 mL water. The precipitates were washed by centrifuging with ethanol for 3 times. The CaP microcapsules were synthesized as follow. 500 μL saturated K2HPO4 aqueous solution (4 M at 20 °C) was injected into 50 mL ethanol under magnetic stirring about 1400 rpm for 6 h to prepare K2HPO4 crystal clusters in ethanol. Then 1 mL K2HPO4 crystals in ethanol and 1 mL 0.7 M CaI2 ethanol solution were mixed well. After adding 2 mL water, the CaP microcapsules were formed in 300 ms. The precipitates were washed by centrifuging with ultrapure water for 3 times.
2.3. The observation of microcapsule formation under microscope
The forming processes of CaC and CaP microcapsules were observed by microscope, and videos were recorded. 25 μL ethanol containing crystal clusters, 25 μL CaI2 ethanol solution and 50 μL water were injected into a sealed cell in a proper order as described in Section 2.2.
2.4. Model drug loading and in vitro release
The FeIII–TA coating reaction was described elsewhere.31 In brief, 30 μL 2 mg mL−1 carboxyfluorescein (CF), 1 mL sodium dihydrogen phosphate-citrate buffer solution and 200 μL 9 mg mL−1 CaP microcapsules were mixed together. 1 mL 1 mg mL−1 (3.7 mM) FeCl3 and 1 mL 4 mg mL−1 (2.4 mM) TA were added into the mixture solution for 30 min in order to form TA films on the surface of capsule. Then the supernatant liquid was taken away. FeIII–TA coating was repeated for several times. The releasing behavior of CF controlled by pH (4.6 and 7.4) was performed using fluorescence spectrophotometer.
2.5. Characterizations
The morphology of the CaC and CaP microcapsules was characterized with a scanning electron microscopy (Quanta 200 FEG, Netherlands) at an accelerating voltage of 20 kV. The sample was prepared by casting purified products onto a piece of silicon wafer. Powder X-ray diffraction (XRD) was measured in the reflection mode (Cu Kα radiation) on a diffractometer (D/Max-RB, Japan). Fluorescence microscopy images were obtained using a Nikon Eclipse 80i fluorescence microscope. Fluorescence measurements were performed on a fluorescence spectrophotometer (Fluoro Max-4, US).
3. Results and discussion
The crystal clusters of Na2CO3 and K2HPO4 were prepared by adding 500 μL Na2CO3/K2HPO4 saturated solution into 50 mL ethanol. Due to the extraction of water by ethanol, Na2CO3 and K2HPO4 were crystallized in the ethanol. Their XRD patterns are shown in Fig. S1,† which confirms that the crystallized samples are Na2CO3 crystals according to standard data (PDF: 19-1130), and K2HPO4 crystals according to standard data (PDF: 25-0639), respectively. Their SEM images are shown in Fig. 1a and f. The diameter is ∼1.3 μm for Na2CO3 crystal and ∼3.2 μm for K2HPO4 crystals respectively. After mineralization, CaC microcapsules contain mainly amorphous CaCO3 with a small amount of vaterite according to XRD data in Fig. S2c.† While CaP microcapsules are a mixture of brushite (PDF: 09-0077) and calcium hydrogen phosphate hydroxide (PDF: 09-0432) from XRD patterns in Fig. S2d.† SEM images of CaC and CaP microcapsules are shown in Fig. 2b and g respectively. The walls of CaC microcapsules are too thin to keep their original shape in the vacuum chamber as shown in Fig. 2b. By measuring the folded wrinkles, the wall thickness is ∼1 μm. On the contrary, the CaP microcapsules are more rigid with the wall thickness of ∼7 μm as shown in Fig. 2g. The hollow nature of the microcapsules is confirmed by the open hole of zoom-in image of one microcapsule in the top inset of Fig. 2g. The hollow nature of microcapsules was also studied using fluorescent microscope. Small amount of green fluorescent latex beads were mixed inside the NaCO3 and K2HPO4 crystals, which were then used for forming microcapsules. The bright field and fluorescence images of CaC microcapsule are shown in Fig. 2c and d respectively. After merging these two images, a clear green core and dark ring can be seen in Fig. 2e, which confirmed its capsule structure. Similarly, the bright field, fluorescence images of CaP microcapsules, and their merged image are shown in Fig. 2h–j respectively. It is noted that its wall is much thicker than that of CaC microcapsule, which is consistent to the SEM results.
|
| Fig. 2 The SEM images of Na2CO3 (a), K2HPO4 (f) crystals, CaC microcapsules (b) and CaP microcapsules (g). Insets in image (b) and (g) are the enlarged images at a higher magnification. The bright field (c and h), fluorescence (d and i), and merged images (e and f) of CaC and CaP microcapsules containing latex beads. | |
Above experimental results confirms the validity of CDIM method on inorganic microcapsule fabrication. In the following context, the parameters influencing the microcapsule formation were studied. The concentration of CaI2 was adjusted to be 0.05 M, 0.2 M and 0.7 M for CaC microcapsules, respectively. The microcapsule formed only at 0.2 M CaI2. Similarly 0.7 M CaI2 was chosen for CaP microcapsule formation. The diameters of CaC and CaP microcapsules were related to the size of Na2CO3 and K2HPO4 crystal clusters. The stirring time was controlled during the crystallization step. The diameter of microcapsules was analyzed by ImageJ. The stirring time of 10 min and 180 min were studied for CaC microcapsules. There is almost no difference between 10 and 180 minute stirring. The microcapsule shown in Fig. 3a was formed with 180 minute stirring for the crystallization. The diameter of microcapsule is ∼27 μm. In terms of CaP microcapsules, the stirring time was studied with 10 min and 1 h. Their corresponding capsules are ∼50 and 24 μm in diameter, respectively as shown in Fig. 3b. With the stirring time over 1 h, there is no influence on microcapsule size. The discrepancy of stirring time influence on CaC and CaP microcapsules comes from the nature of Na2CO3 and K2HPO4 crystal clusters, i.e., Na2CO3 is easier to break into small clusters compared with K2HPO4 crystals.
|
| Fig. 3 The diameter distribution and fitted curves of microcapsules against stirring time for the formation of Na2CO3 (a), and K2HPO4 (b) crystal clusters. Insets are the typical bright field (left) and fluorescence (right) microscope images of CaC and CaP microcapsules after corresponding stirring time. The scale bar is 20 μm. | |
The forming processes of CaC and CaP microcapsules were recorded by the camera equipped in the microscope. ImageJ software was used to convert video into frame images, as shown in Fig. 4. The videos of CaC and CaP microcapsules forming processes were provided in ESI,† which were slowed down by 50 and 100 times respectively. The crystal clusters of Na2CO3 and K2HPO4 are shown in Fig. 4a and e. Upon the addition of water, crystals were dissolved as shown in Fig. 4b and f. In Fig. 4b, c, d, g and h, a clear interface can be seen. CaC microcapsules were fabricated in 1200 ms, whilst CaP microcapsule formation only took 300 ms. In Fig. 4d, there is some crystals in the microcapsules because water and ethanol was not mixed uniformly in a limited space under microscope without stirring. Normally all the crystals disappeared after microcapsule formation. The process is similar to Kirkendall effect, which was used to fabricate hollow metal nanostructures.32,33 However, in our case the temperature is the room temperature rather than ∼180 °C, and the interface crystallization took less than 1.2 s which is much faster than several hours for fabricating metal capsules using Kirkendall effect.33 The Kirkendall effect involves diffusion of metal atoms, therefore needs high temperature and long time. While CDIM method involves metal ions diffusion in the liquid phase, resulting in microcapsule formation in short time and low temperature.
|
| Fig. 4 The images of CaC microcapsule formation ((a): 0 ms, (b): 400 ms, (c): 800 ms and (d): 1200 ms) and CaP microcapsule formation ((e): 0 ms, f: 100 ms, (g): 200 ms and (h): 300 ms). The scale bar is 50 μm. | |
The fabricated microcapsule is porous structure, as shown in bottom inset in Fig. 2g. Therefore FeIII–TA films were used to coat the capsule surface in order to keep encapsulated CF inside the capsules. In order to confirm the FeIII–TA films on capsule surface, FTIR spectra of CaP, FeIII–TA, and CaP with FeIII–TA films were carried out, as shown in curve 1, 2 and 3 of Fig. 5a respectively. The peaks at 555 cm−1, 590 cm−1, 1030 cm−1 and 1103 cm−1 in curve 1 of Fig. 5a are attributed to PO43− in pure CaP microcapsules. In curve 2 of Fig. 5a, the peak at 1195 cm−1 is due to aromatic C–O–C antisymmetric stretching vibrations, and peaks at 1440 cm−1, 1490 cm−1 and 1603 cm−1 correspond to aromatic rings in TA molecules. Curve 3 of Fig. 5a contains almost all the characteristic peaks of pure CaP capsules and FeIII–TA films, which indicates the successful coating of FeIII–TA films on the capsule surface. The optical image of FeIII–TA films coated CaP microcapsule is shown in Fig. 5b. After dissolving CaP in pH 3 solution, the FeIII–TA film was left, as shown in Fig. 5c. It also confirmed that films were successfully coated.
|
| Fig. 5 (a) The FTIR spectra of CaP capsules (curve 1), FeIII–TA films (curve 2), and FeIII–TA films coated CaP capsules (curve 3). The optical images of FeIII–TA film coated CaP microcapsule before (b) and after (c) dissolving CaP in pH 3 buffers. The scale bar is 20 μm. | |
The good points of CaP microcapsules as drug carriers are biocompatible and pH responsive, since they have been proved as bioactive implants34–36 and drug carrier.37–39 The CF releasing from FeIII–TA films coated CaP microcapsules was studied as function of pH values. In Fig. 6, the releasing behavior controlled by buffer solution with different pH (4.6 and 7.4) was performed by fluorescence spectrophotometer. Because the CF is sensitive to pH, the data in Fig. 6 have been corrected according the curve in Fig. S2.† The data for the controlled drug releasing within 3 h are fit very well with an exponential eqn (1).
where
R is the percentage of CF releasing,
α is the maximum releasing percentage and
b is the parameter corresponding to the releasing rate.
|
| Fig. 6 The release curves of CaP microcapsules coated with FeIII–TA films at different pH. | |
In Fig. 6, the maximized releasing percentages are 76.5% and 36.2% at pH 4.6 and 7.4 respectively. The b value is 0.15 and 0.06 at pH 4.6 and 7.4 respectively. All the data indicate a faster and more thorough release of CF at lower pH solution, which is due to the dissolution of CaP wall.
4. Conclusions
The novel CDIM method was developed for fabricating inorganic microcapsules. It was successfully exploited to synthesize CaC and CaP microcapsules. The microcapsules are biocompatible and pH responsive, which makes them good candidates as drug carriers. When pH values were 7.4 and 4.6, the maximum release percentage of CF from CaP microcapsules are about 36.2% and 76.5%, respectively, which implies that CaP microcapsules are promising in drug delivery. The CDIM method has a great potential for massive production of inorganic microcapsules.
Acknowledgements
This work was supported by the National Natural Science Foundation of China (Grant No. 21273059, 21003032, 21528501, 21511130060), State Key Laboratory of Urban Water Resource and Environment (Harbin Institute of Technology) (Grant No. 2014DX09), and Harbin Science and Technology Research Council (Grant No. 2014RFXXJ063).
Notes and references
- Y. Chen, H. R. Chen, D. P. Zeng, Y. B. Tian, F. Chen, J. W. Feng and J. L. Shi, ACS Nano, 2010, 4, 6001–6013 CrossRef CAS PubMed.
- Y. Wang and H. Gu, Adv. Mater., 2015, 27, 576–585 CrossRef CAS PubMed.
- B. Wang, H. Wu, L. Yu, R. Xu, T. T. Lim and X. W. Lou, Adv. Mater., 2012, 24, 1111–1116 CrossRef CAS PubMed.
- Y. Yamada, M. Mizutani, T. Nakamura and K. Yano, Chem. Mater., 2010, 22, 1695–1703 CrossRef CAS.
- A. M. Yashchenok, M. Delcea, K. Videnova, E. A. Jares-Erijman, T. M. Jovin, M. Konrad, H. Mohwald and A. G. Skirtach, Angew. Chem., Int. Ed., 2010, 49, 8116–8120 CrossRef CAS PubMed.
- J. Li, Z. Jiang, H. Wu, L. Zhang, L. Long and Y. Jiang, Soft Matter, 2010, 6, 542–550 RSC.
- Y. J. Wu, Z. G. Wu, X. K. Lin, Q. He and J. B. Li, ACS Nano, 2012, 6, 10910–10916 CAS.
- J. Y. Wang, N. L. Yang, H. J. Tang, Z. H. Dong, Q. Jin, M. Yang, D. Kisailus, H. J. Zhao, Z. Y. Tang and D. Wang, Angew. Chem., Int. Ed., 2013, 52, 6417–6420 CrossRef CAS PubMed.
- L. Zhou, D. Y. Zhao and X. W. Lou, Angew. Chem., Int. Ed., 2012, 51, 239–241 CrossRef CAS PubMed.
- S. Ci, T. Huang, Z. Wen, S. Cui, S. Mao, D. A. Steeber and J. Chen, Biosens. Bioelectron., 2014, 54, 251–257 CrossRef CAS PubMed.
- X. Y. Lai, J. Li, B. A. Korgel, Z. H. Dong, Z. M. Li, F. B. Su, J. A. Du and D. Wang, Angew. Chem., Int. Ed., 2011, 50, 2738–2741 CrossRef CAS PubMed.
- S. Mandal, M. Sathish, G. Saravanan, K. K. R. Datta, Q. M. Ji, J. P. Hill, H. Abe, I. Honma and K. Ariga, J. Am. Chem. Soc., 2010, 132, 14415–14417 CrossRef CAS PubMed.
- L. Cao, D. H. Chen and R. A. Caruso, Angew. Chem., Int. Ed., 2013, 52, 10986–10991 CrossRef CAS PubMed.
- A. Q. Pan, H. B. Wu, L. Yu and X. W. Lou, Angew. Chem., Int. Ed., 2013, 52, 2226–2230 CrossRef CAS PubMed.
- B. Wang, H. B. Wu, L. Zhang and X. W. Lou, Angew. Chem., Int. Ed., 2013, 52, 4165–4168 CrossRef CAS PubMed.
- M. L. Pang, J. Y. Hu and H. C. Zeng, J. Am. Chem. Soc., 2010, 132, 10771–10785 CrossRef CAS PubMed.
- L. Yu, H. B. Wu and X. W. Lou, Adv. Mater., 2013, 25, 2296–2300 CrossRef CAS PubMed.
- W. Liu, J. Liu, K. F. Chen, S. M. Ji, Y. L. Wan, Y. C. Zhou, D. F. Xue, P. Hodgson and Y. C. Li, Chem.–Eur. J., 2014, 20, 824–830 CrossRef CAS PubMed.
- L. Zhou, D. Y. Zhao and X. W. Lou, Adv. Mater., 2012, 24, 745–748 CrossRef CAS PubMed.
- J. U. Park, H. J. Lee, W. Cho, C. Jo and M. Oh, Adv. Mater., 2011, 23, 3161–3164 CrossRef CAS PubMed.
- S. X. Li, J. B. Cai, X. Q. Wu, F. Y. Zheng, X. F. Lin, W. J. Liang, J. Chen, J. Z. Zheng, Z. H. Lai, T. J. Chen and L. C. Zhu, Appl. Catal., B, 2014, 160, 279–285 CrossRef PubMed.
- Z. H. Dong, X. Y. Lai, J. E. Halpert, N. L. Yang, L. X. Yi, J. Zhai, D. Wang, Z. Y. Tang and L. Jiang, Adv. Mater., 2012, 24, 1046–1049 CrossRef CAS PubMed.
- G. Q. Zhang and X. W. Lou, Angew. Chem., Int. Ed., 2014, 53, 9041–9044 CrossRef CAS PubMed.
- G. Zhang, H. B. Wu, T. Song, U. Paik and X. W. D. Lou, Angew. Chem., Int. Ed., 2014, 53, 1–5 CrossRef PubMed.
- M. Luo, Y. Liu, J. C. Hu, J. L. Li, J. Liu and R. M. Richards, Appl. Catal., B, 2012, 125, 180–188 CrossRef CAS PubMed.
- X. Wang, W. Zhou, J. Cao, W. Liu and S. Zhu, J. Colloid Interface Sci., 2012, 372, 24–31 CrossRef CAS PubMed.
- H. L. Xu and W. Z. Wang, Angew. Chem., Int. Ed., 2007, 46, 1489–1492 CrossRef CAS PubMed.
- M. Sasidharan and K. Nakashima, Acc. Chem. Res., 2014, 47, 157–167 CrossRef CAS PubMed.
- D. Z. Ni, L. Wang, Y. H. Sun, Z. R. Guan, S. Yang and K. B. Zhou, Angew. Chem., Int. Ed., 2010, 49, 4223–4227 CrossRef CAS PubMed.
- M. J. Huang and Y. J. Wang, J. Mater. Chem., 2012, 22, 626–630 RSC.
- H. Ejima, J. J. Richardson, K. Liang, J. P. Best, M. P. van Koeverden, G. K. Such, J. W. Cui and F. Caruso, Science, 2013, 341, 154–157 CrossRef CAS PubMed.
- Y. D. Yin, R. M. Rioux, C. K. Erdonmez, S. Hughes, G. A. Somorjai and A. P. Alivisatos, Science, 2004, 304, 711–714 CrossRef CAS PubMed.
- X. Liang, X. Wang, Y. Zhuang, B. Xu, S. Kuang and Y. D. Li, J. Am. Chem. Soc., 2008, 130, 2736–2737 CrossRef CAS PubMed.
- C. Schopper, D. Moser, W. Goriwoda, F. Ziya-Ghazvini, E. Spassova, G. Lagogiannis, A. Auterith and R. Ewers, Clin. Oral Implants Res., 2005, 16, 357–368 CrossRef PubMed.
- A. F. Lemos and J. M. F. Ferreira, Mater. Sci. Eng., C, 2000, 11, 35–40 CrossRef.
- C. Schiller, C. Rasche, M. Wehmoller, F. Beckmann, H. Eufinger, M. Epple and S. Weihe, Biomaterials, 2004, 25, 1239–1247 CrossRef CAS PubMed.
- W. Wei, G. H. Ma, G. Hu, D. Yu, T. Mcleish, Z. G. Su and Z. Y. Shen, J. Am. Chem. Soc., 2008, 130, 15808–15810 CrossRef CAS PubMed.
- B. P. Bastakoti, S. Guragain, Y. Yokoyama, S. Yusa and K. Nakashima, Langmuir, 2011, 27, 379–384 CrossRef CAS PubMed.
- M. P. Ginebra, T. Traykova and J. A. Planell, J. Controlled Release, 2006, 113, 102–110 CrossRef CAS PubMed.
Footnote |
† Electronic Supplementary Information (ESI) available: XRD patterns of Na2CO3, K2HPO4, CaC and CaP samples, and the calibration curve of maximum emission intensity against concentration of fluorescein with different pH. See DOI: 10.1039/c5ra11861a |
|
This journal is © The Royal Society of Chemistry 2015 |
Click here to see how this site uses Cookies. View our privacy policy here.