Pt–CeO2/reduced graphene oxide nanocomposite for the electrooxidation of formic acid and formaldehyde
Biuck Habibi* and
Nasrin Delnavaz
Electroanalytical Chemistry Laboratory, Department of Chemistry, Faculty of Sciences, Azarbaijan Shahid Madani University, Tabriz, Iran. E-mail: B.Habibi@azaruniv.edu; biuckhabibi_a@yahoo.com; Fax: +98 41 34327541; Tel: +98 41 34327541
First published on 24th August 2015
Abstract
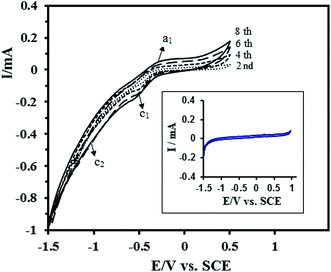
The Pt–CeO2/reduced graphene oxide nanocomposite on the carbon-ceramic electrode (Pt–CeO2/RGO/CCE) was prepared by a two-step electrodeposition process. RGO was deposited on the CCE through a simple electrochemical method using graphene oxide and CCE as the precursor and electrode substrate, respectively. Then, RGO/CCE was used as a support for the Pt–CeO2 nanoparticle deposition by another electrochemical process to form the nanocomposite based electrocatalyst; Pt–CeO2/RGO/CCE. The obtained electrocatalyst was characterized by scanning electron microscopy, energy dispersive X-ray spectroscopy, X-ray diffraction and cyclic voltammetric techniques. The electrocatalytic activity of the Pt–CeO2/RGO/CCE toward the oxidation of formic acid and formaldehyde was investigated by cyclic voltammetry and chronoamperometry in 0.1 M H2SO4 solution. It was found that the Pt–CeO2/RGO/CCE is electrocatalytically more active than the Pt–CeO2/CCE, Pt/RGO/CCE and Pt/CCE electrocatalysts. The increased electrocatalytic efficiency of Pt in Pt–CeO2/RGO/CCE is likely to result from its combination with CeO2 to form Pt–CeO2 nanoparticles and their deposition on/in the RGO layers at the CCE surface. From the obtained results, it could be concluded that the Pt–CeO2/RGO/CCE can be used as a potential and effective electrocatalyst for direct liquid fuel cell applications.
1. Introduction
Tailoring of the electrode surface with nanometals or nanocomposites is one of the more attractive approaches in designing electrochemical interfaces for electrocatalysis of fuel oxidation in direct liquid fuel cells (DLFCs).1,2 The nanostructured noble metals are of special interest in developing such interfaces owing to their unique electronic and electrocatalytic properties.3,4 At the same time, one of the main obstacles facing the development of the DLFCs via application of the nanostructured noble metals as an anodic material is its sluggish kinetics caused by the carbonaceous species poisoning effect. The intermediate carbonaceous products, such as carbon monoxide (CO), from fuel oxidation over the noble metal surface are strongly adsorbed on the electrocatalyst surface and caused catalyst poisoning. On the other hand, noble metal nanostructures due to the high surface energy have a tendency to aggregate, which will decrease their surface area and result in a remarkable reduction in their performance. Meanwhile, the increasing request for noble metals and their finite availability in nature cause them to be expensive. Consequently, it is desirable to explore simple and effective methods to prepare well-dispersed noble metal nanostructures with good size controllability to enhance their performance and tolerance to carbonaceous species and minimize the amount of noble metals used. In practice, to solve the problem of the poisoning effect, agglomeration and decreased usage of noble metals, an efficient strategy is to immobilize them along with different promoters in the form of alloy or conducting metal oxide/noble metal composite5–7 at the nanosized particles on the inside or on the surface of solid supports with low cost, high surface area and superior chemical stability.8 In fact, the electrocatalytic support retains the structure and morphology of the noble metal-based alloys or noble metal/metal oxide composites and exhibits a vital role in their swift performance and functionality. As mentioned above, to prevent the noble metal electrocatalysts such as Pt-based catalysts from being poisoned by carbonaceous species, especially CO, besides the efforts to developing the noble metal-based alloys,9,10 a recently developed strategy is to synthesize conducting metal oxide-based noble metal electrocatalysts using transition metal oxides.5 Among the high surface area transition metal oxides, CeO2, a material with a fluorite structure in which the cation valence state can be switch between Ce3+ and Ce4+, is of particular interest due to its high oxygen transfer ability, high efficiency for CO oxidation and much lower price, which might significantly promote fuel oxidation and reduce the preparation cost of the electrocatalysts.6,7,11,12 Several researchers have reported different kinds of interaction between noble metals and CeO2 and their effects on electrocatalytic activities.5–7,11–14 These studies have shown that the nature and level of interaction depend on the particular noble metal, electrocatalyst pretreatment, preparation technique, size of the CeO2 crystallite, lattice oxygen, and so on.13,14On the other hand, practically in the electrocatalytic oxidation of fuels in DLFCs, the Pt-based electrocatalysts were supported on a carbonic substrate surface and the supported electrocatalysts have always shown higher electrocatalytic activities and utilization efficiencies than unsupported ones.13–15 Nano dimensional carbonic materials such as carbon nanotubes, carbon nanofibers, carbon nanopowder, carbon dots and graphene not only have promising applications in many technological fields such as sensors,16 nanocomposites,17 batteries18 and supercapacitors,19 because of their excellent physical and chemical properties, but they also have high potential applications as a heterogeneous catalyst support for the dispersion and stabilization of the noble metal nanoparticles.20–23 Graphene and its famous relative, reduced graphene oxide (RGO), which can be considered as unrolled carbon nanotubes, owing to their unique sheet structure, high mechanical stiffness, ultrahigh electron conductivity and extremely large surface area as well as superior thermal/chemical stability, are novel carbonic nanomaterials that have emerged as rapidly rising stars in the field of material science.23–33 RGO, which was produced through the reduction of graphene oxide, displays a wrinkled structure due to the presence of lattice defects and provides a good platform to utilize it34–37 and its composites, hybrids and doped forms, which integrate the RGO with polymers, metal and metal oxide nanoparticles, nanotubes, fullerenes etc., in various applications.30,31,38–42 In this way, different nanocomposites and nanohybrids have been integrated with RGO or synthesized by using RGO as a template and were applied in different applications, especially in electrocatalytic utilizations36 such as sensors,34,35,43–46 biosensors,34,35,45,47,48 cathodic and anodic reactions in fuel cells38,41,45,47,49–54 and so on.45,46,53,54
In this work, for the first time, we have prepared Pt–CeO2/RGO/CCE by a two-step electrochemical procedure: (I) In the first step, the carbon-ceramic electrode (CCE), which has interesting properties such as high porosity, conductivity, relative chemical inertness, good mechanical properties, and physical rigidity and stability in various solvents,55–58 was coated by RGO via an electrochemical process. (II) In the second step, Pt–CeO2 nanoparticles were deposited electrochemically on the RGO/CCE. After physicochemical characterization of the Pt–CeO2/RGO/CCE, its electrocatalytic activity toward the oxidation of formic acid and formaldehyde was evaluated by cyclic voltammetric and chronoamperometric techniques in 0.1 M H2SO4 solution and the obtained results were compared with those obtained at the Pt–CeO2 and Pt modified carbon-ceramic electrode and also Pt/RGO/CCE. It was found that the Pt–CeO2/RGO/CCE was electrocatalytically more active than them and had satisfactory stability and reproducibility when stored in ambient conditions or under continuous cycling. Consequently, the combination of the Pt–CeO2 nanoparticles, RGO and carbon-ceramic substrate may lead to a nanocomposite material with improved electrocatalytic activities for application in DLFCs.
2. Experimental
2.1. Chemicals
Methyl trimethoxy silane (MTMOS), formic acid, formaldehyde, methanol, H2PtCl6·6H2O, HCl, NaOH, H2SO4, Ce(NO3)3·6H2O, graphite powder, Na2HPO4 and NaH2PO4 were purchased from Merck or Fluka and graphene oxide was synthesized from natural flake graphite by the Hummers method.59 All solutions were prepared with double distilled water. Also all the experiments were carried out at room temperature.2.2. Apparatus
The electrochemical experiments were carried out using an AUTOLABPGSTAT-30 (potentiostat/galvanostat) equipped with a USB electrochemical interface and a driven GEPS software was used for electrochemical experiments. A conventional three electrode cell was used at room temperature. Pt/CCE, Pt–CeO2/CCE, Pt/RGO/CCE and Pt–CeO2/RGO/CCE (3 mm diameter) were used as working electrodes. A saturated calomel electrode (SCE) and a platinum wire were used as the reference and auxiliary electrodes, respectively. The JULABO thermostat was used to control the cell temperature at 25 °C. Scanning electron microscopy (SEM) and energy dispersive X-ray spectroscopy (EDX) were performed on a LEO 440i Oxford instrument. X-ray diffraction (XRD) of the nanocomposite was studied using a Brucker AXF (D8 Advance) X-ray power diffractometer with a Cu Kα radiation source (λ = 0.154056 nm) generated at 40 kV and 35 mA.2.3. Preparation of the electrocatalysts
Step I: The sol–gel processing method was used for the fabrication of the CCE substrate according to the following procedure:57,58 the amount of 0.9 ml MTMOS was mixed with 0.6 ml methanol. After addition of 0.6 ml HCl 0.1 M as the catalyst, the mixture was magnetically stirred (for about 15 min) until it produced a clear and homogeneous solution. Then, 0.3 g graphite powder was added and the mixture was stirred for another 5 minutes. Subsequently, the homogenized mixture was firmly packed into a Teflon tube (with 3 mm inner diameter and 10 mm length) and dried for at least 24 h at room temperature. A copper wire was inserted through the other end to set up an electric contact. The electrode surface was polished with emery paper grade 1500 and rinsed with double distilled water.
Step II: 1 g cerium(III) nitrate hexahydrate as a starting material was dissolved in 10 ml double distilled water.60,61 A solution of 0.15 M NaOH as the precipitating agent was added into the reaction mixture. The reaction solution was magnetically stirred to obtain CeO2 nanoparticles by homogeneous precipitation. Then, the solid product was filtered and washed with double distilled water and ethanol. Finally, the obtained precipitate was dried for at least 24 h at room temperature. The Pt–CeO2 co-electrodeposition process was carried out in a 0.1 M H2SO4 continuously stirred solution containing an excess of CeO2 particles as a suspension and 1 × 10⁻³ M of H2PtCl6·6H2O. The Pt–CeO2 nanoparticles were electrodeposited on the CCE at a constant potential of −0.3 V vs. SCE. In this process, which is known as the “occlusion electrodeposition” method for the deposition of metal together with an oxide on the surface of a substrate,61,62 the Pt nanoparticles (PtCl62− + 4e− → Pt + 6Cl−) assimilate the CeO2 particles during film growth to obtain the final modified electrode, Pt–CeO2/CCE. The electrodeposited mass of Pt in Pt–CeO2/CCE can be calculated by integration of the electrical charge consumed during the electrodeposition process: QPt = 0.0277C and, assuming 100% current efficiency, the quantity of electrodeposited Pt (WPt) was obtained (WPt = QdepM/zF) to be 0.02 mg cm−2. It should be noted that, by passing the same electrical charge through in the preparation process of other electrocatalysts; Pt/RGO/CCE, Pt/CCE and Pt–CeO2/RGO/CCE, the amount of Pt in all electrocatalysts will be the same: 0.02 mg cm−2.
3. Results and discussion
3.1. Physical characteristics of the Pt–CeO2/RGO/CCE electrocatalyst
In order to perform surface characterization of the Pt–CeO2/RGO/CCE electrocatalyst and comparison studies, the surface morphology of the bare CCE, RGO/CCE, CeO2/RGO/CCE, Pt/RGO/CCE, Pt–CeO2/CCE and Pt–CeO2/RGO/CCE was investigated by SEM and the corresponding results are shown in Fig. 2. Fig. 2A shows the structure of the bare CCE surface immediately after polishing with emery paper, grade 1500. As seen in this image, the surface of the bare CCE is dense and scaly. Fig. 2B shows the SEM image of the RGO/CCE surface. As can be seen, the surface of CCE is completely protected with RGO layers and the layer structure of the RGO is favorable and ready for immobilization of compounds or dispersion and electrodeposition of metal nanoparticles. After co-deposition of the Pt–CeO2 nanoparticles on the RGO/CCE surface (Fig. 2C), flower-like Pt–CeO2 nanoparticles appeared on the RGO/CCE. It seems that the flower-like structures of Pt–CeO2 nanoparticles are not the individual Pt–CeO2 crystallites. They are probably flower-like collections of crystallite aggregates. Fig. 2, images (D), and (E) shows the surface of the Pt–CeO2/CCE and Pt/RGO/CCE, respectively. As can be seen, the surface morphology of these modified electrodes is completely different in comparison with the Pt–CeO2/RGO/CCE surface. The Pt–CeO2 nanoparticles in the Pt–CeO2/RGO/CCE are smaller and have more distinct shapes than those in the Pt–CeO2/CCE and Pt/RGO/CCE, which may suggest that the former has more active sites and should have better electrocatalytic activity. On the other hand, as reported in the literature,42 among the various shapes, nanostructures with branched morphology such as flower shapes (such as image (C)) and dendritic structures are of particular interest. These materials not only show maximum electrocatalytic performance by their high specific surface area but also utilize fully their intrinsic capability because of the presence of highly reactive edges, corners and stepped atoms on their branches. Finally, Fig. 2F shows the surface morphology of the CeO2/RGO/CCE. As can be seen, the surface of the CeO2/RGO/CCE is very similar to the surface of RGO/CCE, just like its previous surface. Indeed it seems that any additional particles are not electrodeposited on its surface.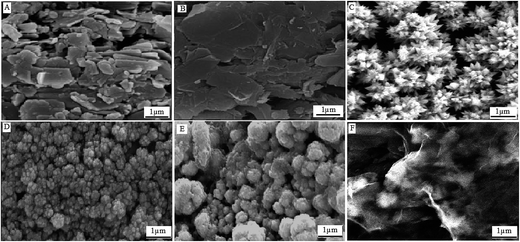 | ||
| Fig. 2 SEM images of CCE (A), RGO/CCE (B), Pt–CeO2/RGO/CCE (C), Pt–CeO2/CCE (D), Pt/RGO/CCE (E) and CeO2/RGO/CCE (F). | ||
Furthermore, the EDX analysis of the Pt–CeO2/RGO/CCE in Fig. 3 and Pt/RGO/CCE, CeO2/RGO/CCE and RGO/CCE (inset (a), (b) and (c), respectively) detected Pt, Ce, O, Si (from MTMOS) and C atoms. Combining the facts of the crystal plane formation (XRD results) and a large amount of Pt and Ce detected in Fig. 3, it can be inferred that the nanoparticles mainly consist of Pt and CeO2. The spectrum in inset a corresponds to the Pt/RGO/CCE, showing only Pt along with other common atoms. The EDX spectra of the CeO2/RGO/CCE (inset (b)) and similarly the RGO/CCE (inset (c)) contain only strong peaks for C, Si and O elements, suggesting that the CeO2 particles are not present on them. These results are in agreement with the obtained SEM images and indicate that in the absence of the PtCl62− ions at the occlusion electrodeposition process, the CeO2 particles could not deposit on the surface of the RGO/CCE.
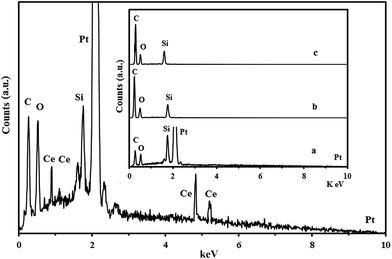 | ||
| Fig. 3 EDX spectrum of the Pt–CeO2/RGO/CCE and Pt/RGO/CCE (inset (a)), CeO2/RGO/CCE (inset (b)) and RGO/CCE (inset (c)). | ||
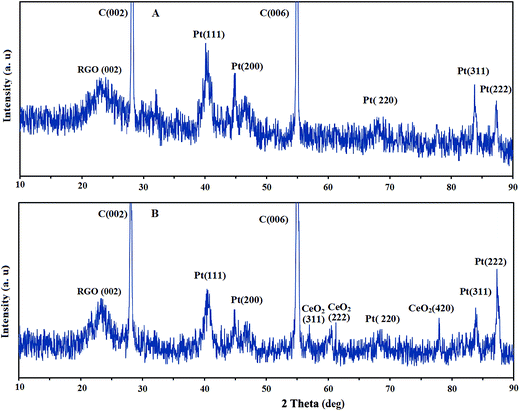
The crystallographic structure and chemical phase composition of the electrocatalysts were determined by XRD patterns. Fig. 4 shows the XRD patterns of the Pt/RGO/CCE (A) and Pt–CeO2/RGO/CCE (B). The peaks at 2θ values of 26.96° and 55° in both XRD patterns correspond to the supporting carbonic material (graphite powder) (002) and (006), respectively. Also, a broad peak at a 2θ value of about 23.32° in both XRD patterns corresponds to a (002) graphitic peak of RGO.63,66 The appearance of the broad diffraction peak at 2θ values of 23.32° in the XRD patterns of both electrocatalysts gives evidence that the graphite oxide was reduced to RGO at the surface of CCE.66 The XRD pattern of the Pt/RGO/CCE exhibits the characteristic diffraction peaks of Pt (111), (200), (220), (311) and (222) at 2θ values of 40.08°, 46.8°, 67.88°, 83.76° and 87.24°, respectively.67 For Pt–CeO2/RGO/CCE the main characteristic peaks at 40.4° (111), 46.6° (200), 68.27° (220), 83.84° (311) 87.28° (222) for Pt and at 57.04° (331), 60.24° (222), 77.92° (420) for CeO2 are observed.13,68 As can be seen, no shift at the position of Pt diffraction peaks was observed, which indicates that adding of the CeO2 has no effect on the crystallographic structure of the Pt nanoparticles. Using the Scherrer equation,69 Dc = 0.9λ/β![[thin space (1/6-em)]](https://www.rsc.org/images/entities/char_2009.gif) cos
cos![[thin space (1/6-em)]](https://www.rsc.org/images/entities/char_2009.gif) θ (where λ = 0.154056 nm, β is the full width at half-maximum in radians and θ is the peak position in degrees), the average crystallite size (Dc) of Pt and CeO2 nanoparticles is estimated to be 25 nm and 95 nm, respectively.60,70
θ (where λ = 0.154056 nm, β is the full width at half-maximum in radians and θ is the peak position in degrees), the average crystallite size (Dc) of Pt and CeO2 nanoparticles is estimated to be 25 nm and 95 nm, respectively.60,70
3.2. Electrochemical characteristics of the Pt–CeO2/RGO/CCE electrocatalyst
The electrochemical behavior of the Pt–CeO2/RGO/CCE and also Pt–CeO2/CCE for comparison was investigated using cyclic voltammetry at a scan rate of 50 mV s−1 in 0.1 M H2SO4 aqueous solution within the potential range of −0.3 and 1.3 V. Fig. 5 shows the CVs of the Pt–CeO2/RGO/CCE (black line) and Pt–CeO2/CCE (dashed line). The Pt-peaks for the hydrogen under potential deposition (Hupd), the oxidation of hydrogen (Hoh), formation of Pt oxides (a1) and their reduction (a2) are present in the CVs of the Pt–CeO2/RGO/CCE and Pt–CeO2/CCE electrocatalysts but they become ill-shaped compared with Pt/CCE.57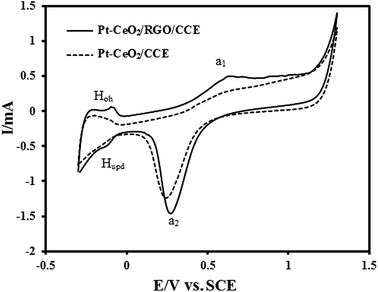 | ||
| Fig. 5 CVs of Pt–CeO2/RGO/CCE (black line) and Pt–CeO2/CCE (dashed line) in 0.1 M H2SO4 at a scan rate of 50 mV s−1. | ||
The actual active surface area (Ar) of the Pt-based electrocatalyst is equivalent to the number of Pt sites available for hydrogen adsorption/desorption.71 The Ar of co-electrodeposited Pt–CeO2 nanoparticles was estimated from the hydrogen adsorption peaks [hydrogen under potential deposition (Hupd)] on CV according to Ar = QH/Q0, where QH is the electric charge related to hydrogen adsorption on the Pt–CeO2/RGO/CCE and Q0 is the theoretical charge required to reduce a monolayer of hydrogen on the Pt atoms. Integration of charge in the potential range −300 to −30 mV in Fig. 5, black line, allows us to estimates the QH (μC), due to the hydrogen adsorption. For evaluation of Ar, an assumption must be made about the atoms on the electrocatalyst surface that are accessible to hydrogen adsorption; assuming one Had per Pt surface atom, the theoretical charge associated with a monolayer of hydrogen formed on the basis of H+ + e− → Had, Q0, was estimated to be 210 μC per real cm2 as follows: Q0 (μC) per real cm2 = F × n/N, where n is the number of platinum atoms (1.3 × 1015 cm2) and N is Avogadro’s constant.55,56 From the obtained QH and the theoretical charge, Q0, the Ar of the Pt–CeO2/RGO/CCE was calculated to be 1.41 cm2. The specific surface area, S (in m2 g−1), of the Pt–CeO2/RGO/CCE electrocatalyst was also estimated as follows:30 S = 100Ar/(WAg) = 10.07 [Ag: geometric surface area = 0.07 cm2, W (in μg cm−2): amount of loaded platinum]. On the other hand, assuming spherical particles with similar radius, the average particle size of the Pt nanoparticles in the Pt–CeO2/RGO/CCE electrocatalyst, d, can be calculated from the following equation using the Gloaguen and et al. method:72 d = 6000/(ρS), where d is the average particle size of the Pt nanoparticles in nm, ρ is the density of Pt (ρ = 21.4 g cm−3) and S is the specific surface area (10.07 m2 g−1) of the Pt nanoparticles. The average particle size of Pt nanoparticles in the Pt–CeO2/RGO/CCE was calculated to be d = 27.84 nm, which is in good agreement with the average particle size obtained for the XRD result using the Scherrer equation.
3.3. Electrocatalytic activity of the Pt–CeO2/RGO/CCE toward the oxidation of formic acid and formaldehyde
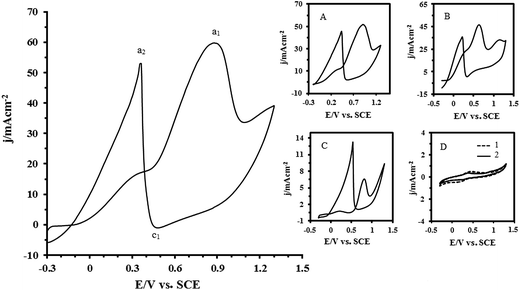
The electrocatalytic activity of the Pt–CeO2/RGO/CCE toward the oxidation of formic acid and formaldehyde was evaluated by cyclic voltammetry. Fig. 6 shows the CV of the Pt–CeO2/RGO/CCE in a 0.1 M H2SO4 solution + 0.1 M formic acid. For comparison, the CVs of the Pt–CeO2/CCE (inset (A)), Pt/RGO/CCE (inset (B)), Pt/CCE (inset (C)),55 CeO2/RGO/CCE and RGO/CCE (inset (D), curve 1 and 2, respectively) in the same conditions are shown in Fig. 6. It can be seen from the CV of formic acid on Pt–CeO2/RGO/CCE that the reaction commences in the hydrogen adsorption/desorption region, proceeds slowly in the positive direction and then reaches a plateau. At potentials more than ca. 0.5 V, the reaction becomes accelerated and maximum rate occurs at ca. 0.86 V. An increase in the current at potentials more than ca. 1.1 V is assigned to oxygen evolution. Upon reversing the potential sweep, a very steep increase occurs in the current at ca. 0.48 V and a maximum current is observed at ca. 0.36 V. After that, the current gradually decreases but the reaction rate is still faster than in the forward scan. This anodic peak in the reverse scan is attributed to the removal of the incompletely oxidized carbonaceous species formed in the forward scan.73 As evidenced in Fig. 6 and its insets, the Pt–CeO2/RGO/CCE electrocatalyst exhibits a much higher anodic peak current density for formic acid oxidation than the Pt–CeO2/CCE (inset (A)), Pt/RGO/CCE (inset (B)) and Pt/CCE (inset (C)) in the forward scan. The anodic peak current density at the Pt–CeO2/RGO/CCE is about 60.1 mA cm−2, while it is 51.8 mA cm−2 at the Pt–CeO2/CCE, 46.2 mA cm−2 at the Pt/RGO/CCE and 6.6 mA cm−2 at the Pt/CCE electrocatalysts. This indicates that the incorporation of Pt nanoparticles along with CeO2, Pt–CeO2, supported on the RGO greatly enhanced the utilization of Pt nanoparticles in the electrooxidation of formic acid. Moreover, the ratio of the anodic peak current density in the forward scan (Jf) to the anodic peak current density in the backward scan (Jb) can be used to evaluate the electrocatalyst tolerance to the intermediate carbonaceous species that formed in the electrooxidation reaction and accumulated on the electrocatalyst surface.55 The higher Jf/Jb value indicates higher tolerance to intermediate carbonaceous species, which means formic acid can be oxidized to the final product much more efficiently. The ratio of Jf/Jb for formic acid electrooxidation on the Pt–CeO2/RGO/CCE is calculated to be 1.14, while for the Pt–CeO2/CCE, Pt/RGO/CCE and Pt/CCE electrocatalysts are 1.13, 1.31 and 0.49, respectively, which suggests that Pt–CeO2/RGO/CCE has less carbonaceous accumulation and hence is more tolerant toward CO poisoning especially in comparison with Pt/CCE (Jf/Jb = 0.49). The results of the electrochemical parameters of formic acid oxidation at the present electrocatalysts were summarized in Table 1. As can be seen in Table 1, the onset potential for the oxidation of formic acid at the Pt–CeO2/RGO/CCE electrocatalyst is about −0.20 V, which shifts negatively by about 100–200 mV compared to that at the Pt–CeO2/CCE, Pt/RGO/CCE and Pt/CCE electrocatalysts. The fact that the electrooxidation of formic acid taking place at lower potential with higher Jf/Jb value and lower onset potential discloses that the Pt–CeO2/RGO/CCE electrocatalyst exhibits a higher electrocatalytic activity for the electrooxidation of formic acid than that of the others. The significant enhancement in the electrocatalytic activity of the Pt–CeO2/RGO/CCE as compared with Pt–CeO2/CCE, Pt/RGO/CCE and Pt/CCE electrocatalysts can be attributed to two factors:| Fuel | Electrocatalyst | Eonset (V) | Epf (V) | Jpf (mA cm−2) | Epb (V) | Jpb (mA cm−2) | Jpf/Jpb |
|---|---|---|---|---|---|---|---|
| Formic acid | Pt–CeO2/RGO/CCE | −0.20 | 0.87 | 60 | 0.36 | 52.96 | 1.14 |
| Pt–CeO2/CCE | −0.03 | 0.91 | 51.8 | 0.43 | 45.71 | 1.13 | |
| Pt/RGO/CCE | −0.11 | 0.61 | 46.2 | 0.21 | 35.28 | 1.31 | |
| Pt/CCE | 0.0 | 0.81 | 6.60 | 0.53 | 13.3 | 0.49 | |
| Formaldehyde | Pt–CeO2/RGO/CCE | 0.07 | 0.92 | 85.58 | 0.39 | 49.26 | 1.73 |
| Pt–CeO2/CCE | 0.13 | 0.88 | 75.90 | 0.45 | 75.16 | 1.01 | |
| Pt/RGO/CCE | −0.21 | 0.64 | 61.6 | 0.25 | 59.65 | 1.03 | |
| Pt/CCE | 0.09 | 0.81 | 8.98 | 0.36 | 7.92 | 1.13 |
First: the role of the RGO in the improvement of the catalytic performances of the Pt–CeO2/RGO/CCE electrocatalyst. The role of RGO can also be explained by two facts: (I) the role of the RGO as a support in good, uniform and smaller distributions of the Pt–CeO2 nanoparticles and (II) possible bifunctional effect between the remaining oxygenated groups on the ORG and Pt–CeO2 nanoparticles, similar to the commonly accepted bifunctional effect between Pt and Ru.26,74 As can be found in the literature,74,75 oxygen-containing groups on the RGO can improve the electrocatalytic activity of Pt nanoparticles slightly by playing the role of ruthenium in the case of the Pt–Ru electrocatalyst75 to remove the intermediate carbonaceous species and contribute to the low level of poisoning. On the other hand, the remaining functional groups such as carboxylic and hydroxide groups on the RGO (incomplete reduction) may be responsible for the improved tolerance to CO observed in the Pt–CeO2/RGO/CCE electrocatalyst.26
Second: the synergistic effects between the Pt nanoparticles and CeO2.7,68,70 The improvement of the electrooxidation performances as assisted by CeO2 can be described by two possibilities:13 (I) chemical enhancement of the electrooxidation of the adsorbed CO as supported by CeO2 as an oxygen donor, or by the effect of CeO2 altering the electrocatalyst’s surface morphology (as can be seen in the SEM images), physically preventing the CO adsorption. The probable mechanism for this proposal can be described by the following reactions:13,76
| Pt–COads + 4CeO2 + 2H+ + 2e− ↔ 2Ce2O3 + Pt + CO2 + H2O | (1) |
| 4CeO2 + 4H+ + 4e− ↔ 2Ce2O3 + 2H2O, | (2) |
| CeO2 + H2O ↔ CeO2–OHads + H+ + e− | (3) |
| Pt–COads + CeO2–OHads ↔ Pt + CeO2 + CO2 + H+ + e− | (4) |
On the other hand, the combination of Pt and CeO2 could assist the oxidation of the adsorbed intermediate, COads, according to the bifunctional mechanism, where the OHad species could form on the surface of the CeO2 and could transform COads on the surface of Pt nanoparticles to CO2, which releases the active sites of the Pt nanoparticles for contribution to the main electrooxidation reactions. All these results demonstrate that the Pt–CeO2/RGO/CCE in the electrooxidation of formic acid is more active than the Pt–CeO2/CCE, Pt/RGO/CCE, Pt/CCE.57,70,79–81
Moreover, comparison of the obtained results in the electrooxidation of formic acid on the Pt–CeO2/CCE and Pt/RGO/CCE show that the effects of CeO2 in the improvement of the electrocatalytic activity of Pt nanoparticles is much higher than the RGO effects. As reported in the literature,68 CeO2 has been generally used as a kind of oxygen reservoir to regulate the oxygen species on the electrocatalyst surface.82 CeO2 has a fluorite structure whose cations can switch between oxidation states (Ce3+/Ce4+) (eqn (2) and (3)), and consequently has the ability to act as an oxygen species buffer.68 Therefore, the introduction of CeO2 into the electrocatalyst improves the dispersion of the Pt nanoparticles and consequently increases the proportion of Pt exposed to oxygen. On the other hand, CeO2 provides a good situation for oxygen transport through valence variation, so that the CeO2 synergism with Pt effectively promotes the oxygen reduction reaction.68,83,84 These results indicate that the oxygenated Pt species have a weaker adsorption energy on the surface of the Pt–CeO2/CCE electrocatalyst than on the surface of the Pt/RGO/CCE electrocatalyst, which means that the desorption of oxygenated Pt species is easier on the Pt–CeO2/CCE than on the Pt/RGO/CCE.5
Inset (D) in Fig. 6 shows the CVs of the CeO2/RGO/CCE and RGO/CCE in a 0.1 M H2SO4 solution + 0.1 M formic acid. It can be seen that there is no anodic peak corresponding to the formic acid oxidation on the CeO2/RGO/CCE (curve 1) and RGO/CCE (curve 2),68 indicating that the RGO and CeO2/RGO have no electrocatalytic activity toward formic acid oxidation.
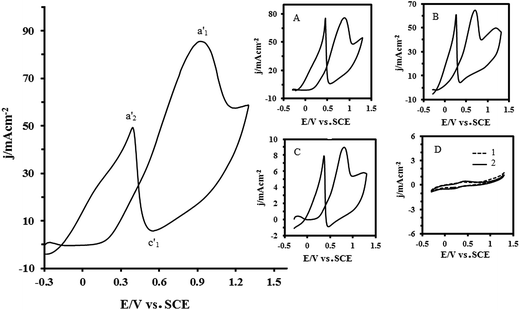
Fig. 7 shows the CV of the Pt–CeO2/RGO/CCE electrocatalyst in a solution of 0.1 M H2SO4 + 0.1 M formaldehyde. For comparison, the CVs of the Pt–CeO2/CCE (inset (A)), Pt/RGO/CCE (inset (B)), Pt/CCE (inset (C))57 and CeO2/RGO/CCE and RGO/CCE (inset (D), curve 1 and 2, respectively) are also shown. As can be seen in Fig. 7, the electrochemical behavior of formaldehyde is similar to formic acid electrooxidation at the same electrocatalysts: one main oxidation peak in the forward scan at all electrocatalysts, which is located at potentials between 0.7 V and 0.9 V with peak current density, corresponds to the type and performance of the studied electrocatalysts and one main oxidation peak in the backward scan. CV responses reveal that the Pt–CeO2/RGO/CCE has higher electrocatalytic activity in the electrooxidation of formaldehyde than the other electrocatalysts. The electrochemical parameters of formaldehyde electrooxidation at the present electrocatalysts are summarized in Table 1. As can be seen in Table 1, the Pt–CeO2/RGO/CCE exhibits a higher electrocatalytic activity in the electrooxidation of formaldehyde than that of the others.
Inset (D) in Fig. 7 shows that the CeO2/RGO/CCE (curve 1) and RGO/CCE (curve 2) have no electrocatalytic activity toward formaldehyde electrooxidation.68
Finally, to compare the electrocatalytic performance of Pt–CeO2/RGO/CCE toward formic acid and formaldehyde oxidation with other electrocatalysts under the same conditions, the electrochemical parameters in the oxidation of formic acid and formaldehyde (Eonset, Epf, Epb, Ipf, Ipb, Ipf/Ipb and also the stability of the electrocatalysts) obtained in this work and other studies are listed in Table 2. Table 2 shows that the Pt–CeO2/RGO/CCE exhibits better or comparable electrocatalytic performance than other reported electrocatalysts toward formic acid and formaldehyde oxidation. These results confirmed that the Pt–CeO2/RGO/CCE exhibits a promising catalytic behavior toward formic acid and formaldehyde oxidation and demonstrate that Pt–CeO2 nanoparticles, by providing a flower-like nanostructure on the RGO/CCE and reducing the loading of expensive noble metals, improve Pt utilization efficiency.
| Electrocatalyst | Fuel | Eonset (SCE) | Epf | Epb | Jpfa | Jpb | Jpf/Jpb | Stab.c | Ref. |
|---|---|---|---|---|---|---|---|---|---|
| a SGeo = based on geometric surface area and SReal based real surface area.b Fuel concentration.c Stability based on reported chronoamperometric curves. | |||||||||
| Pt–Au/graphene electrode | Formic acid | −104 | 710 | 466 | 0.621 (A mg−1) peak (II)b (1 M) | 2.7 (A mg−1) | 0.23 | 3 h | 23 |
| Formaldehyde | — | — | — | — | — | — | — | ||
| Pt–Ni/CCE | Formic acid | −150 | 800 | 380 | 1.82 mA cm−2 SReal (0.5 M) | 1.82 mA cm−2 | 1 | 1.1 h | 55 |
| Formaldehyde | — | — | — | — | — | — | — | ||
| Pt–Sn/CCE | Formic acid | −0.3 | 690 | 290 | 1.3 mA (0.5 M) | 1.23 mA (0.5 M) | 1.05 | — | 57 |
| Formaldehyde | — | — | — | — | — | — | — | ||
| Pt/CCE | Formic acid | −100 | 810 | 540 | 49.43 mA cm−2 SGeo (0.75 M) | 103.6 mA cm−2 | 0.47 | 0.14 h | 79 |
| Formaldehyde | 140 | 820 | 370 | 65.57 mA cm−2 SGeo (0.75 M) | 57.14 mA cm−2 | 1.14 | 0.14 h | ||
| Pd–Si alloy | Formic acid | — | 671 | 281 | 0.35 mA cm−2 (0.5 M) | 0.8 mA cm−2 | 0.44 | 85 | |
| Formaldehyde | — | 756 | 556 | 1.65 mA cm−2 (0.5 M) | 2.75 mA cm−2 | 0.6 | — | ||
| Nano PtSn/Ti | Formic acid | 725 | 500 | 13.75 mA cm−2 SGeo (0.5 M) | 31.25 mA cm−2 | 0.44 | 0.23 h | 86 | |
| Formaldehyde | — | — | — | — | — | — | — | ||
| PtAu/MWCNTs | Formic acid | −50 | 705 | 555 | 2.5 mA cm−2 SReal (0.5 M) | 7.2 mA cm−2 | 0.35 | 0.7 h | 87 |
| Formaldehyde | — | — | — | — | — | — | — | ||
| PtNPs/nichrome | Formic acid | 100 | 730 | 545 | 6.5 mA | 5.5 mA | 1.18 | — | 88 |
| Formaldehyde | — | — | — | — | — | — | — | ||
| Pt50Pd50/Ti | Formic acid | −100 | 700 | 400 | 28 mA cm−2 (0.5 M) | 110 mA cm−2 | 0.26 | 0.22 | 89 |
| Formaldehyde | — | — | — | — | — | — | — | ||
AuPt (7![[thin space (1/6-em)]](https://www.rsc.org/images/entities/char_2009.gif) : :![[thin space (1/6-em)]](https://www.rsc.org/images/entities/char_2009.gif) 3)/carbon paper 3)/carbon paper |
Formic acid | −45 | 558 | 735 | 87.5 mA cm−2 (0.5 M) | 125 mA cm−2 | 0.7 | 3.16 h | 90 |
| Formaldehyde | — | — | — | — | — | — | — | ||
| nPd on the MWCNT electrode | Formic acid | −244 | 406 | 436 | 1.935 mA (0.1 M) | 2.750 | 0.7 | — | 91 |
| Formaldehyde | — | — | — | — | — | — | — | ||
| PtAu/C (core–shell) | Formic acid | 700 | 330 | 0.91 mA (0.5 M) | 2.65 mA | 0.34 | — | 92 | |
| Formaldehyde | — | — | — | — | — | — | — | ||
| Nano Pt59Ir41/Ti | Formic acid | 0 | 750 | 500 | 100 mA cm−2 (0.5 M) | 253 mA cm−2 | 0.4 | 0.2 h | 93 |
| Formaldehyde | — | — | — | — | — | — | — | ||
| PtAg/C | Formic acid | 0 | 680 | 430 | 33 mA cm−2 SGeo (0.5 M) | 69 mA cm−2 | 0.48 | 94 | |
| Formaldehyde | — | — | — | — | — | — | — | ||
| Pt–Pd nanoparticles/PPy–CNT–GEs | Formic acid | 0 | 650 | 370 | 30 mA cm−2 SGeo (0.5 M) | 41.25 mA cm−2 | 0.72 | 0.34 h | 95 |
| Formaldehyde | 140 | 590 | 380 | 38.5 mA cm−2 SGeo (0.5 M) | 45.5 mA cm−2 | 0.85 | 0.34 h | ||
| Au–Pt NCs | Formic acid | −100 | 660 | 400 | 666.67 (mA mg−1 Pt) (0.5 M) | 1772 (mA mg−1 Pt) | 0.38 | 0.25 h | 96 |
| Formaldehyde | — | — | — | — | — | — | — | ||
Pd–Au (3![[thin space (1/6-em)]](https://www.rsc.org/images/entities/char_2009.gif) : :![[thin space (1/6-em)]](https://www.rsc.org/images/entities/char_2009.gif) 1)/PDDA–xGNP 1)/PDDA–xGNP |
Formic acid | — | 445 | 252 | 480 (mA mg−1 Pd) (0.5 M) | 580 (mA mg−1 Pd) | 0.83 | 1 h | 97 |
| Formaldehyde | — | — | — | — | — | — | — | ||
| Pt–Pd/SWCNT | Formic acid | 10 | 680 | 300 | 28.26 mA cm−2 (0.5 M) | 29.93 mA cm−2 | 0.94 | 0.17 h | 98 |
| Formaldehyde | 200 | 600 | 380 | 33.56 mA cm−2 (0.5 M) | 18.05 mA cm−2 | 1.86 | 0.17 h | ||
| Pt–CeO2/RGO/CCE | Formic acid | −200 | 870 | 360 | 60 mA cm−2 SGeo (0.1 M) | 52.96 mA cm−2 | 1.14 | 0.22 h | This work |
| Formaldehyde | 70 | 920 | 390 | 85.58 mA cm−2 SGeo (0.1 M) | 49.26 mA cm−2 | 1.73 | 0.22 h | ||
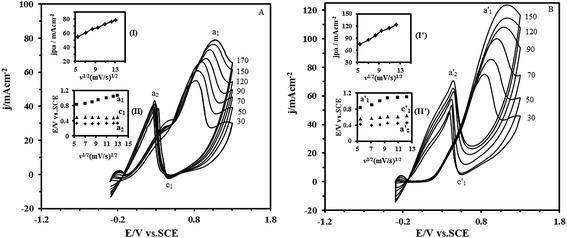
A further investigation was carried out to discover the transport characteristics of formic acid and formaldehyde on the Pt–CeO2/RGO/CCE electrocatalyst. The influence of the scan rate (v) on the electrooxidation of formic acid and formaldehyde at the Pt–CeO2/RGO/CCE was investigated and shown in Fig. 8A and B, respectively. The results show that the currents associated with formic acid and formaldehyde electrooxidation increase with scan rate. The anodic peak current densities in the forward scan are linearly proportional to v1/2, as shown in the inset of (I) in Fig. 8A and (I′) in Fig. 8B, suggesting that the electrocatalytic oxidation reactions of formic acid and formaldehyde on the Pt–CeO2/RGO/CCE are diffusion-controlled processes. Also, as can be seen in insets (II) and (II′) of Fig. 8A and B, respectively, the potentials of anodic peaks in the forward scan (curve a1 and a′1) shift to high potentials with increasing of the scan rate,99 whereas the potentials of cathodic peaks (c1 and c′1 for formic acid and formaldehyde, respectively) and anodic peak (a2 and a′2 for formic acid and formaldehyde, respectively) in the backward scan shift to higher positive potentials with increasing of the scan rate. These results indicate that the electrooxidation of formic acid and formaldehyde and also the process in the cathodic reaction at the Pt–CeO2/RGO/CCE are irreversible electrode processes.
In order to evaluate the capacity of the Pt–CeO2/RGO/CCE in the electrooxidation of formic acid and formaldehyde, the effect of fuel concentration on the corresponding anodic peak currents was investigated by CV. According to experimental data, the anodic peak current density of formic acid and formaldehyde increased by their concentrations, and reached nearly constant values for concentrations higher than 1.5 M and 1.2 M for formic acid and formaldehyde, respectively. We assume this effect was caused by the saturation of active sites at the surface of the Pt–CeO2/RGO/CCE electrocatalyst.100
3.4. Long-term stability of the Pt–CeO2/RGO/CCE electrocatalyst
Practically, long-term stability of the anodic material in the fuel cells is important. The long-term activity and durability of the Pt–CeO2/RGO/CCE and Pt–CeO2/CCE electrocatalysts was assessed by chronoamperometry tests. Fig. 9 shows the typical chronoamperometric response curves of 0.1 M formic acid (A) and 0.1 M formaldehyde (B) in 0.1 M H2SO4 on the Pt–CeO2/RGO/CCE and Pt–CeO2/CCE electrocatalysts under a constant potential of 0.85 V for formic acid and 0.9 V for formaldehyde for 800 s. It was found that the currents observed from chronoamperograms were in good agreement with the currents observed from CVs and show that the both electrocatalysts have significant stability toward formic acid and formaldehyde electrooxidation. The long-term stability of the Pt–CeO2/RGO/CCE and Pt–CeO2/CCE electrocatalysts was further examined in 0.1 M H2SO4 solution containing 0.1 M formic acid (Fig. 10A) and 0.1 M formaldehyde (Fig. 10B) by CV in consecutive scans. It can be observed from Fig. 10A that the anodic peak current density remains constant with an increase in the scan number at the initial stage. By increasing the number of scans the anodic peak current densities gradually decrease. In general, the loss of the catalytic activity after a successive number of scans may result from the consumption of formic acid during the CV scan. It may also be due to poisoning and the structure change of the Pt–CeO2 nanoparticles as a result of the perturbation of the potentials during the scanning in aqueous solutions. After the long-term cyclic voltammetry experiments, the Pt–CeO2/RGO/CCE was stored in water for a week and then the formic acid oxidation was carried out again by the CV. This process revealed that the excellent electrocatalytic activity of the formic acid oxidation was still observable. Similar behavior was obtained for formaldehyde oxidation in continuous cycling (Fig. 10B) and stability studies.57,79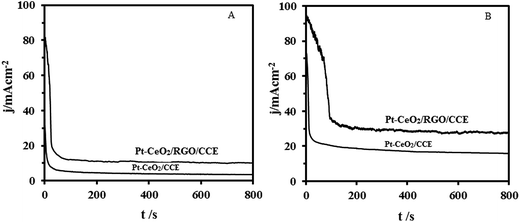 | ||
| Fig. 9 Chronoamperometric curves of 0.1 M formic acid (A) and 0.1 M formaldehyde (B) electrooxidation in 0.1 M H2SO4 at the Pt–CeO2/CCE and Pt–CeO2/RGO/CCE, respectively. | ||
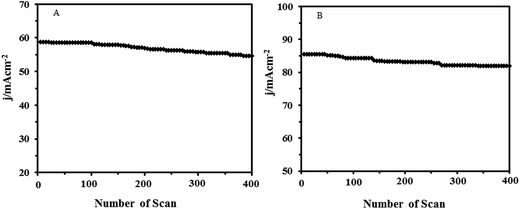 | ||
| Fig. 10 Long-term stability of Pt–CeO2/RGO/CCE in 0.1 M H2SO4 and 0.1 M formic acid (A) and 0.1 M formaldehyde (B) vs. number of scans (scan rate 50 mV s−1). | ||
4. Conclusions
Pt–CeO2/RGO/CCE electrocatalyst was successfully fabricated by a simple two-step electrochemical deposition process as follows: step I, electrodeposition of the RGO on the CCE through a simple electrochemical process using graphene oxide and CCE as the precursor and electrode substrate, respectively and step II, co-electrodeposition of the Pt–CeO2 nanoparticles on the RGO/CCE by using another electrochemical process. The obtained Pt–CeO2/RGO/CCE electrocatalyst was characterized by SEM, EDX, XRD and electrochemical methods. Then, the electrocatalytic performances of the Pt–CeO2/RGO/CCE toward the oxidation of formic acid and formaldehyde were investigated by cyclic voltammetric and chronoamperometric methods. Compared with Pt/RGO/CCE, Pt–CeO2/CCE and Pt/CCE, the Pt–CeO2/RGO/CCE electrocatalyst exhibited higher catalytic activity for formic acid and formaldehyde oxidation. The significant enhancement in the catalytic activity of the Pt–CeO2/RGO/CCE electrocatalyst as compared with Pt–CeO2/CCE, Pt/RGO/CCE and Pt/CCE electrocatalysts may be attributed to the role of the RGO in the increased performance of Pt–CeO2 nanoparticles and the synergistic effects between the Pt nanoparticles and CeO2 nanoparticles in the enhanced catalytic performances of the Pt–CeO2/RGO/CCE electrocatalyst.Acknowledgements
The authors are grateful to the research office of Azarbaijan Shahid Madani University for its financial support (Grant No. 214/d/12619).References
- S. Basri, S. K. Kamarudin, W. R. W. Daud and Z. Yaakub, Int. J. Hydrogen Energy, 2010, 35, 7957 CrossRef CAS PubMed.
- Y. Qiao and C. M. Li, J. Mater. Chem., 2011, 21, 4027 RSC.
- H. Liu, C. Song, L. Zhang, J. Zhang, H. Wang and D. P. Wilkinson, J. Power Sources, 2006, 155, 95 CrossRef CAS PubMed.
- S. Guo and E. Wang, Nano Today, 2011, 6, 240 CrossRef CAS PubMed.
- M. A. Scibioh, S. K. Kim, E. A. Cho, T. H. Lim, S. A. Hong and H. Y. Ha, Appl. Catal., B, 2008, 84, 773 CrossRef CAS PubMed.
- Y. Y. Chu, Z. B. Wang, Z. Z. Jiang, D. M. Gu and G. P. Yi, Adv. Mater., 2011, 23, 3100 CrossRef CAS PubMed.
- L. Yu and J. Xi, Int. J. Hydrogen Energy, 2012, 37, 15938 CrossRef CAS PubMed.
- M. Yaldagard, M. Jahanshahi and N. Seghatoleslami, World J. Nano Sci. Eng., 2013, 3, 121 CrossRef CAS.
- W. Zhou, Z. Zhou, S. Song, W. Li, G. Sun, P. Tsiakaras and Q. Xin, Appl. Catal., B, 2003, 46, 273 CrossRef CAS.
- C. Lamy, E. M. Belgsir and J.-M. Léger, J. Appl. Electrochem., 2001, 31, 799 CrossRef CAS.
- J. W. Guo, T. S. Zhao, J. Prabhuram, R. Chen and C. W. Wong, J. Power Sources, 2006, 156, 345 CrossRef CAS PubMed.
- A. Altamirano-Gutiérrez, A. M. Fernández and F. J. Rodríguez Varela, Int. J. Hydrogen Energy, 2013, 38, 12657 CrossRef PubMed.
- D. J. Guo and Z. H. Jing, J. Power Sources, 2010, 195, 3802 CrossRef CAS PubMed.
- N. Chakroune, G. Viau, S. Ammar, L. Poul, D. Veautier, M. M. Chehimi, C. Mangeney, F. Villain and F. Fiévet, Langmuir, 2005, 21, 6788 CrossRef CAS PubMed.
- X. Yu and P. G. Pickup, J. Power Sources, 2008, 182, 124 CrossRef CAS PubMed.
- Q. Zhao, Z. Gan and Q. Zhuang, Electroanalysis, 2002, 14, 1609 CrossRef CAS PubMed.
- M. Baibarac and P. Gómez-Romero, J. Nanosci. Nanotechnol., 2006, 6, 289 CAS.
- L. L. Zhang and X. S. Zhao, Chem. Soc. Rev., 2009, 38, 2520 RSC.
- S. Bose, T. Kuila, A. K. Mishra, R. Rajasekar, N. H. Kim and J. H. Lee, J. Mater. Chem., 2012, 22, 767 RSC.
- J. Prabhuram, T. S. Zhao, Z. K. Tang, R. Chen and Z. X. Liang, J. Phys. Chem. B, 2006, 110, 5245 CrossRef CAS PubMed.
- J. Guo, G. Sun, Q. Wang, G. Wang, Z. Zhou, S. Tang, L. Jiang, B. Zhou and Q. Xin, Carbon, 2006, 44, 152 CrossRef CAS PubMed.
- Z. Liu, L. M. Gan, L. Hong, W. Chen and J. Y. Lee, J. Power Sources, 2005, 139, 73 CrossRef CAS PubMed.
- C. Venkateswara Rao, C. R. Cabrera and Y. Ishikawa, J. Phys. Chem. C, 2011, 115, 21963 CAS.
- X. Huang, X. Y. Qi, F. Boey and H. Zhang, Chem. Soc. Rev., 2012, 41, 666 RSC.
- C. Xu, X. Wang and J. Zhu, J. Phys. Chem. C, 2008, 112, 19841 CAS.
- Y. Li, W. Gao, L. Ci, C. Wang and P. M. Ajayan, Carbon, 2010, 48, 1124 CrossRef CAS.
- X. Zhou, X. Huang, X. Qi, S. Wu, C. Xue, F. Y. C. Boey, Q. Yan, P. Chen and H. Zhang, J. Phys. Chem. C, 2009, 113, 10842 CAS.
- Z. Huang, H. Zhou, C. Li, F. Zeng, C. Fua and Y. Kuang, J. Mater. Chem., 2012, 22, 1781 RSC.
- Z. Ji, X. Shen, Y. Xu, G. Zhu and K. Chen, J. Colloid Interface Sci., 2014, 432, 57 CrossRef CAS PubMed.
- C. N. R. Rao, A. K. Sood, K. S. Subrahmanyam and A. Govindaraj, Angew. Chem., Int. Ed., 2009, 48, 7752 CrossRef CAS PubMed.
- C. Soldano, A. Mahmood and E. Dujardin, Carbon, 2010, 48, 2127 CrossRef CAS PubMed.
- M. J. Allen, V. C. Tung and R. B. Kaner, Chem. Rev., 2010, 110, 132 CrossRef CAS PubMed.
- Y. Zhu, S. Murali, W. Cai, X. Li, J. W. Suk, J. R. Potts and R. S. Ruoff, Adv. Mater., 2010, 22, 3906 CrossRef CAS.
- Y. Shao, J. Wang, H. Wu, J. Liu, I. A. Aksay and Y. Lin, Electroanalysis, 2010, 22, 1027 CrossRef CAS PubMed.
- M. Zhou, Y. Zhai and S. Dong, Anal. Chem., 2009, 81, 5603 CrossRef CAS PubMed.
- D. A. C. Brownson and C. E. Banks, Analyst, 2010, 135, 2768 RSC.
- M. Pumera, Electrochem. Commun., 2013, 36, 14 CrossRef CAS PubMed.
- C. Xu, X. Wang and J. Zhu, J. Phys. Chem. C, 2008, 112, 19841 CAS.
- S. Stankovich, D. A. Dikin, G. H. B. Dommett, K. M. Kohlhaas, E. J. Zimney, E. A. Stach, R. D. Piner, S. T. Nguyen and R. S. Ruoff, Nature, 2006, 442, 282 CrossRef CAS PubMed.
- X. Zhou, X. Huang, X. Qi, S. Wu, C. Xue, F. Y. C. Boey, Q. Yan, P. Chen and H. Zhang, J. Phys. Chem. C, 2009, 113, 10842 CAS.
- Y. Zhang, K. Fugane, T. Mori, L. Niu and J. Ye, J. Mater. Chem., 2012, 22, 6575 RSC.
- S. C. Sahu, A. K. Samantara, B. Satpati, S. Bhattacharjee and B. K. Jena, Nanoscale, 2013, 5, 11265 RSC.
- M. B. Gholivand, N. Karimian and M. Torkashvand, J. Anal. Chem., 2015, 70, 384 CrossRef CAS.
- S. Wu, Q. He, C. Tan, Y. Wang and H. Zhang, Small, 2013, 9, 1160 CrossRef CAS PubMed.
- A. Ambrosi, C. K. Chua, A. Bonanni and M. Pumera, Chem. Rev., 2014, 114, 7150 CrossRef CAS PubMed.
- C. Huang, C. Li and G. Shi, Energy Environ. Sci., 2012, 5, 8848 CAS.
- X. Gan and H. Zhao, Sens. Mater., 2015, 27, 191 Search PubMed.
- L. Li, L. Hu, J. Li and Z. Wei, Nano Res., 2015, 8, 418 CrossRef CAS.
- M. Liu, R. Zhang and W. Chen, Chem. Rev., 2014, 114, 5117 CrossRef CAS PubMed.
- C. Hu, C. Yu, M. Li, X. Wang, Q. Dong, G. Wang and J. Qiu, Chem. Commun., 2015, 51, 3419 RSC.
- N. G. Sahoo, Y. Pan, L. Li and S. H. Chan, Adv. Mater., 2012, 24, 4203 CrossRef CAS PubMed.
- S. Bong, Y. R. Kim, I. Kim, S. Woo, S. Uhm, J. Lee and H. Kim, Electrochem. Commun., 2010, 12, 129 CrossRef CAS.
- B. F. Machado and P. Serp, Catal. Sci. Technol., 2012, 2, 54 CAS.
- X. Huang, X. Qi, F. Boey and H. Zhang, Chem. Soc. Rev., 2012, 41, 666 RSC.
- B. Habibi and N. Delnavaz, Int. J. Hydrogen Energy, 2011, 36, 9581 CrossRef CAS PubMed.
- B. Habibi and S. Ghaderi, Int. J. Hydrogen Energy, 2015, 40, 5115 CrossRef CAS PubMed.
- B. Habibi and N. Delnavaz, RSC Adv., 2012, 2, 1609 RSC.
- B. Habibi and S. Dadashpour, Electrochim. Acta, 2013, 88, 157 CrossRef CAS PubMed.
- W. S. Hummers Jr and R. E. Offeman, J. Am. Chem. Soc., 1958, 80, 1339 CrossRef.
- D. J. Guo, S. K. Cui and H. Sun, J. Nanopart. Res., 2009, 11, 707 CrossRef CAS.
- C. L. Campos, C. Roldán, M. Aponte, Y. Ishikawa and C. R. Cabrera, J. Electroanal. Chem., 2005, 581, 206 CrossRef CAS PubMed.
- M. Zhou, N. R. Tacconi and K. Rajeshwar, J. Electroanal. Chem., 1997, 421, 111 CrossRef CAS.
- N. A. Kotov, I. Dekany and J. H. Fendler, Adv. Mater., 1996, 8, 637 CrossRef CAS PubMed.
- L. Chen, Y. Tang, K. Wang, C. Liu and S. Luo, Electrochem. Commun., 2011, 13, 133 CrossRef CAS PubMed.
- R. Mohammad-Rezaei and H. Razmi, Electroanalysis, 2012, 24, 2094 CrossRef CAS PubMed.
- L. Stobinski, B. Lesiak, A. Malolepszy, M. Mazurkiewicz, B. Mierzwa, J. Zemek, P. Jiricek and I. Bieloshapka, J. Electron Spectrosc. Relat. Phenom., 2014, 195, 145 CrossRef CAS PubMed.
- F. Li, Y. Guo, T. Wu, Y. Liu, W. Wang and J. Gao, Electrochim. Acta, 2013, 111, 614 CrossRef CAS PubMed.
- S. Yu, Q. Liu, W. Yang, K. Han, Z. Wang and H. Zhu, Electrochim. Acta, 2013, 94, 245 CrossRef CAS PubMed.
- B. D. Cullity, Elements of X-ray Diffraction, Addison-Wesley, 1978 Search PubMed.
- J. Zhao, W. Chen and Y. Zheng, Mater. Chem. Phys., 2009, 113, 591 CrossRef CAS PubMed.
- S. Trasatti and O. A. Petrii, Pure Appl. Chem., 1991, 63, 711 CrossRef CAS.
- F. Gloaguen, J. M. Leger and C. Lamy, J. Appl. Electrochem., 1997, 27, 1052 CrossRef CAS.
- L. J. Zhang, Z. Y. Wang and D. G. Xia, J. Alloys Compd., 2006, 426, 268 CrossRef CAS PubMed.
- J. H. Chen, M. Y. Wang, B. Liu, Z. Fan, K. Z. Cui and Y. F. Kuang, J. Phys. Chem. B, 2006, 110, 11775 CrossRef CAS PubMed.
- J. Kua and W. A. Goddard III, J. Am. Chem. Soc., 1999, 121, 10928 CrossRef CAS.
- D. J. Díaz, N. Greenletch, A. Solanki, A. Karakoti and S. Seal, Catal. Lett., 2007, 119, 319 CrossRef.
- A. Hamnet, Catal. Today, 1997, 38, 445 CrossRef.
- A. Ciftci, D. A. J. M. Ligthart, P. Pastorino and E. J. M. Hensen, Appl. Catal., B, 2013, 130, 325 CrossRef PubMed.
- B. Habibi and N. Delnavaz, Int. J. Hydrogen Energy, 2010, 35, 8831 CrossRef CAS PubMed.
- D. Sebastián, J. C. Calderόn, J. A. González-Expόsito, E. Pastor, M. V. Martínez-Huerta, I. Suelves, R. Moliner and M. J. Lázaro, Int. J. Hydrogen Energy, 2010, 35, 9934 CrossRef PubMed.
- A. Deshpande and N. M. Gupta, Int. J. Hydrogen Energy, 2010, 35, 3287 CrossRef CAS PubMed.
- N. P. Sardesai, A. Karimi and S. Andreescu, ChemElectroChem, 2014, 1, 2082 CrossRef CAS PubMed.
- T. Masuda, H. Fukumitsu, K. Fugane, H. Togasaki, D. Matsumura, K. Tamura, Y. Nishihata, H. Yoshikawa, K. Kobayashi, T. Mori and K. Uosaki, J. Phys. Chem. C, 2012, 116, 10098 CAS.
- L. Feng, J. Yang, Y. Hu, J. Zhu, C. Liu and W. Xing, Int. J. Hydrogen Energy, 2012, 37, 4812 CrossRef CAS PubMed.
- A. N. Correia, L. H. Mascaro, S. A. S. Machad and L. A. Avaca, J. Braz. Chem. Soc., 1999, 10, 478 CrossRef CAS.
- Q. Yi, J. Zhang, A. Chen, X. Liu, G. Xu and Z. Zhou, J. Appl. Electrochem., 2008, 38, 695 CrossRef CAS.
- Y. C. Bai, W. D. Zhang, C. H. Chen and J. Q. Zhang, J. Alloys Compd., 2011, 509, 1029 CrossRef CAS PubMed.
- Z. Wang and K. Qiu, Electrochem. Commun., 2006, 8, 1075 CrossRef CAS PubMed.
- Q. Yi, W. Huang, X. Liu, G. Xu, Z. Zhou and A. Chen, J. Electroanal. Chem., 2008, 619–620, 197 CrossRef CAS PubMed.
- S. Uhm, H. Jeon and J. Lee, J. Electrochem. Sci. Technol., 2010, 1, 10 CrossRef CAS.
- S. Chakraborty and C. R. Raj, Carbon, 2010, 48, 3242 CrossRef CAS.
- N. Kristian, Y. Yan and X. Wang, Chem. Commun., 2008, 353–355, 353 RSC.
- Q. Yi, A. Chen, W. Huang, J. Zhang, X. Liu, G. Xu and Z. Zhou, Electrochem. Commun., 2007, 9, 1513 CrossRef CAS PubMed.
- J. B. Xu, T. S. Zhao and Z. X. Liang, J. Phys. Chem. C, 2008, 112, 17362 CAS.
- V. Selvaraj, M. Alagar and K. S. Kumar, Appl. Catal., B, 2007, 75, 129 CrossRef CAS PubMed.
- R. Xie, M. Chen, J. Wang, S. Mei, Y. Pan and H. Gu, RSC Adv., 2015, 5, 650 RSC.
- T. Maiyalagan, X. Wang and A. Manthiram, RSC Adv., 2014, 4, 4028 RSC.
- V. Selvaraj, A. Nirmala Grace and M. Alagar, J. Colloid Interface Sci., 2009, 333, 254 CrossRef CAS PubMed.
- A. Nozad Golikand, M. Ghannadi Maragheh, S. Sedaghat Sherehjini, K. M. Taghi-Ganji and M. Yari, Electroanalysis, 2006, 18, 911 CrossRef PubMed.
- H. Razmi, E. Habibi and H. Heidari, Electrochim. Acta, 2008, 53, 8178 CrossRef CAS PubMed.
| This journal is © The Royal Society of Chemistry 2015 |

