 Open Access Article
Electron transport through electrically conductive nanofilaments in Rhodopseudomonas palustris strain RP2†
Krishnaveni
Venkidusamy
ab,
Mallavarapu
Megharaj
*abc,
Uwe
Schröder
d,
Fouad
Karouta
e,
S. Venkata
Mohan
f and
Ravi
Naidu
abc
aCentre for Environmental Risk Assessment and Remediation (CERAR), University of South Australia, Mawson Lakes, SA 5095, Australia. E-mail: megh.mallavarapu@newcastle.edu.au
bCRC for Contamination Assessment and Remediation of the Environment (CRCCARE), Mawson Lakes, SA 5095, Australia
cGlobal Centre for Environmental Remediation, Faculty of Science and Information Technology, The University of Newcastle, Callaghan, NSW2308, Australia
dInstitute of Environmental and Sustainable Chemistry, Technische, Universitat Braunschweig, Hagenring 30, 38106 Braunschweig, Germany
eAustralian National Fabrication Facility, ACT Node, Australian National University, Canberra, Australia
fBioengineering and Environmental Sciences (BEES), CSIR-Indian Institute of Chemical Technology (CSIR-IICT), Hyderabad 500 007, India
First published on 24th November 2015
Abstract
Electronic dialogue between proteins is expected to be a key component of charge transport at the microbe–mineral interface (MMI) and requires complex structures. Microbial nanofilaments are one such structure produced in energetically engineered environments. These nanostructures consist of natural protein electronic conduits which can target the microbe–mineral interface and facilitate charge transport over a distance. Nanofilaments are phylogenetically diverse inducible extracellular appendages, and have the potential to serve as organic electronic conductors. However, recent investigations on such microbial nanofilaments have been confined to a few bacterial genera such as Geobacter, Shewanella and Synechocystis. Here, we report the evidence for longitudinal electron transport through inducible nanofilaments produced by another genus, the metabolically versatile photosynthetic, iron(III) respiring bacterium Rhodopseudomonas palustris strain RP2, in photic, iron(III) oxide-rich environments. In contrast, chemosynthetic dark-grown anoxic cells are weak in their ability to reduce ferric-oxide and no longer produce extracellular structures. Independent evaluation techniques illustrate the induction of extracellular filaments and their electrical properties. Scanning probe and nanofabricated electrode measurements provide conclusive evidence for the occurrence of direct charge transfer along the length and radius of nanofilaments from strain RP2. These findings not only expand our knowledge of the range of bacteria known to produce nanofilaments but also provide further research opportunities in the field of bionanotechnology, sustainable remediation (bioelectrochemical remediation systems) in contaminated sites (petroleum hydrocarbons) and MMI process at photic environments.
1. Introduction
The interactions occurring at the microbial–mineral (MMI) interface have recently emerged as a field of study in electro-microbiology. This activity is fast becoming recognised as important in advanced technologies such as those used in bioelectrochemical remediation in challenging environments.1–3 The microbial metabolism of solid minerals as final electron acceptors during energy conservation processes is known as the dissimilatory metal oxide reduction (DMR) pathway.1,4 This pathway is an essential part in the remediation of organic contaminants, radioactive compounds and heavy metals such as uranium and chromium5,6 and it also assists in nutrient cycling1 environmental sustainability and energy recovery processes.2 Dissimilatory metal oxide reducing bacteria (DMRB) are ubiquitous in nature7,8 and their identification9–11 has led to deeper insights into the molecular and physiological processes12,13 involved in electron transfer14 including how they interact with challengeable environments such as in presence of insoluble metal oxides, physical availability of electron acceptors. The insoluble nature of solid oxides requires peculiar structures to facilitate the transport of electrons from the bacterial inner membrane to these terminal acceptors.12,15,16Recent investigations into extracellular electron transfer have established the importance of outer membrane cytochrome proteins12,16,17 electrically conductive extracellular appendages10,11 soluble mediators,18 secondary metabolites19 and chemotaxis20 in the metal oxide respiring or electrode respiring process. Of these, electrically conductive extracellular (induced) nanostructures consist of natural protein electronic conduits called bacterial nanofilaments which can target the microbe–mineral interface and facilitate charge transport over a distance during the MMI process.21 However, extensive studies have so far examined only a few bacterial nanofilaments, mainly from strains of the Geobacteraceae.22,23 Shewanellaceae,11,12 Merismopediaceae and in a syntrophy.24 Here we report the evidence for the induction of electrically active filaments from a metabolically versatile strain of Rhodopseudomonas palustris strain RP2 in energetically engineered environments.
2. Results and discussion
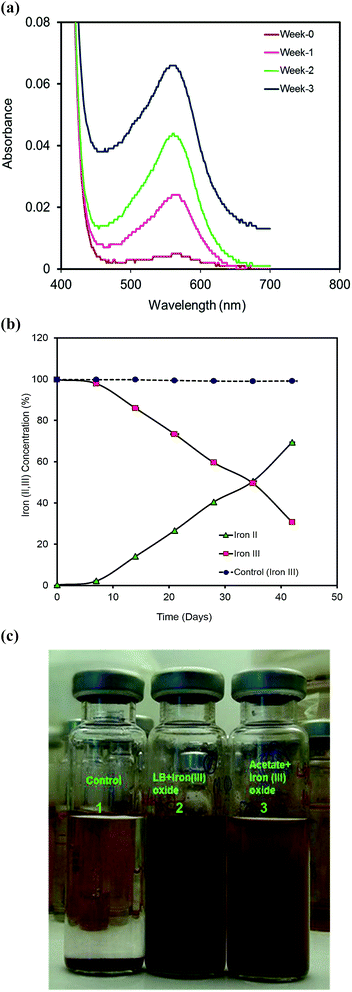
Rhodopseudomonas species are associated with a variety of environments such as euxinic lagoons,25 limnetic zones,26 marine sediments, sewage sludges and poorly drained soils.27 In our laboratory experiments, a strain of Rhodopseudomonas palustris, designated RP2 emerged as a dominant species isolated from the anodic biofilm of a previously enriched diesel-fed microbial fuel cell. Pure cultures of the strain RP2 contain double membrane bilayers, lamellar thylakoid membrane systems (ESI, Fig. S1(a)†), produce chains of magnetosomes (ESI, Fig. S1(b)†), cysts (ESI, Fig. S1(c)†) and grow as long bacillus-shaped cells with asymmetric cell division(ESI, Fig. S1(d)†). Light grown anoxic cells are purple in colour and have exceptional growth flexibility based on environmental signals such as photoorganotrophic, photolithotrophic, dark fermentative and aerobic heterotrophic mechanisms. Salient properties of the strain RP2 were direct electrode respiration, dissimilatory metal oxide reduction, anaerobic nitrate reduction, free living diazotrophy and the ability to degrade n-alkane components of diesel range hydrocarbons in anoxic environments.We cultured RP2 cells in LB medium under two different environmental conditions: anoxic photoheterotrophic and anoxic chemoheterotrophic with crystalline iron(III) oxide as a terminal electron acceptor to investigate the dissimilatory metal oxide reduction trait. Iron(III) oxide reduction was monitored by colour change (Fig. 1a) and hydroxylamine Fe(II) extraction assay (Fig. 1b and c). Iron(III) oxide reduction (69.46% ± 0.41%) was observed only in anoxic photoheterotrophic environments whereas chemosynthetic grown cells showed no reduction. During this process, peculiar extracellular filamentous structures were observed in the phototrophic growth conditions.
2.1 Electron microscopy studies
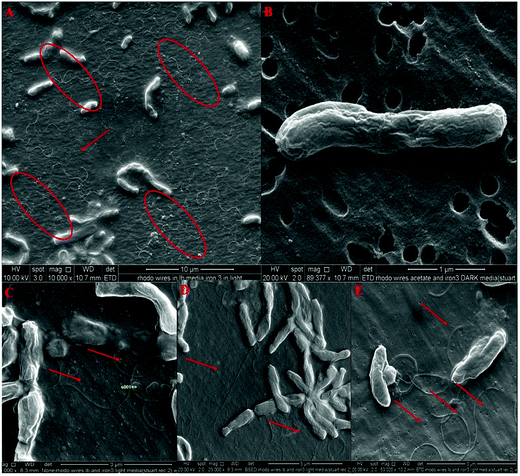
Scanning electron microscopy observation was used to determine that these extracellular structures were induced by physiologically relevant conditions. Priority was given to the culture conditions, and to using microscopic methods that avoided any artefacts resulting from polysaccharide layers as investigated earlier.10,11,24,28 During SEM examination, the largest numbers of extracellular filamentous structures were observed under phototrophically grown iron(III) oxide culture conditions (Fig. 2a–d). By contrast, cells grown in chemosynthetic environments were weak in their ability to reduce ferric oxide and no longer produced extracellular structures (Fig. 2e). The dimensions of these filaments are >150 nm and they extend to several microns (Fig. 2b) with branches and bundles also occurring. Similar structures were perceived in transmission electron micrographs (ESI Fig. S2†) with regular shaped chains of magnetite as magnetosomes (ESI Fig. S1(b)†) running along the longitudinal axis of cells. These results indicated that the extracellular appendages were clearly inducible under relevant physiological conditions involving solid electron acceptor reduction as reported in earlier studies of Geobacter10 and Shewanella.11,242.2 Scanning probe imaging studies
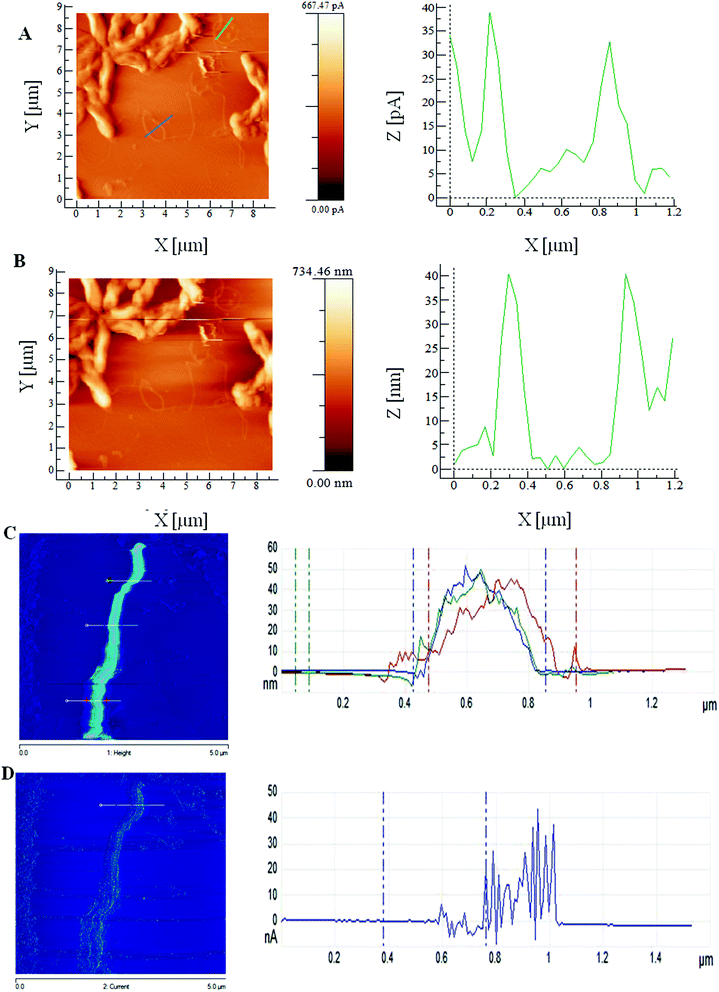
To further investigate the filaments' electrical conductance properties, they were characterized by employing a number of independent methods including scanning probe imaging with both current sensing atomic force microscopy (CSAFM) and scanning tunnelling microscopy (STM). In order to verify the evidence of longitudinal electron transport of RP2 nanofilaments, we used nanofabricated electrodes combined with a dual beam focused ion beam technique (FIB) with SEM capability.2.3 Electrical measurements using nanofabrication electrodes by dual beam focused ion beam method
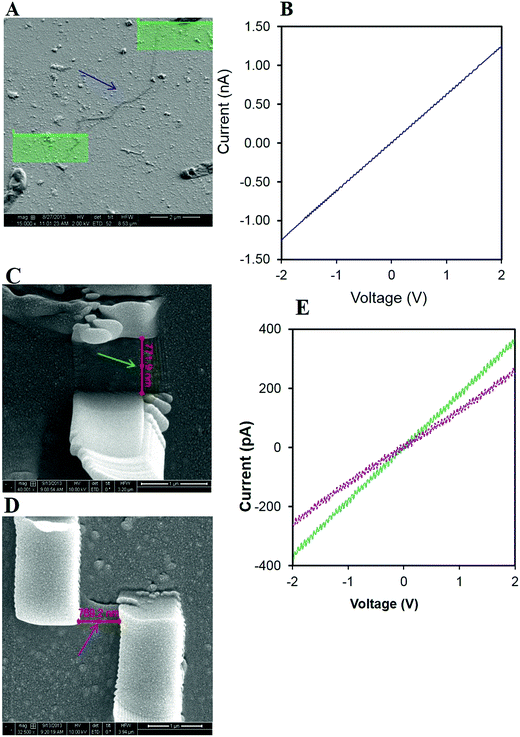
A nanofabricated electrode technique was applied by using a combination of lift-off technique, optical lithography and FIB technique to ensure electrical contact with the nanofilaments using Pt deposition.29 This technique has been demonstrated by previous researchers11,28 who evaluated the electrical conductance of semiconductor nanowires30 and biological nanowires in the Shewanella and the dental microbiome.11,28 Chemically fixed uncoated nanofilament samples were placed on the glass substrate with pre-patterned Au microelectrodes. The dual beam focused ion beam SEM imaging was used to identify the positions of nanowires located either between two adjacent contact pads or touching one contact pad. ESI Fig. S5† shows a FIB-SEM micrograph of the overall layout with all contacted nanofilaments and the reference strip with the contact pads. I/V measurements show a strong linear relationship following the Pt deposition with an applied voltage from −2 V to +2 V. The closed circuit reference indicated a resistance of 1.8 GΩ from a current of 550 pA at 1 V. Fig. 4a illustrates the contacting procedure of a single nanofilament by Pt electrode originating from strain RP2 grown under physiologically relevant conditions. The measured length of nanofilament 1 was 5.6 μm with a calculated resistance of 2.96 GΩ (1 V). Fig. 4b illustrates the linear relationship from two other bacterial nanofilaments emanating from the same sample with a resistance of 3.22 GΩ, 1.52 GΩ and resistivity of 290 Ω m−1, 139 Ω m−1 respectively. The ohmic relationship between I and V confirmed the conductive nature of the nanofilaments and the response was similar to that seen in Shewanella11 and oral microbiome28 studies.The bacterial nanofilaments were tens of nanometres to tens of micrometres longer than the bacterial cells. These findings suggest that the bacterial nanofilaments are distinctive extracellular appendages that function like a conductor and are consistent with earlier reports for other organisms.22,31 These conductive filaments are not only exclusive to environmental isolates from dissimilatory bacteria, but are also produced in biofilms such as oral microbiome.28 Such nanofilaments make electrical communication between cells possible.21 These nanofilaments also differ within the dissimilatory metal reducers. The occurrence of thin single-strand nanofilaments has been observed in Geobacter sulfurreducens10 whereas Shewanella oneidensis24 produced thick cable-like conductive wires to obtain access to the insoluble electron acceptors. In our study, we have observed both single-strand and bundled structures with a conductive trait. This may be due to variations in the pilin domain proteins between each group of organisms.10,24,32 Type IV pilin proteins of Shewanella oneidensis are longer than Geobacter pilin proteins such as fimbrium.10 Similarly, a distant phylogenetic relationship exists between the gene oxpG in Geobacter and the gene involved in type IV bacterial pilin secretion.10,24
2.4 Analysis of key proteins involved in extracellular electron transfer mechanisms
The outer membrane cytochromes (Omc) such as OmcA and Mtr genes are also reported to be involved in the extracellular metal reduction (Fe(III)/Mn(IV)/MFC electrode) pathway of Shewanella.15,17 In order to analyze the pilin and other outer membrane proteins involved in extracellular electron transfer and nanofilaments formation of the strain RP2, the genomic level comparison is required. ESI Table S1† shows the similarity percentage of Mtr gene sequences of Rhodopseudomonas palustris strain RP2 and other strains of Rhodopseudomonas palustris. ESI Fig. S7† shows the phylogenetic relationship derived from amino acid sequence of MtrA gene alignments with closely related species. The two dimensional structural prediction of MtrA gene between Rhodopseudomonas palustris RP2 and Shewanella oneidensis MR1 is shown in ESI Fig. S8.† Alignment of MtrA protein of Shewanella oneidensis MR1 with Rhodopseudomonas palustris strain RP2 showed only 138 (18.0%) identical sites. The major observation from our study is that no horizontal gene transfer events occurred at the genus level as can be seen in the phylogenetic relationships where the phylogenetic tree from these gene sequences shows the same relationships as seen for the general taxonomic classification of the same bacteria. Two dimensional structural predictions also show a higher degree of variation between these two strains.Based on the above findings, we have demonstrated the physiological induction of nanofilaments from a metabolically versatile, iron(III) respiring, photosynthetic bacterium Rhodopseudomonas palustris strain RP2. The nanofilaments produced by the strain RP2 are found to be conductive filaments which is evident from the ohmic behavior of their linear IV trace. Although the methods used in our study10,11,24,33 have provided conclusive evidence for the conductivity of nanofilaments from this Rhodopseudomonas palustris strain RP2, a complete understanding of the conductive nature of the biological proteins involved, molecular structure of filaments13,23,34 and their electron exchange chain35,36 will deliver more information about the mechanism involved in conductivity. Further computational studies involving three dimensional homology modeling will reveal how structural changes in the outer membrane proteins of Rhodopseudomonas palustris strain RP2 influence its extracellular electron transfer mechanisms.
3. Conclusions
This study opens the possibilities of future research in the direction of bio-nanophysics13 and genetic mutant studies12 to get deeper understanding with the complete molecular composition and physiological process of induced nanofilaments. These findings expand our knowledge of the range of bacteria known to synthesize nanofilaments and provide further research opportunities in the field of bionanotechnology, bioelectrochemical remediation systems (petroleum hydrocarbon contaminated sites) and MMI process at photic environments.4. Experimental
4.1 Bacterial strain, growth conditions
Rhodopseudomonas palustris strain RP2 was isolated from the anodic biofilm of a bioelectrochemical remediation system through serial dilution techniques. Cultures were routinely cultivated using anoxic rich medium (LB) in illuminated conditions. Nucleic acids were extracted and the 16S rRNA gene sequence of the strain was deposited in GenBank under the accession number (KJ460004). The cells were also examined for their growth under different physiological conditions such as photoorganotrophic, photolithotrophic, chemoorganotrophic and chemolithotrophic in anoxic and oxic environments. A chemically defined medium was used with acetate (20 mM) and nitrate (10 mM), sulfate (10 mM), iron citrate (10 mM) or iron(III) oxide (10 mM) as the respective electron donor and acceptors supplemented with Wolfe's trace elements and vitamins as previously described.374.2 Iron(III) oxide reduction
For investigating the induction of extracellular filaments, cells were grown in two different environments: anoxic photoheterotrophic and chemoheterotrophic culture conditions supplemented with crystalline iron(III) oxide (10 mM) as the terminal electron acceptor. The cells were grown in Wolfe's medium using acetate (20 mM) supplemented with trace elements and vitamins.37 Iron(III) reduction was determined using the ferrozine assay.38 The bacterial suspension was added to a pre-weighed vial containing 0.5 M HCL. HCL extracted samples were added to 5 ml of ferrozine (1 g l−1) in 50 mM HEPS buffer. The filtered samples were then analysed in a UV-Vis spectrophotometer (maxima@λ 562 nm) to quantify the Fe(II) formation as previously described.384.3 Microscopic methods
4.3.3.1 Atomic force microscopy (ScanAsyst). Tapping mode AFM gives a higher resolution image of filament samples that are difficult to image through the current sensing mode. Samples were applied to freshly cleaved highly oriented pyrolytic graphite (HOPG) and left to adsorb for 30 minutes on the graphite surface. The adsorbed samples were fixed with 4% glutaraldehyde fixative for 10 min. Samples were thoroughly washed with anaerobically prepared PBS buffer followed by subsequent anaerobic sterile deionised water to remove salts, and EPS (exo polysaccharides) from the cell surface. The HOPG samples with bacteria/nanofilaments were investigated using a ScanAsyst mode AFM (MultiMode 8 with Nanoscope V controller, Bruker, United States) as stated earlier.10,31 ScanAsyst is a self-optimising AFM imaging mode utilising an integrated Peak Force Tapping, which oscillates the cantilever below its resonance frequency. The premium ScanAsyst Air silicon nitride probes (nominal resonant frequency 50–90 kH, nominal spring constant 0.4 N m−1, nominal tip radius 10 nm; Bruker, United States) were used. All AFM measurements were conducted inside a clean room (Class 1000) at 22 °C (±1 °C).
4.3.3.2 Current sensing AFM (CSAFM). Current sensing AFM (CSAFM) was used to image both topography as well as the conductivity of filament samples of the strain RP2 simultaneously. A bias voltage was applied to the sample while the cantilever was kept at virtual ground. A multipurpose scanner (Agilent multipurpose scanner, Australia) was employed with a CSAFM nose assembly for imaging the filaments as previously described.10,24 The prepared AFM specimen was then mounted on a lab-built HOPG sample plates. The platinum coated probes were used with a nominal spring constant of 0.2 N m−1 for conductive imaging mode analysis. Topographic imaging of the bacterial nanofilaments was performed at a loading force of 5 nN. In addition to the topography, conductive mapping reveals information about the electrical properties of the filament and designated as nanofilaments of the strain RP2. ImageJ, WSxM, SPIP and Nanoscope software programs were used for further image data visualisation and processing of the SEM, SPM images.
4.3.3.3 Scanning tunnelling microscopy (STM). STM of air dried filament samples were investigated as stated earlier24,33 using a Bruker Multimode 8 STM equipped with ‘E’ scanner (maximum scan range 10 μm in the in-plane x- and y-directions, and nominal 2.5 μm in the normal to the surface z-direction) and Pt/Ir tips (Bruker, USA). Set point current values are in the range of ∼1–2 nA. The STM imaging was challenged by bacterial cells and organic contaminants. Samples were identified from flat features characteristic to HOPG surface. Image data processing was performed by using NanoScope analysis.
4.4 Electrical transport measurements-nanofabricated electrodes
To enable electrical measurements of nanofilament samples, combination of optical lithography, metal etching and dual beam focused ion beam (FIB) techniques were used as reported earlier.11,28| R = ρL/A | (1) |
4.5 Genome sequencing and analysis
Rhodopseudomonas palustris strain RP2 cells were grown in LB medium for 36 h and genomic DNA was isolated using the Mo Bio Ultraclean® Microbial DNA Isolation Kit. Genome sequencing was carried out in an ion torrent personal genome machine (PGM) platform using 314 chip as per the manufacturer's instructions at the Adelaide node of the Australian Genome Research Facility Ltd. (AGRF). Sequencing yielded 3![[thin space (1/6-em)]](https://www.rsc.org/images/entities/char_2009.gif) 255
255![[thin space (1/6-em)]](https://www.rsc.org/images/entities/char_2009.gif) 369 reads with a mean length of 173 bp resulting in 563.10 Mbp sequenced bases and the longest read was 398 bp. De novo assembly and annotation of genome were carried out using CLC Genomics Workbench version 6.5 and rapid annotation using subsystem technology (RAST) version 4.0
369 reads with a mean length of 173 bp resulting in 563.10 Mbp sequenced bases and the longest read was 398 bp. De novo assembly and annotation of genome were carried out using CLC Genomics Workbench version 6.5 and rapid annotation using subsystem technology (RAST) version 4.0![[thin space (1/6-em)]](https://www.rsc.org/images/entities/char_2009.gif) 39 while phylogenetic analysis was conducted using MEGA version 5.2.40
39 while phylogenetic analysis was conducted using MEGA version 5.2.40
Acknowledgements
This work was performed at the South Australian node of the Australian National Fabrication Facility under the National Collaborative Research Infrastructure Strategy to provide nano and microfabrication facilities for Australia's researchers. The authors thank D. Venkatachalam, M. Krawsokoa, D. Simon for confirming the validity of the techniques used. KV thanks Australian Federal Government, University of South Australia for International Postgraduate Research Scholarship award (IPRS) and CRC CARE for the research top-up award.Notes and references
- D. R. Lovley, ASM News, 2002, 68(5), 231–237 Search PubMed.
- O. Bretschger, A. Obraztsova, C. A. Sturm, I. S. Chang, Y. A. Gorby, S. B. Reed, D. E. Culley, C. L. Reardon, S. Barua and M. F. Romine, Appl. Environ. Microbiol., 2007, 73(21), 7003–7012 CrossRef CAS PubMed.
- S. Kato, R. Nakamura, F. Kai, K. Watanabe and K. Hashimoto, Environ. Microbiol., 2010, 12(12), 3114–3123 CrossRef CAS PubMed.
- L. J. Liermann, E. M. Hausrath, A. D. Anbar and S. L. Brantley, J. Anal. At. Spectrom., 2007, 22(8), 867–877 RSC.
- D. E. Holmes, K. T. Finneran, R. A. O'Neil and D. R. Lovley, Appl. Environ. Microbiol., 2002, 68(5), 2300–2306 CrossRef CAS PubMed.
- K. T. Finneran, R. T. Anderson, K. P. Nevin and D. R. Lovley, Soil and Sediment Contamination: An International Journal, 2002, 11(3), 339–357 CrossRef CAS.
- H. L. Ehrlich and D. K. Newman, Geomicrobiology, CRC press: Taylor & Francis Group, 2008 Search PubMed.
- D. R. Lovley, D. E. Holmes and K. P. Nevin, Adv. Microb. Physiol., 2004, 49, 219–286 CrossRef CAS PubMed.
- R. A. Rosselló-Mora, W. Ludwig, P. Kämpfer, R. Amann and K. H. Schleifer, Appl. Microbiol., 1995, 18(2), 196–202 CrossRef.
- G. Reguera, K. D. McCarthy, T. Mehta, J. S. Nicoll, M. T. Tuominen and D. R. Lovley, Nature, 2005, 1098–1101 CrossRef CAS PubMed.
- M. Y. El-Naggar, G. Wanger, K. M. Leung, T. D. Yuzvinsky, G. Southam, J. Yang, W. M. Lau, K. H. Nealson and Y. A. Gorby, Proc. Natl. Acad. Sci. U. S. A., 2010, 107(42), 18127–18131 CrossRef CAS PubMed.
- S. Pirbadian, S. E. Barchinger, K. M. Leung, H. S. Byun, Y. Jangir, R. A. Bouhenni, S. B. Reed, M. F. Romine, D. A. Saffarini and L. Shi, Proc. Natl. Acad. Sci. U. S. A., 2014, 111(35), 12883–12888 CrossRef CAS PubMed.
- D. R. Lovley and N. S. Malvankar, Environ. Microbiol., 2015, 17, 2209–2215 CrossRef CAS PubMed.
- J. K. Fredrickson and Y. A. Gorby, Curr. Opin. Biotechnol., 1996, 7(3), 287–294 CrossRef CAS PubMed.
- J. A. Gralnick and D. K. Newman, Mol. Microbiol., 2007, 65(1), 1–11 CrossRef PubMed.
- D. J. Richardson, J. N. Butt, J. K. Fredrickson, J. M. Zachara, L. Shi, M. J. Edwards, G. White, N. Baiden, A. J. Gates and S. J. Marritt, Mol. Microbiol., 2012, 85(2), 201–212 CrossRef CAS PubMed.
- L. Shi, D. J. Richardson, Z. Wang, S. N. Kerisit, K. M. Rosso, J. M. Zachara and J. K. Fredrickson, Environ. Microbiol. Rep., 2009, 1(4), 220–227 CrossRef CAS PubMed.
- D. R. Lovley, J. D. Coates, E. L. Blunt-Harris, E. J. Phillips and J. C. Woodward, Nature, 1996, 382(6590), 445–448 CrossRef CAS.
- D. K. Newman and R. Kolter, Nature, 2000, 405(6782), 94–97 CrossRef CAS PubMed.
- S. E. Childers, S. Ciufo and D. R. Lovley, Nature, 2002, 416(6882), 767–769 CrossRef CAS PubMed.
- C. Pfeffer, S. Larsen, J. Song, M. Dong, F. Besenbacher, R. L. Meyer, K. U. Kjeldsen, L. Schreiber, Y. A. Gorby and M. Y. El-Naggar, Nature, 2012, 491(7423), 218–221 CrossRef CAS PubMed.
- N. S. Malvankar, M. Vargas, K. P Nevin, A. E. Franks, C. Leang, B. C. Kim, K. Inoue, T. Mester, S. F. Covalla and J. P. Johnson, Nat. Nanotechnol., 2011, 6(9), 573–579 CrossRef PubMed.
- N. S. Malvankar, M. Vargas, K. Nevin, P. L. Tremblay, K. Evans-Lutterodt, D. Nykypanchuk, E. Martz, M. T. Tuominen and D. R. Lovley, mBio, 2015, 6(2), e00084 CrossRef PubMed.
- Y. A. Gorby, S. Yanina, J. S. McLean, K. M. Rosso, D. Moyles, A. Dohnalkova, T. J. Beveridge, I. S. Chang, B. H. Kim and K. S. Kim, Proc. Natl. Acad. Sci. U. S. A., 2006, 103(30), 11358–11363 CrossRef CAS PubMed.
- R. Whittenbury and A. McLee, Arch. Mikrobiol., 1967, 59(1–3), 324–334 CAS.
- K. Eckersley and C. S. Dow, J. Gen. Microbiol., 1980, 119(2), 465–473 Search PubMed.
- F. W. Larimer, P. Chain, L. Hauser, J. Lamerdin, S. Malfatti, L. Do, M. L. Land, D. A. Pelletier, J. T. Beatty and A. S. Lang, Nat. Biotechnol., 2003, 22(1), 55–61 CrossRef PubMed.
- G. Wanger, Y. Gorby, M. Y. El-Naggar, T. D. Yuzvinsky, C. Schaudinn, A. Gorur and P. P. Sedghizadeh, Oral Surgery, Oral Medicine, Oral Pathology and Oral Radiology, 2013, 115(1), 71–78 CrossRef PubMed.
- L. A. Giannuzzi, B. Kempshall, S. Schwarz, J. Lomness, B. Prenitzer, and F. Stevie, Introduction to Focused Ion Beams, Springer, 2005, ch. 10 Search PubMed.
- S. M. Eichfeld, T. T. Ho, C. M. Eichfeld, A. Cranmer, S. E. Mohney, T. S. Mayer and J. M. Redwing, Nanotechnology, 2007, 18(31), 315201 CrossRef.
- K. M. Leung, G. Wanger, M. El-Naggar, Y. Gorby, G. Southam, W. M. Lau and J. Yang, Nano Lett., 2013, 13(6), 2407–2411 CrossRef CAS PubMed.
- B. E. Logan, Nat. Rev. Microbiol., 2009, 7(5), 375–381 CrossRef CAS PubMed.
- J. P. Veazey, G. Reguera and S. H. Tessmer, Phys. Rev., 2011, E84(6), 060901–060904 Search PubMed.
- N. S. Malvankar and D. R. Lovley, ChemSusChem, 2012, 5(6), 1039–1046 CrossRef CAS PubMed.
- G. J. Bartlett, A. Choudhary, R. T. Raines and D. N. Woolfson, Nat. Chem. Biol., 2010, 6(8), 615–620 CrossRef CAS PubMed.
- M. J. Plevin, D. L. Bryce and J. Boisbouvier, Nat. Chem., 2010, 2(6), 466–471 CrossRef CAS PubMed.
- D. R. Lovley and E. J. Phillips, Geomicrobiol. J., 1988a, 6(3–4), 145–155 Search PubMed.
- D. R. Lovley and E. J. Phillips, Appl. Environ. Microbiol., 1988b, 54(6), 1472–1480 Search PubMed.
- R. K. Aziz, D. Bartels, A. A. Best, M. deJongh, T. Disz, R. A. Edwards, K. Formsma, S. Gerdes, E. M. Glass and M. Kubal, BMC Genomics, 2008, 9(1), 75 CrossRef PubMed.
- K. Tamura, D. Peterson, N. Peterson, G. Stecher, M. Nei and S. Kumar, Mol. Biol. Evol., 2011, 28(10), 2731–2739 CrossRef CAS PubMed.
Footnote |
| † Electronic supplementary information (ESI) available. See DOI: 10.1039/c5ra08742b |
| This journal is © The Royal Society of Chemistry 2015 |


