Stability-indicating chromatographic determination of hydroquinone in combination with tretinoin and fluocinolone acetonide in pharmaceutical formulations with a photodegradation kinetic study†
Samah S. Abbasa,
Mohamed R. Elghobashya,
Lories I. Bebawyb and
Rafeek F. Shokry*b
aAnalytical Chemistry Department, Faculty of Pharmacy, Cairo University, Kasr El-Aini St., 11562 Cairo, Egypt
bNational Organization for Drug Control and Research (NODCAR), 51 Wezaret El-Zeraa St. Dokki, Cairo, Egypt. E-mail: pharmakita.drug@yahoo.com
First published on 7th May 2015
Abstract
Two sensitive and selective stability-indicating methods were developed for simultaneous determination of the active pharmaceutical ingredient hydroquinone in combination with tretinoin and fluocinolone acetonide in their pure forms and within the pharmaceutical formulation. Method A was based on a gradient elution liquid chromatographic (HPLC) determination of the active ingredients, their degradation products (hydroquinone polymer, 1,4-benzoquinone, isotretinoin and fluocinolone acetonide photodegradation) and in the presence of the preservatives methyl and propyl parabens found in pharmaceutical formulations. Method B was a thin layer chromatography (TLC)-densitometry method using a chiral developing system for the separation and determination of the active ingredients, isotretinoin, the preservatives and 1,4-benzoquinone. The molecular weight of the hydroquinone polymer formed from its alkali degradation was characterized by gel permeation chromatography. The mechanism of fluocinolone acetonide photodegradation in acetonitrile at 254 nm was studied using single crystal X-ray diffraction. The degradation products, hydroquinone polymer and isotretinoin, were found in one batch of the pharmaceutical formulation analyzed near its expiry date. The proposed HPLC method was also used for a comparative kinetic study of the photodegradation of the active ingredients. Hydroquinone showed reversible zero order kinetics, tretinoin and fluocinolone acetonide followed complex kinetic reactions in acetonitrile within two hours. The results obtained were statistically analyzed and compared with those obtained by applying the manufacturers method.
1. Introduction
The combination of hydroquinone (HQ), tretinoin (TRT) and fluocinolone acetonide (FLA) is used as an external cream for the treatment of melasma. The chemical name of HQ is benzene-1,4-diol1 and it works by blocking the synthesis of melanin via the inhibition of tyrosinase.2 Tretinoin (all-trans retinoic acid) in this combination accelerates cell turnover. Fluocinolone acetonide chemically known as 6α,9α-difluoro-11β,16α,17,21-tetrahydroxy-pregna-1,4-diene-3,20-dione cyclic-16,17-acetal with acetone1 reduces the irritation and inflammation of the combined drugs.2 Two HPLC methods were reported for the determination of HQ in combination with TRT and FLA.3,4 Many HPLC methods were published for studying the stability of TRT or FLA in single forms.5–14 Kinetic studies were performed on tretinoin photodegradation.6,9 A high performance thin layer chromatographic method was reported as a stability indicating determination of single HQ in pharmaceutical formulations.15The scientific novelty of this work was developing and validating simple, rapid and sensitive stability indicating HPLC and TLC-densitometric methods as there were no stability indicating methods reported for the simultaneous determination of this mixture in presence of their degradation products, in raw materials and pharmaceutical formulation. The alkali degradation pathway of hydroquinone by sodium carbonate was studied. The molecular weight of the formed polymer, which was not calculated before, was characterized by gel permeation chromatography. This work studied the mechanism of the photodegradation of FLA in acetonitrile at 254 nm. The degradation product structure was elucidated using single crystal X-ray diffraction.† A chiral developing system was used in the proposed TLC-densitometric method for separation and quantitation of TRT and its isomer isotretinoin (ISO) simultaneously with the other compounds that were not reported before. The HPLC method was also used to perform a comparative kinetic study on the active ingredients photodegradation. The kinetic study was performed because the drugs are very susceptible to degradation, so the rate, the order of their degradation and the formation of the degradation products was important to be studied. The HQ degradation product, 1,4-benzoquinone (BQ), is very toxic and if it is present in the pharmaceutical formulation, it will be absorbed through skin. The degradation products of HQ and TRT were found in one batch of the pharmaceutical formulation analyzed near its expiry date.
2. Experimental
2.1. Instruments
HPLC Agilent model 1260 was equipped with a quaternary pump, Rheodyne injector with a 20 μL loop and UV detector (California, USA). Separation and quantitation were made on column Agilent Eclipse plus C18, 100 × 4.6 mm, 3.5 μm particle size.TLC aluminum sheets, 20 × 20 cm precoated with silica gel F254, 0.25 mm thickness, Merck (Darmstadt, Germany) were used. The samples were applied to the plate using 25 μL Hamilton Analytical Syringe. CAMAG dual wavelength flying spot densitometer was used (Muttenz, Switzerland). The measuring mode was absorbance, slit dimensions: 4 × 0.3 mm. Scanning speed: 20 mm s−1. Data resolution: 100 μm per step. Optimize optical system for maximum: light. Band width: 20 mm. The peak area under curve was integrated.
UVC (G8T5) lamp 8 Watt ozone-free was used. Its irradiance was 24.0 μW cm−2 (GE Lighting, Japan).
The pH meter used was Jenway 3510 (Essex, UK).
For gel permeation chromatography, HPLC Agilent model 1100 was equipped with a quaternary pump and refractive index detector (California, USA). Separation was made on column PL aquagel–OH 7.5 mm, 30 μm pore type, 8 μm particle size.
Single Crystal Diffractometer, Bruker-Nonius KappaCCD, equipped with a charge-coupled device (CCD) detector and a liquid-nitrogen low-temperature device, on a Bruker-Nonius FR590 X-ray generator with a molybdenum sealed tube. The CCD detector allows many diffraction spots to be collected simultaneously.
2.2. Materials and chemicals
2.3. Degraded samples
The degradation products were tested for complete degradation by the proposed HPLC and TLC methods.
The solution of FLA photodegradation was applied in bands to the TLC plates using the described TLC method. The band at Rf 0.2 was scratched, dissolved in acetonitrile, filtered and evaporated to dryness at room temperature. Colorless needle crystals were formed representing the FLA photodegradation product. It was identified by single crystal X-ray diffraction.
2.4. Standard solutions
All standard solutions must be freshly prepared and protected from light.![[thin space (1/6-em)]](https://www.rsc.org/images/entities/char_2009.gif) :
:![[thin space (1/6-em)]](https://www.rsc.org/images/entities/char_2009.gif) water 50
water 50![[thin space (1/6-em)]](https://www.rsc.org/images/entities/char_2009.gif) :
:![[thin space (1/6-em)]](https://www.rsc.org/images/entities/char_2009.gif) 50, v/v). Stock standard solutions of TRT and ISO (100.0 μg mL−1 of each) were prepared in acetonitrile.
50, v/v). Stock standard solutions of TRT and ISO (100.0 μg mL−1 of each) were prepared in acetonitrile.Working standard solutions of HQ polymer (140.0 μg mL−1), BQ (10.0 μg mL−1) and ISO (20.0 μg mL−1) were prepared in solvent mixture.
For TLC-densitometric method, aliquots of HQ, TRT, FLA, were accurately transferred into series of 10 mL volumetric flasks then ISO and the preservatives were added to prepare different mixtures. The volume was completed by acetonitrile.
2.5. Chromatographic conditions
![[thin space (1/6-em)]](https://www.rsc.org/images/entities/char_2009.gif) :
:![[thin space (1/6-em)]](https://www.rsc.org/images/entities/char_2009.gif) 35, v/v and 40
35, v/v and 40![[thin space (1/6-em)]](https://www.rsc.org/images/entities/char_2009.gif) :
:![[thin space (1/6-em)]](https://www.rsc.org/images/entities/char_2009.gif) 60, v/v, respectively. The buffer was a mixture of 0.04 M sodium dihydrogen phosphate dihydrate and 0.01 M disodium hydrogen phosphate dihydrate (pH 6.1 ± 0.1). The elution was performed using 100% of mobile phase A for 7.00 min then 100% of mobile phase B from 7.01 min to 20.00 min. The mobile phase was filtered using 0.45 μm nylon disposable filter (Millipore, Milford, MA) and degassed by ultrasonic vibrations prior to use. The samples were also filtered using 0.45 μm disposable filters. The flow rate of the mobile phase was 1.0 mL min−1. A volume of 20 μL of each sample solution was injected. The wavelength was changed in the run as follows:
60, v/v, respectively. The buffer was a mixture of 0.04 M sodium dihydrogen phosphate dihydrate and 0.01 M disodium hydrogen phosphate dihydrate (pH 6.1 ± 0.1). The elution was performed using 100% of mobile phase A for 7.00 min then 100% of mobile phase B from 7.01 min to 20.00 min. The mobile phase was filtered using 0.45 μm nylon disposable filter (Millipore, Milford, MA) and degassed by ultrasonic vibrations prior to use. The samples were also filtered using 0.45 μm disposable filters. The flow rate of the mobile phase was 1.0 mL min−1. A volume of 20 μL of each sample solution was injected. The wavelength was changed in the run as follows:
| Time in minutes | Wavelength (nm) |
|---|---|
| 0.00 | 365 |
| 1.05 | 315 |
| 1.60 | 235 |
| 8.40 | 365 |
| 8.75 | 235 |
| 12.00 | 365 |
![[thin space (1/6-em)]](https://www.rsc.org/images/entities/char_2009.gif) :
:![[thin space (1/6-em)]](https://www.rsc.org/images/entities/char_2009.gif) 20
20![[thin space (1/6-em)]](https://www.rsc.org/images/entities/char_2009.gif) :
:![[thin space (1/6-em)]](https://www.rsc.org/images/entities/char_2009.gif) 5.6
5.6![[thin space (1/6-em)]](https://www.rsc.org/images/entities/char_2009.gif) :
:![[thin space (1/6-em)]](https://www.rsc.org/images/entities/char_2009.gif) 4
4![[thin space (1/6-em)]](https://www.rsc.org/images/entities/char_2009.gif) :
:![[thin space (1/6-em)]](https://www.rsc.org/images/entities/char_2009.gif) 0.4 by volume) as a developing system to distance of 12 ± 0.5 cm. The plate was air dried at room temperature, detected under UV lamp and scanned at 235 nm (for HQ, FLA, BQ, MET and PRP) and 365 nm (for TRT and ISO), respectively, as under the described instrumental parameters.
0.4 by volume) as a developing system to distance of 12 ± 0.5 cm. The plate was air dried at room temperature, detected under UV lamp and scanned at 235 nm (for HQ, FLA, BQ, MET and PRP) and 365 nm (for TRT and ISO), respectively, as under the described instrumental parameters.3. Procedures
3.1. Construction of calibration curves
3.2. Application to pharmaceutical formulation
For determination of FLA: into a 25 mL beaker, an amount of 6.0 g cream was accurately weighed and dissolved in about 8 mL dichloromethane with aid of stirring and ultrasound for 1 minute. The solution was transferred into a 10 mL volumetric flask and the volume was completed with dichloromethane. Then, the procedure was followed as under HPLC method and construction of calibration curves.
3.3. Kinetic study of the photodegradation of hydroquinone, tretinoin and fluocinolone acetonide
4. Results and discussion
It is important to study the stability and determine the photosensitive drugs HQ, TRT and FLA in a mixture applied topically to the skin. Hydroquinone concentration was high in this formula and its degradation product 1,4 benzoquinone formed is irritant and can be absorbed through skin. It is very toxic and possible carcinogen.16The reported HPLC methods3,4 determined HQ, TRT and FLA not in presence of their degradation products and preservatives. The manufacturer HPLC method determined HQ, FLA and the preservatives MET and PRP in one run but another HPLC method was used for determining TRT. The reported methods on FLA10–12 did not mention its photodegradation pathway.
Hydroquinone was subjected to alkali, acid hydrolysis, oxidation and UV light as it was formulated in higher concentration compared to TRT and FLA in ratio of 400![[thin space (1/6-em)]](https://www.rsc.org/images/entities/char_2009.gif) :
:![[thin space (1/6-em)]](https://www.rsc.org/images/entities/char_2009.gif) 5
5![[thin space (1/6-em)]](https://www.rsc.org/images/entities/char_2009.gif) :
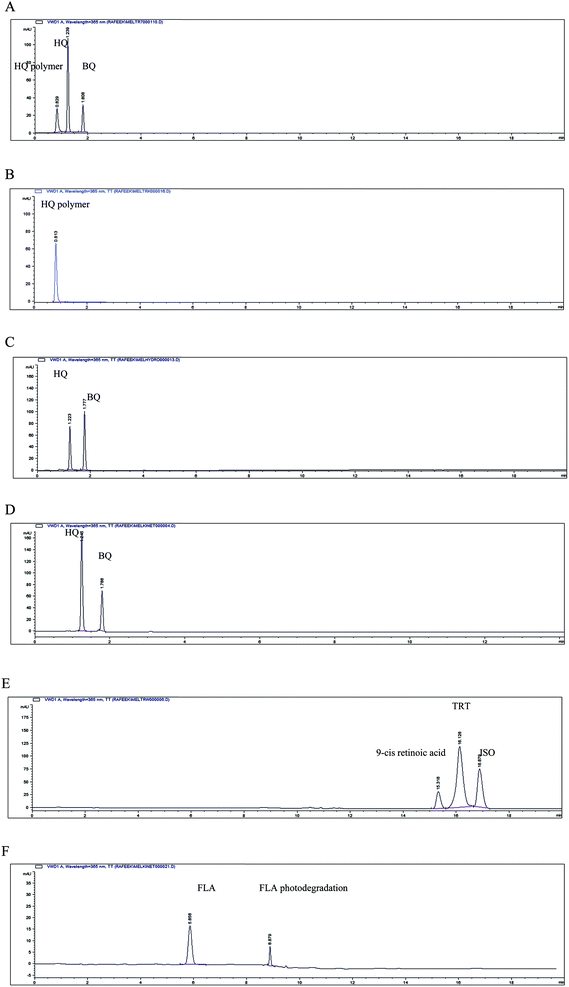
:![[thin space (1/6-em)]](https://www.rsc.org/images/entities/char_2009.gif) 1. Hydroquinone and BQ were separated by the proposed HPLC method at retention times 1.21 and 1.76 min, respectively. The alkali solution of HQ was turned dark by time. After one day, the HQ alkali solution showed three peaks by the proposed HPLC method corresponding to HQ, BQ and another peak at retention time 0.84 min, Fig. 1A. The HQ alkali solution showed complete degradation after ten days, confirmed by the proposed HPLC method, showing only one peak at retention time 0.84 min and disappearance of the peaks corresponding to HQ and BQ as shown in Fig. 1B. The complete alkali degradation of HQ was also confirmed by the proposed TLC method (dissolved in water and acetonitrile mixture 50
1. Hydroquinone and BQ were separated by the proposed HPLC method at retention times 1.21 and 1.76 min, respectively. The alkali solution of HQ was turned dark by time. After one day, the HQ alkali solution showed three peaks by the proposed HPLC method corresponding to HQ, BQ and another peak at retention time 0.84 min, Fig. 1A. The HQ alkali solution showed complete degradation after ten days, confirmed by the proposed HPLC method, showing only one peak at retention time 0.84 min and disappearance of the peaks corresponding to HQ and BQ as shown in Fig. 1B. The complete alkali degradation of HQ was also confirmed by the proposed TLC method (dissolved in water and acetonitrile mixture 50![[thin space (1/6-em)]](https://www.rsc.org/images/entities/char_2009.gif) :
:![[thin space (1/6-em)]](https://www.rsc.org/images/entities/char_2009.gif) 50, v/v) showing one brown spot at the starting line, while no spot was observed at Rf 0.20 or 0.65 corresponding to the intact drug and BQ. The alkali degradation product residue formed was dark brown colored and soluble in mixture of water and acetonitrile. Hydroquinone can easily undergo oxidative polymerization in alkali solution but the reaction product molecular weight was not identified.17–21
50, v/v) showing one brown spot at the starting line, while no spot was observed at Rf 0.20 or 0.65 corresponding to the intact drug and BQ. The alkali degradation product residue formed was dark brown colored and soluble in mixture of water and acetonitrile. Hydroquinone can easily undergo oxidative polymerization in alkali solution but the reaction product molecular weight was not identified.17–21
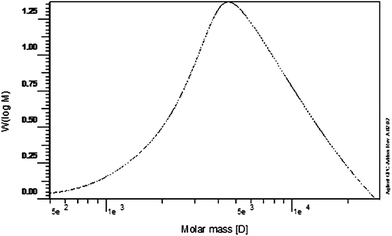
Gel permeation chromatography was used for this polymer characterization.22 The molecular mass of a polymer differs from typical molecules, in that polymerization reactions produce a distribution of molecular weights and shapes. The distribution of molecular masses can be summarized by the number average molecular weight, weight average molecular weight, and polydispersity.23 Fig. 2 showed the number average molecular weight (Mn) to be 3637 and the weight average molecular weight (Mw) was 6170.1. The distribution of molecular weights in a polymer sample is the polydispersity index, which found to be 1.7. Hydroquinone was stable in acidic medium. It showed incomplete degradation upon oxidation and photodegradation resulting in formation of BQ, Fig. 1C and D. The formed BQ was confirmed by comparing it with pure BQ solution using the proposed HPLC and TLC methods separating it at retention time 1.76 min and Rf 0.65, respectively.
The photodegradation of TRT showed two degradation products which were separated and confirmed by the proposed HPLC method as shown in Fig. 1E. The first degradation product was isotretinoin (13-cis retinoic acid) separated at retention time 16.96 min which is the same retention time of pure ISO injected using the proposed HPLC method. The second degradation product was eluted at retention time 15.50 min which may be 9-cis retinoic acid.5–8
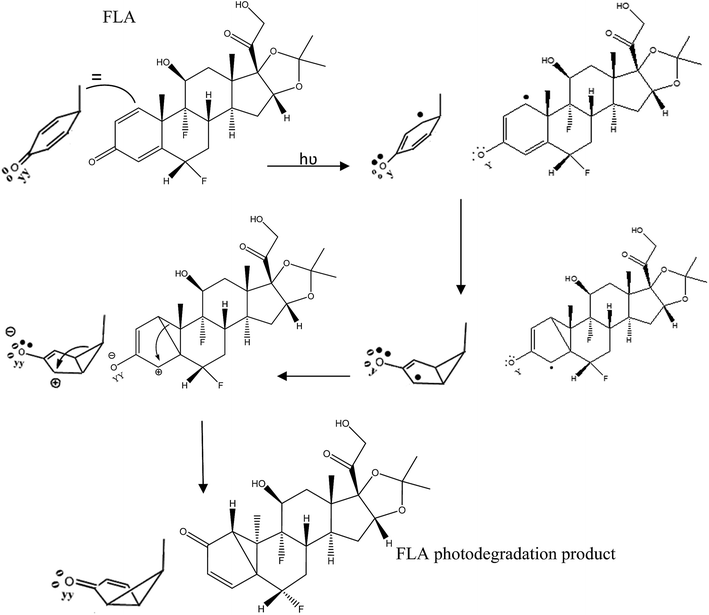
Fluocinolone acetonide was subjected to photodegradation at 254 nm in acetonitrile showing one degradation product. This drug was sensitive to light and its degradation pathway was affected by the wavelength and the solvent used. In the reported studies13,14 the photodegradation pathways differ when using wavelengths 365 and 312 nm. The degradation product of FLA was separated at retention time 8.89 min and Rf 0.20 by the proposed HPLC and TLC methods, respectively. This FLA degradation product is colorless needle crystals could be easily identified by single crystal X-ray diffraction. The product showed chemical formula C24H30F2O6 the same as the intact drug and its structure was shown in Fig. 3. The X-ray analysis established the structure and relative stereochemistry of FLA degradation product that its absolute structure could then be inferred from the known stereochemistry of the intact FLA.24 The mechanism of this product formation was a kind of a photochemical reaction similar to santonin lumisantonin rearrangement25,26 and the photodegradation of triamcinolone acetonide.27 The C-30 carbonyl group was moved to C-19 and the C-7 carbon was inverted. The suggested IUPAC nomenclature of this new compound was (2S,5aS,5bR,5cR,6S,7aS,7bS,10aR,11aS,11bS)-2,5c-difluoro-6-hydroxy-7b-(2-hydroxyacetyl)-5b,7a,9,9-tetramethyl-1,5a,5b,5c,6,7,7a,7b,10a,11,11a,11b-dodecahydrocyclopenta[2′′,3′′]cyclopropa-[1′′,2′′:3′,4′]-benzo-[1′,2′:4,5]-indeno-[1,2-d]-[1,3]-dioxol-5(2H)-one. As shown in Fig. 4, a beta–beta bond is formed. Subsequent to this, radiationless decay was found lead to a zwitterion ground state.28
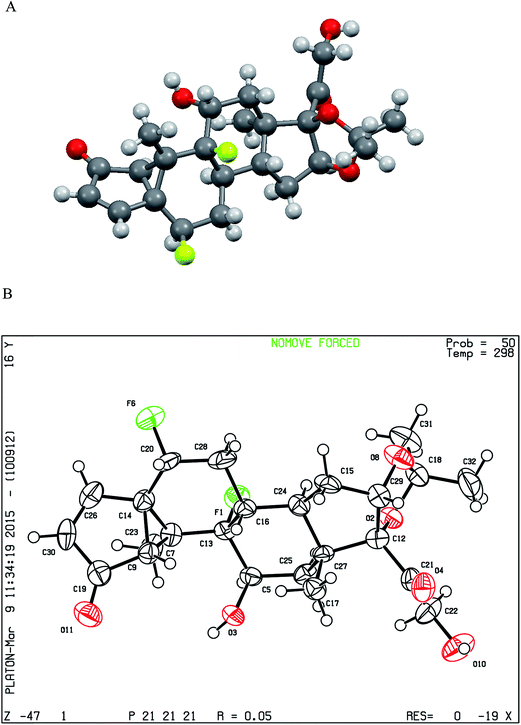 | ||
| Fig. 3 (A) Molecular structure of flucinolone acetonide photodegradation product (that crystallized from acetonitrile) in Mercury® software determined by X-ray diffraction showing hydrogen atoms. (B) Oak Ridge Thermal Ellipsoid Plot (ORTEP) of flucinolone acetonide photodegradation product determined by X-ray diffraction.† Crystal data: C24H30F2O6, M = 452.494, orthorhombic, space group P212121, a = 9.1420 (3)Å, b = 11.9074 (4)Å, c = 20.3303 (10)Å, V = 2213.1 (2)Å3, Z = 4, Dx = 1.358 Mg m−3, density measured by: not measured, fine-focus sealed tube, Mo Kα radiation, λ = 0.71073, μ = 0.11, T = 298 K, 3848 measured reflections, 3059 independent reflections, 815 observed reflections, Rint = 0.038. Refinement on F2: full matrix least squares refinement, R(all) = 0.180, R(gt) = 0.033, wR(ref) = 0.067, wR(all) = 0.120, wR(gt) = 0.067, S(ref) = 1.315, S(all) = 1.370, S(gt) = 1.315. Flack parameter = 0 (2). | ||
4.1. For HPLC method
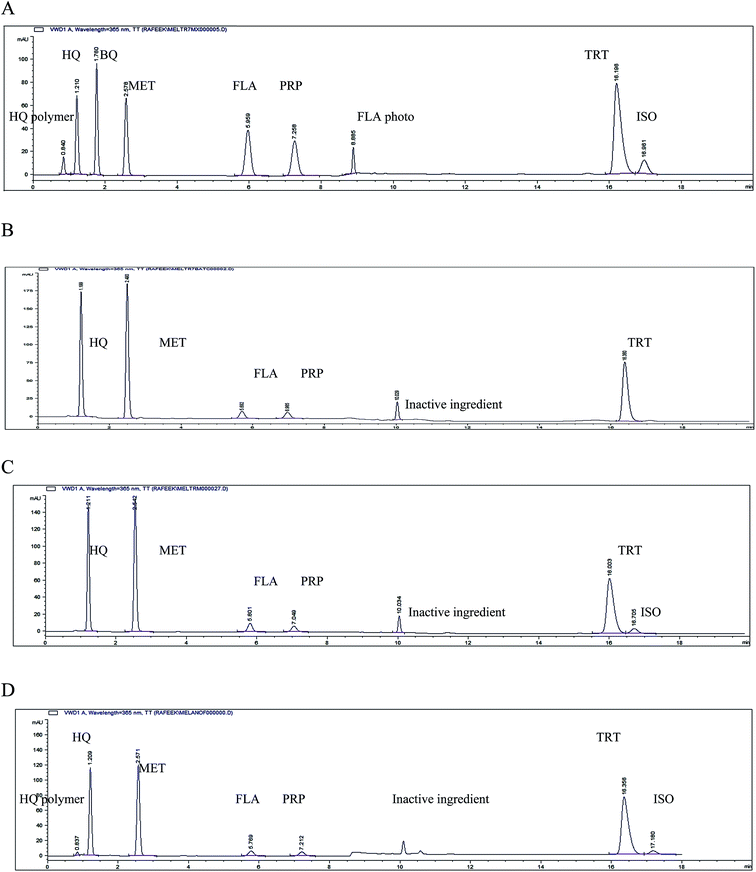
Several trials were carried out to obtain a good resolution between the selected drugs and their degradation products. These trials involved the use of different mobile phases with different ratios, different pH and wavelengths. The best resolution with sharp and symmetric peaks was obtained using the chromatographic conditions described. The retention times for the intact drugs, their degradation products and the preservatives were shown in Fig. 5.A gradient mobile phase program was developed starting with more aqueous solution and ending with more organic one because the polarity of the separated compounds varied a lot from very polar compounds (HQ) to very non polar ones (TRT and ISO). The solvent mixture of acetonitrile![[thin space (1/6-em)]](https://www.rsc.org/images/entities/char_2009.gif) :
:![[thin space (1/6-em)]](https://www.rsc.org/images/entities/char_2009.gif) water (50
water (50![[thin space (1/6-em)]](https://www.rsc.org/images/entities/char_2009.gif) :
:![[thin space (1/6-em)]](https://www.rsc.org/images/entities/char_2009.gif) 50, v/v) dissolved the selected compounds and gave best peak symmetry for HQ, MET and FLA.
50, v/v) dissolved the selected compounds and gave best peak symmetry for HQ, MET and FLA.
The pH of the mobile phase was very critical affecting the retention time of the compounds specially TRT and ISO. At pH 5.5, the retention times of TRT and ISO were delayed to 23 and 24 min, by increasing the pH to 6.8, TRT and ISO were eluted at retention time 12 min with poor separation, therefore the optimum pH was 6.1 ± 0.1.
A wavelength time table was developed for maximum detection of the selected compounds. It was started with 365 nm to detect HQ polymer as it was colored and to eliminate the noise peaks found in pharmaceutical formulation. Hydroquinone could be detected at 315 nm to give response in the same scale of the other compounds. A wavelength 235 nm was selected to determine BQ, MET, PRP, FLA photodegradation and specially FLA as it was found in small concentration and the wavelength selected was its maximum wavelength. From 8.40 till 8.75 min the detector was set at 365 to diminish the baseline noise due to changing of mobile phase. The maximum wavelength for detection of TRT and ISO was 365 nm.
System suitability parameters of the proposed HPLC method were calculated showing good resolution, selectivity and symmetrical peaks according to the USP,29 Table 1. When changing the wavelength ± 2 nm, the system suitability parameters did not change giving the same good results indicating the robustness of the proposed method.
| Parameter | Obtained value | Reference value | ||||||||
|---|---|---|---|---|---|---|---|---|---|---|
| HQ polymer | HQ | BQ | MET | FLA | PRP | FLA photo degradation | TRT | ISO | ||
| Resolution (Rs) | 3.18 | 4.71 | 6.32 | 15.82 | 4.49 | 8.12 | 30.83 | 2.07 | R > 1.5 | |
| Selectivity (α) | 1.44 | 1.45 | 1.47 | 2.31 | 1.22 | 1.22 | 1.82 | 1.05 | >1 | |
| Tailing factor (T) | 1.10 | 0.86 | 0.87 | 0.84 | 0.94 | 0.91 | 0.79 | 0.75 | 0.86 | ∼1 |
| Number of theoretical plates (N) | 959 | 1534 | 4145 | 4772 | 7377 | 9347 | 126![[thin space (1/6-em)]](https://www.rsc.org/images/entities/char_2009.gif) 045 045 |
30![[thin space (1/6-em)]](https://www.rsc.org/images/entities/char_2009.gif) 097 097 |
34![[thin space (1/6-em)]](https://www.rsc.org/images/entities/char_2009.gif) 473 473 |
Increase with efficiency of separation |
| HETP height equivalent to theoretical plate (cm per plate) | 0.01 | 6.5 × 10⁻³ | 2.4 × 10⁻³ | 2.1 × 10⁻³ | 1.4 × 10⁻³ | 1.1 × 10⁻³ | 7.9 × 10⁻⁵ | 3.3 × 10⁻⁴ | 2.9 × 10⁻⁴ | The smaller the value the higher the column efficiency |
| Retention time min ± 0.2 | 0.84 | 1.21 | 1.76 | 2.58 | 5.96 | 7.30 | 8.89 | 16.19 | 16.96 | |
4.2. For TLC-densitometric method
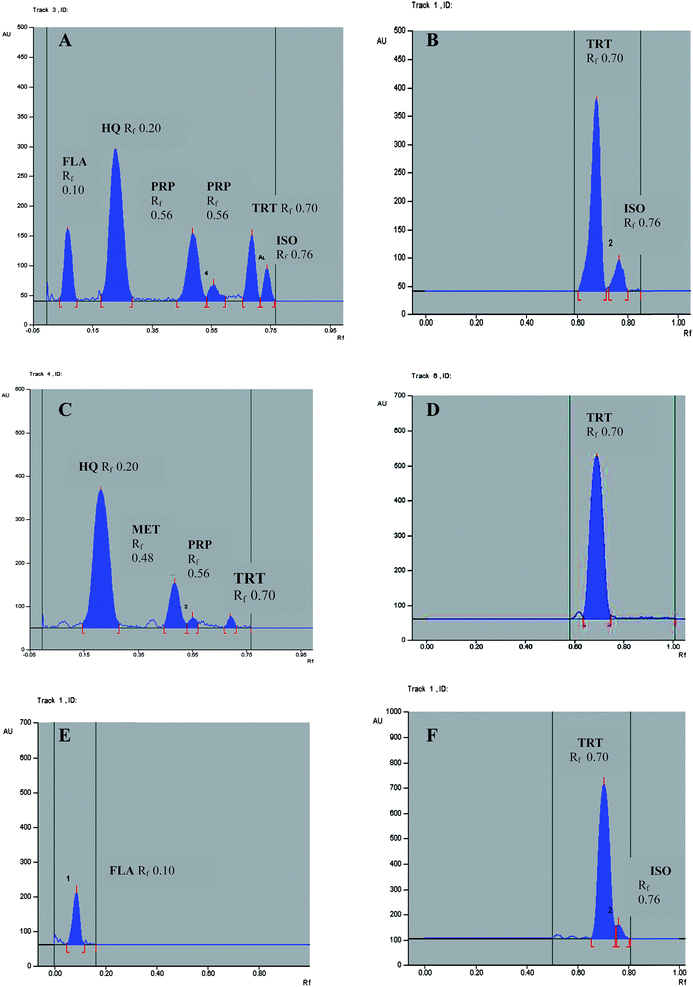
This proposed method could determine HQ, TRT, FLA, ISO, MET and PRP, Fig. 6. 1,4-Benzoquinone (BQ) could only be detected at Rf 0.65 without any determination because of its gradual sublimation30 giving non reproducible results. The HQ polymer was remained at the starting line when dissolved in a mixture of equal volumes of water and acetonitrile. The photodegradation product of FLA could only be determined if present in the raw material of FLA, Table 2. It could not be determined with the cited components in pharmaceutical formulation as it was separated at the same Rf of HQ and the concentration of the intact FLA in pharmaceutical formulation was smaller 400 times than HQ. The experimental condition for TLC-densitometric method as developing system, scan mode and wavelength of the detection were optimized to provide accurate and precise results for determination of the cited components. The wavelength of the scanning 235 nm could determine all the cited components but TRT and ISO were best detected at 365 nm for maximum sensitivity. The best separation of the studied compounds was obtained under the chromatographic conditions described.| Characteristic parameter | HQ | TRT | FLA | HQ polymer | BQ | ISO | FLA photo degradation | MET | PRP |
|---|---|---|---|---|---|---|---|---|---|
| a Standard error.b Confidence limit.c The intraday (n = 9), average of three different concentrations repeated three times within day.d The interday (n = 9), average of three different concentrations repeated three times in three successive days.e Average in the change of pH (±0.1), flow rate (±0.1 min) and ratio of mobile phase (±2%).f Limit of detection and quantitation are determined via calculations, LOD = (SD of regression residuals/slope) × 3.3; LOQ = (SD of the response/slope) × 10. | |||||||||
| Range μg mL−1 | 40.0–1000.00 | 1.00–50.00 | 1.00–20.00 | 5.60–28.00 | 0.20–2.00 | 0.20–10.00 | 2.00–20.00 | 1.00–25.00 | 1.00–20.00 |
| Linearity | |||||||||
| Slope | 0.7834 | 111.2300 | 45.1730 | 5.2489 | 398.1800 | 151.3400 | 14.1630 | 38.8230 | 35.2430 |
| Intercept | 0.5680 | 2.5182 | 0.0728 | −0.4020 | −7.1667 | 2.2774 | 1.2677 | 3.5183 | 8.2558 |
| Correlation coefficient (r) | 0.9998 | 0.9998 | 0.9999 | 0.9998 | 0.9998 | 0.9998 | 0.9996 | 0.9997 | 0.9999 |
| SE of the slopea | 0.0065 | 0.9067 | 0.1750 | 0.0422 | 3.9064 | 1.4005 | 0.1979 | 0.4839 | 0.2547 |
| CL of the slopeb | 0.7652–0.8015 | 108.7137–113.7482 | 44.6876–45.6591 | 5.1320–5.3661 | 387.3341–409.0262 | 147.4475–155.2243 | 13.6127–14.7118 | 37.4796–40.1666 | 34.5354–35.9498 |
| SE of the intercept | 3.9524 | 27.4527 | 2.1200 | 0.7707 | 4.9619 | 8.4812 | 2.5141 | 7.3279 | 3.0864 |
| CL of the intercept | −10.4041 to 11.5432 | −73.7004 to 78.7417 | −5.8149 to 5.9574 | −2.5428 to 1.7370 | −20.9428 to 6.6098 | −21.2717 to 25.8236 | −5.7082 to 8.2524 | −16.8270 to 23.8642 | −0.3122 to 16.8261 |
| Accuracy (mean ± SD) | 99.76 ± 1.16 | 100.54 ± 1.25 | 100.24 ± 1.60 | 99.47 ± 0.70 | 99.57 ± 0.44 | 100.15 ± 1.33 | 99.48 ± 0.81 | 100.36 ± 1.17 | 99.72 ± 0.96 |
| Precision (% RSD) | |||||||||
| Repeatabilityc | 0.24 | 0.44 | 1.08 | 1.26 | 0.59 | 1.45 | 0.33 | 0.88 | 1.07 |
| Intermediate precisiond | 0.90 | 1.12 | 1.59 | 1.48 | 0.63 | 1.71 | 0.97 | 0.96 | 1.16 |
| Specificity and selectivity | 100.29 ± 1.08 | 100.13 ± 1.23 | 99.23 ± 1.00 | 99.21 ± 1.28 | 99.73 ± 1.57 | 100.49 ± 1.59 | 100.09 ± 1.36 | 100.57 ± 1.15 | 99.92 ± 1.11 |
| Robustnesse | 100.80 ± 0.98 | 100.95 ± 1.30 | 100.82 ± 0.78 | 101.03 ± 1.53 | 101.45 ± 0.57 | 101.07 ± 0.95 | 100.73 ± 1.21 | 101.14 ± 0.88 | 100.90 ± 1.28 |
| LODf μg mL−1 | 5.39 | 0.20 | 0.18 | 1.16 | 0.05 | 0.04 | 0.64 | 0.22 | 0.22 |
| LOQf μg mL−1 | 16.34 | 0.59 | 0.56 | 3.52 | 0.14 | 0.13 | 1.94 | 0.67 | 0.66 |
Using β-cyclodextrin aqueous solution in a small amount (4 μg mL−1) as a chiral material in developing system enabled the separation of TRT and its isomer ISO without increasing its amount to be compatible with the rest of the developing system components. Both acetic acid and acetone had a role in separation and developing of TRT, ISO from BQ and developing FLA.
Method validation was performed according to ICH31 guidelines for the two proposed methods. Tables 2 and 3 showed results of accuracy, repeatability and intermediate precision of the methods. Robustness of the proposed methods was determined from small changes in some of conditions, as shown in Tables 2 and 3, showing small changes in recovery (98.00–102.00%) and retention time (±0.2 min) or Rf (±0.03). Characteristic parameters for the regression equations of the proposed methods were also given in Tables 2 and 3. The proposed HPLC and TLC-densitometric methods were selective and accurate for determination of the cited components in laboratory prepared mixtures, Tables 4 and 5.
| Characteristic parameter | HQ | TRT | FLA | ISO | FLA photo degradation | MET | PRP |
|---|---|---|---|---|---|---|---|
| a Standard error.b Confidence limit.c The intraday (n = 9), average of three different concentrations repeated three times within day.d The interday (n = 9), average of three different concentrations repeated three times in three successive days.e Average in the change of developing system composition ± 3.0, 2.0, 0.4, 0.2, 0.1 mL of petroleum ether–ethyl acetate–acetone–acetic acid–β-cyclodextrin solution and distance development (±0.5 cm).f Limit of detection and quantitation are determined via calculations, LOD = (SD of regression residuals/slope) × 3.3; LOQ = (SD of the response/slope) × 10. | |||||||
| Range μg per spot | 1.20–30.00 | 0.50–1.75 | 0.40–1.40 | 0.50–1.75 | 1.00–3.50 | 0.40–1.40 | 0.040–0.140 |
| Linearity | |||||||
| Slope | 650.75 | 18![[thin space (1/6-em)]](https://www.rsc.org/images/entities/char_2009.gif) 025.00 025.00 |
3996.20 | 8346.70 | 2133.40 | 5088.10 | 10![[thin space (1/6-em)]](https://www.rsc.org/images/entities/char_2009.gif) 269.00 269.00 |
| Intercept | 3691.00 | −7604.10 | 575.49 | −2780.00 | 323.56 | 2329.50 | 3339.73 |
| Correlation coefficient (r) | 0.9996 | 0.9994 | 0.9995 | 0.9996 | 0.9991 | 0.9996 | 0.9996 |
| SE of the slopea | 9.2614 | 269.1465 | 61.5205 | 111.6972 | 44.1816 | 72.9537 | 135.5337 |
| CL of the slopeb | 625.0320–676.4597 | −8498.66 to −6700.29 | 3825.3931–4167.0098 | 8036.5396–8656.7816 | 2010.7665–2256.1020 | 4885.5470–5290.6510 | 9892.7981–10![[thin space (1/6-em)]](https://www.rsc.org/images/entities/char_2009.gif) 645.4019 645.4019 |
| SE of the intercept | 168.3032 | 323.8624 | 59.2218 | 134.4045 | 106.3269 | 70.2278 | 13.0470 |
| CL of the intercept | 3223.7120–4158.2811 | 17![[thin space (1/6-em)]](https://www.rsc.org/images/entities/char_2009.gif) 291.62–18 291.62–18![[thin space (1/6-em)]](https://www.rsc.org/images/entities/char_2009.gif) 786.16 786.16 |
411.0642–739.9165 | −3153.1599 to −2406.8264 | 28.3454–618.7670 | 2134.506–2524.473 | 303.5019–375.9501 |
| Accuracy (mean ± SD) | 99.70 ± 1.23 | 101.17 ± 0.53 | 99.32 ± 1.09 | 100.54 ± 1.45 | 100.67 ± 1.27 | 99.86 ± 1.54 | 100.82 ± 1.47 |
| Precision (% RSD) | |||||||
| Repeatabilityc | 0.79 | 0.36 | 0.51 | 1.63 | 1.74 | 1.12 | 1.71 |
| Intermediate precisiond | 1.32 | 0.75 | 1.14 | 1.76 | 1.91 | 1.42 | 1.75 |
| Specificity and selectivity | 100.90 ± 0.52 | 101.15 ± 1.13 | 99.80 ± 1.16 | 100.40 ± 1.80 | — | 100.51 ± 1.32 | 99.72 ± 1.33 |
| Robustnesse | 100.63 ± 0.88 | 100.85 ± 0.81 | 100.13 ± 0.89 | 101.17 ± 0.85 | 101.01 ± 0.63 | 100.83 ± 0.88 | 100.42 ± 1.03 |
| LODf μg per spot | 0.24 | 0.05 | 0.12 | 0.04 | 0.13 | 0.04 | 0.003 |
| LOQf μg per spot | 0.72 | 0.14 | 0.04 | 0.13 | 0.39 | 0.11 | 0.010 |
| Mixture number | HQ | TRT | FLA | HQ polymer | BQ | ISO | FLA photo degradation | MET | PRP | |
|---|---|---|---|---|---|---|---|---|---|---|
| a Ratio of HQ, TRT, FLA, MET and PRP in pharmaceutical formulation.b Average of 3 determinations. | ||||||||||
| 1a | Concentration (μg mL−1) | 800.00 | 10.00 | 2.00 | 14.00 | 0.50 | 2.00 | 10.00 | 20.00 | 2.00 |
| Recoveryb % | 100.81 | 101.19 | 100.27 | 98.07 | 98.20 | 102.00 | 101.72 | 99.36 | 100.37 | |
| % of the degradation products | — | — | — | 1.72 | 0.06 | 20.00 | 83.33 | — | — | |
| 2a | Concentration (μg mL−1) | 800.00 | 10.00 | 2.00 | 5.60 | 0.20 | 0.20 | 2.00 | 20.00 | 2.00 |
| Recoveryb % | 98.84 | 100.32 | 99.17 | 100.03 | 101.50 | 98.20 | 101.43 | 99.44 | 99.89 | |
| % of the degradation products | — | — | — | 0.70 | 0.02 | 19.61 | 50.00 | — | — | |
| 3 | Concentration (μg mL−1) | 400.00 | 10.00 | 10.00 | 14.00 | 1.00 | 1.00 | 10.00 | 10.00 | 10.00 |
| Recoveryb % | 101.72 | 101.33 | 98.35 | 98.07 | 101.34 | 102.01 | 99.13 | 101.18 | 98.39 | |
| % of the degradation products | — | — | — | 3.38 | 0.25 | 9.09 | 50.00 | — | — | |
| 4 | Concentration (μg mL−1) | 1000.00 | 20.00 | 20.00 | 5.60 | 0.20 | 0.20 | 2.00 | 10.00 | 1.00 |
| Recoveryb % | 100.30 | 99.37 | 98.17 | 98.89 | 98.99 | 100.40 | 99.08 | 102.04 | 99.53 | |
| % of the degradation products | — | — | — | 0.56 | 0.02 | 0.99 | 9.09 | — | — | |
| 5 | Concentration (μg mL−1) | 40.00 | 50.00 | 1.00 | 28.00 | 2.00 | 0.20 | 2.00 | 1.00 | 1.00 |
| Recoveryb % | 99.77 | 98.43 | 100.19 | 100.97 | 98.64 | 99.85 | 99.08 | 100.84 | 101.42 | |
| % of the degradation products | — | — | — | 41.18 | 4.76 | 0.40 | — | — | ||
| Mean ± SD | 100.29 ± 1.08 | 100.13 ± 1.23 | 99.23 ± 0.99 | 99.21 ± 1.27 | 99.73 ± 1.57 | 100.49 ± 1.60 | 100.09 ± 1.36 | 100.57 ± 1.16 | 99.92 ± 1.11 | |
| Mixture number | HQ | TRT | FLA | ISO | MET | PRP | |
|---|---|---|---|---|---|---|---|
| a Ratio of HQ, MET and PRP in pharmaceutical formulation.b Average of 3 determinations. | |||||||
| 1 | Concentration (μg per spot) | 12.00 | 1.50 | 0.60 | 1.25 | 0.40 | 0.060 |
| Recoveryb % | 101.68 | 99.37 | 101.30 | 99.39 | 98.80 | 100.21 | |
| % of the degradation products | — | — | — | 45.45 | — | — | |
| 2 | Concentration (μg per spot) | 9.00 | 1.75 | 1.20 | 0.50 | 1.20 | 0.120 |
| Recoveryb % | 100.44 | 100.65 | 100.68 | 102.56 | 99.78 | 98.11 | |
| % of the degradation products | — | — | — | 22.22 | — | — | |
| 3 | Concentration (μg per spot) | 1.20 | 0.50 | 1.00 | 1.75 | 1.00 | 0.100 |
| Recoveryb % | 100.61 | 101.74 | 99.32 | 98.45 | 101.90 | 98.64 | |
| % of the degradation products | — | — | — | 77.78 | — | — | |
| 4a | Concentration (μg per spot) | 24.00 | 0.50 | 0.40 | 0.50 | 0.60 | 0.060 |
| Recoveryb % | 100.58 | 101.98 | 98.42 | 102.08 | 101.77 | 101.37 | |
| % of the degradation products | — | — | — | 50.00 | — | — | |
| 5 | Concentration (μg per spot) | 30.00 | 0.50 | 0.50 | 0.75 | 0.80 | 0.050 |
| Recoveryb % | 101.18 | 101.99 | 99.29 | 99.52 | 100.28 | 100.29 | |
| % of the degradation products | — | — | — | 60.00 | — | — | |
| Mean ± SD | 100.90 ± 0.52 | 101.15 ± 1.14 | 99.80 ± 1.16 | 100.40 ± 1.81 | 100.51 ± 1.33 | 99.72 ± 1.33 | |
The suggested methods were valid and applicable for the analysis of HQ, TRT, FLA, MET and PRP in their pharmaceutical formulation Melanofree® cream, Tables 6 and 7. The limit of ISO in TRT must not exceed 5.0% as stated in USP.29 Isotretinoin was present above the limit in pharmaceutical formulation batch no. 130054 near the expiry date; its amount was determined by the proposed HPLC method to be 5.3%, Fig. 5C, and could be detected by the proposed TLC-densitometric method, Fig. 6F. Also, in this batch brown spots were found due to excessive opening of the cream tube detecting HQ polymer by the proposed HPLC method, Fig. 5D.
| Parameter | Hydroquinone | Tretinoin | Fluocinolone acetonide | Methyl paraben | Propyl paraben | |||||
|---|---|---|---|---|---|---|---|---|---|---|
| HPLC method | Manufacturer methodd | HPLC method | Manufacturer methode | HPLC method | Manufacturer methodd | HPLC method | Manufacturer methodd | HPLC method | Manufacturer methodd | |
| a Standard deviation and percentage relative standard deviation for 5 determinations.b Labelled to contain 4% hydroquinone, 0.05% tretinoin, 0.01% fluocinolone acetonide, 0.1% methyl paraben and 0.01% propyl paraben batch no: 140078.c Tabulated values for t and F at P = 0.05 and n = 5.d Manufacturer HPLC method using ODS 250 × 4.6 mm, 5 μm column, mobile phase mixture of 320 mL acetonitrile and 680 mL 1.8 g sodium heptanes sulfonate in water pH 3.5 by phosphoric acid, flow rate 1.2 mL min−1 and detection at 254 nm.e Manufacturer HPLC method using ODS 250 × 4.6 mm, 5 μm column, mobile phase mixture of 800 mL acetonitrile and 200 mL 0.5% acetic acid in water, flow rate 1.5 mL min−1 and detection at 360 nm. | ||||||||||
| Mean ± SDa of Melanofree®b | 100.76 ± 1.26 | 100.23 ± 1.04 | 96.46 ± 1.23 | 96.47 ± 1.23 | 99.54 ± 1.75 | 99.54 ± 1.65 | 104.33 ± 1.11 | 105.35 ± 0.83 | 90.15 ± 1.18 | 90.80 ± 1.55 |
| RSDa | 1.25 | 1.04 | 1.28 | 1.28 | 1.76 | 1.66 | 1.06 | 0.79 | 1.31 | 1.71 |
| Variance | 1.59 | 1.08 | 1.51 | 1.51 | 3.06 | 2.72 | 1.23 | 0.69 | 1.39 | 2.40 |
| Student's t-test (2.306)c | 0.726 | 0.013 | 0.000 | 1.647 | 0.747 | |||||
| F-value (6.39)c | 1.47 | 1.00 | 1.13 | 1.34 | 1.73 | |||||
| Standard addition technique | 100.58 ± 1.78 | 100.98 ± 0.68 | 99.87 ± 1.00 | 101.67 ± 0.30 | 100.31 ± 1.76 | |||||
| Parameter | Hydroquinone | Tretinoin | Fluocinolone acetonide | Methyl paraben | Propyl paraben | |||||
|---|---|---|---|---|---|---|---|---|---|---|
| TLC-densitometric method | Manufacturer methodd | TLC-densitometric method | Manufacturer methode | TLC-densitometric method | Manufacturer methodd | TLC-densitometric method | Manufacturer methodd | TLC-densitometric method | Manufacturer methodd | |
| a Standard deviation and percentage relative standard deviation for 5 determinations.b Labelled to contain 4% hydroquinone, 0.05% trtinoin, 0.01% fluocinolone acetonide, 0.1% methyl paraben and 0.01% propyl paraben batch no: 140078.c Tabulated values for t and F at P = 0.05 and n = 5.d Manufacturer HPLC method using ODS 250 × 4.6 mm, 5 μm column, mobile phase mixture of 320 mL acetonitrile and 680 mL 1.8 g sodium heptanes sulfonate in water pH 3.5 by phosphoric acid, flow rate 1.2 mL min−1 and detection at 254 nm.e Manufacturer HPLC method using ODS 250 × 4.6 mm, 5 μm column, mobile phase mixture of 800 mL acetonitrile and 200 mL 0.5% acetic acid in water, flow rate 1.5 mL min−1 and detection at 360 nm. | ||||||||||
| Mean ± SDa of Melanofree®b | 99.10 ± 0.90 | 100.23 ± 1.04 | 95.83 ± 1.01 | 96.47 ± 1.23 | 98.23 ± 1.41 | 99.54 ± 1.65 | 104.53 ± 1.05 | 105.35 ± 0.83 | 91.06 ± 1.50 | 90.80 ± 1.55 |
| RSDa | 0.91 | 1.04 | 1.05 | 1.28 | 1.44 | 1.66 | 1.00 | 0.79 | 1.65 | 1.71 |
| Variance | 0.81 | 1.08 | 1.02 | 1.51 | 1.99 | 2.72 | 1.10 | 0.69 | 2.25 | 2.40 |
| Student's t-test (2.306)c | 1.839 | 0.900 | 1.351 | 1.371 | 0.270 | |||||
| F-value (6.39)c | 1.33 | 1.48 | 1.37 | 1.59 | 1.07 | |||||
| Standard addition technique | 98.91 ± 0.87 | 100.78 ± 0.68 | 99.03 ± 0.88 | 99.03 ± 1.99 | 100.97 ± 0.86 | |||||
The validity of the proposed methods was assessed by applying the standard addition technique, which showed accurate results and there is no interference from excipients as shown in Tables 6 and 7. Butylated hydroxyltoluene, one of the inactive ingredients, was separated at retention time 10 min and at the front line by the proposed HPLC and TLC-densitometric methods. This was confirmed by applying pure butylated hydroxyltoluene.
Statistical comparison of the results of the compounds analysis obtained by the proposed methods and the manufacturer one was also done using student's t-test and the F-ratio at 95% confidence level (Tables 8 and 9). It was clear that there is no significant difference between the proposed and the manufacturer methods with regard to accuracy and precision. The proposed HPLC method had advantages of being more sensitive, stability indicating for simultaneous determination of the cited drugs and faster elution than the reported one.4
| Parameter | Hydroquinone | Tretinoin | Fluocinolone acetonide | Methyl paraben | Propyl paraben | |||||
|---|---|---|---|---|---|---|---|---|---|---|
| HPLC method | Manufacturer methodc | HPLC method | Manufacturer methodd | HPLC method | Manufacturer methodc | HPLC method | Manufacturer methodc | HPLC method | Manufacturer methodc | |
| a Standard deviation and percentage relative standard deviation for 5 determinations.b Tabulated values for t and F at P = 0.05.c Manufacturer HPLC method using ODS 250 × 4.6 mm, 5 μm column, mobile phase mixture of 320 mL acetonitrile and 680 mL 1.8 g sodium heptanes sulfonate in water pH 3.5 by phosphoric acid, flow rate 1.2 mL min−1 and detection at 254 nm.d Manufacturer HPLC method using ODS 250 × 4.6 mm, 5 μm column, mobile phase mixture of 800 mL acetonitrile and 200 mL 0.5% acetic acid in water, flow rate 1.5 mL min−1 and detection at 360 nm. | ||||||||||
| Mean ± SDa | 99.76 ± 1.16 | 99.74 ± 1.15 | 100.54 ± 1.25 | 100.03 ± 1.26 | 100.24 ± 1.60 | 99.95 ± 1.59 | 100.36 ± 1.17 | 100.00 ± 1.13 | 99.72 ± 0.96 | 99.94 ± 1.23 |
| RSDa | 1.16 | 1.15 | 1.24 | 1.26 | 1.60 | 1.59 | 1.17 | 1.13 | 0.96 | 1.23 |
| Variance | 1.35 | 1.32 | 1.56 | 1.59 | 2.56 | 2.53 | 1.28 | 0.92 | 1.51 | |
| Student's t-test (2.306)b | 0.027 | 0.643 | 0.288 | 0.164 | 0.316 | |||||
| F-value (6.39)b | 1.02 | 1.02 | 1.01 | 1.85 | 1.64 | |||||
| Parameter | Hydroquinone | Tretinoin | Fluocinolone acetonide | Methyl paraben | Propyl paraben | |||||
|---|---|---|---|---|---|---|---|---|---|---|
| TLC-densitometric method | Manufacturer methodc | TLC-densitometric method | Manufacturer methodd | TLC-densitometric method | Manufacturer methodc | TLC-densitometric method | Manufacturer methodc | TLC-densitometric method | Manufacturer methodc | |
| a Standard deviation and percentage relative standard deviation for 5 determinations.b Tabulated values for t and F at P = 0.05.c Manufacturer HPLC method using ODS 250 × 4.6 mm, 5 μm column, mobile phase mixture of 320 mL acetonitrile and 680 mL 1.8 g sodium heptanes sulfonate in water pH 3.5 by phosphoric acid, flow rate 1.2 mL min−1 and detection at 254 nm.d Manufacturer HPLC method using ODS 250 × 4.6 mm, 5 μm column, mobile phase mixture of 800 mL acetonitrile and 200 mL 0.5% acetic acid in water, flow rate 1.5 mL min−1 and detection at 360 nm. | ||||||||||
| Mean ± SDa | 99.70 ± 1.23 | 99.74 ± 1.15 | 101.17 ± 0.53 | 100.03 ± 1.26 | 99.32 ± 1.09 | 99.95 ± 1.59 | 99.86 ± 1.54 | 100.00 ± 1.13 | 100.82 ± 1.47 | 99.94 ± 1.23 |
| RSDa | 1.23 | 1.15 | 0.52 | 1.26 | 1.10 | 1.59 | 1.54 | 1.13 | 1.46 | 1.23 |
| Variance | 1.51 | 1.32 | 0.28 | 1.59 | 1.19 | 2.53 | 2.37 | 1.28 | 2.16 | 1.51 |
| Student's t-test (2.306)b | 0.053 | 1.865 | 0.731 | 0.164 | 1.028 | |||||
| F-value (6.39)b | 1.14 | 5.68 | 2.13 | 1.85 | 1.43 | |||||
4.3. Kinetics of the photodegradation
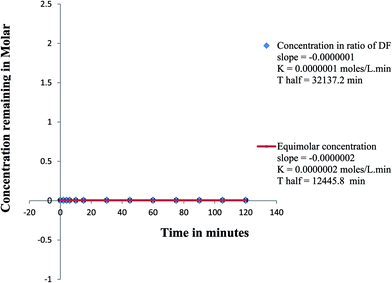
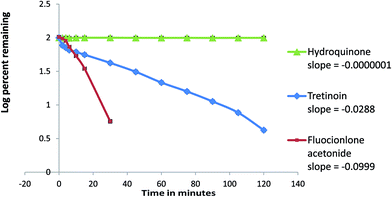
In this work, a comparative kinetic investigation of HQ, TRT and FLA photodegradation was done. Calculations were based on the measurement of the concentration of intact drug using the proposed HPLC method. This study was performed twice starting with concentrations ratio used in pharmaceutical formulation and using equimolar concentration of the three drugs. The order of the photodegradation rate of the reaction was determined by following the decrease in concentration of each drug within two hours at certain time interval.The photodegradation rate of HQ was independent on its concentration predicted to be zero order reaction. The rate constant of the degradation (K) and the half life of the reaction (t1/2) were calculated from the equations: slope = −K and t1/2 = initial concentration in molar/2K.32 The K forward values were nearly the same and the t1/2 values were different when starting with different concentrations, Fig. 7. Hydroquinone was photodegraded to BQ (Fig. 1D) and its concentration remained constant due to reversibility between HQ and BQ.33 Hydroquinone is more stable than BQ because it is more aromatic.34 Therefore the photodegradation of HQ to BQ was reversible zero order reaction.
The photodegradation of TRT to ISO was reversible besides the formation of 9-cis retinoic acid (Fig. 1E) and their concentrations were decreased by time. Fig. 1F showed the photodegradation of FLA. The photodegradation rates of TRT and FLA could not be expressed by simple first order equations because their rates changed with different concentrations. The photodegradation rates of TRT and FLA were proposed to be complex reactions.32
Starting with concentrations ratio used in pharmaceutical formulation, FLA was degraded faster than TRT. While, both TRT and FLA showed nearly the same rate of degradation when starting with equimolar concentrations (Fig. 8 and 9).
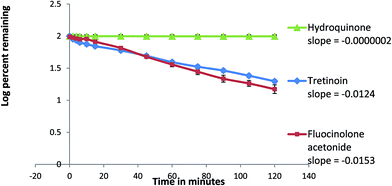 | ||
| Fig. 9 Kinetic plot of the photodegradation of hydroquinone, tretinoin and fluocinolone acetonide starting with equimolar concentrations (initial concentrations 10 mmol in acetonitrile of each). | ||
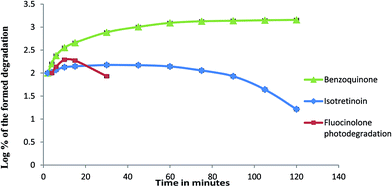
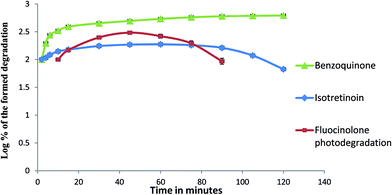
A comparison to the formed photodegradation products was shown in Fig. 10 and 11. 1,4-Benzoquinone formed was increased gradually and remained constant. Isotretinoin formed was increased gradually then remained stable and started in disappearing. The formed FLA photodegradation product was faster in disappearance.
5. Conclusion
The proposed HPLC and TLC-densitometric methods provided simple, sensitive, selective and accurate simultaneous determination of HQ, TRT, FLA, the preservatives MET and PRP in pure form and pharmaceutical formulation, without any interference from the excipients and in presence of the drugs degradation products. The proposed methods were validated and could be used for routine analysis in quality control laboratories, where economy and time are essential.The HPLC method was found to be more sensitive than the TLC-densitometric one, The HPLC method could simultaneously determine nine components (the three active ingredients, the preservatives, HQ polymer, BQ, ISO and FLA photodegradation product). Separation of TRT photodegradation product; 9-cis retinoic acid was done by the proposed HPLC method only.
The TLC-densitometric method could simultaneously determine six components (the three active ingredients, the preservatives and ISO) and separate BQ as it is liable to sublimation. The advantage of this method was the separation of TRT and its isomer ISO using chiral developing system besides the other components in one run. Fluocinolone photodegradation product could be determined by the proposed TLC-densitometric method if present with the intact drug in raw material only. This method had also the advantages of short run time, large sample capacity and the use of minimal value of solvent.
The degradation products HQ polymer and ISO were found in pharmaceutical formulation near expiry date. Also, the proposed HPLC method had the advantage of lower limit of detection of ISO, 0.04 μg mL−1.
The proposed HPLC method was used in comparative determination of HQ, TRT and FLA photodegradation kinetic rate in acetonitrile within two hours. Hydroquinone showed reversible zero order kinetics. Tretinoin and fluocinolone acetonide followed complex kinetic reactions.
Acknowledgements
The authors express a deep sense of gratitude to Prof. Dr Ibrahim Farag (Professor of Crystallography and Materials Science), all the staff: Dr El-Sayed Shalaby, Prof. Dr Aisha Moustafa, Dr Ahmed Farghaly in X-ray crystallography Lab., Physics Division, National Research Centre, Egypt for the refinement of FLA photodegradation product, Assoc. Prof. Dr Khaled O. Mohamed (Associate Professor of Organic Chemistry, Faculty of Pharmacy, Cairo University) for help in studying the mechanism of FLA phtodegradation and Dr Mahmoud Essam (Polymer Division, National Research Centre, Egypt) helping in polymer characterization.References
- J. O. Neil, The Merck Index An Encyclopedia of Chemicals, Drugs and Biologicals, Whitehouse Station, N.J., USA, 14th edn, 2006 Search PubMed.
- H. Torok, T. Jones, P. Rich, S. Smith and E. Tschen, Cutis, 2005, 75, 57–62 Search PubMed.
- B. Desmedt, V. Rogiers, P. Courselle, J. O. D. Beer, K. D. Paepe and E. Deconinck, J. Pharm. Biomed. Anal., 2013, 83, 82–88 CrossRef CAS PubMed.
- I.-H. Chiu, Analytical Method Development of Pigment Lightening Ointments by High Performance Liquid Chromatography and Their Stability Study, Chaoyang University of Technology, 2007 Search PubMed.
- B. M. Tashtoush, E. L. Jacobson and M. K. Jacobson, J. Pharm. Biomed. Anal., 2007, 43, 859–864 CrossRef CAS PubMed.
- G. Ioele, E. Cione, A. Risoli, G. Genchi and G. Ragno, Int. J. Pharm., 2005, 293, 251–260 CrossRef CAS PubMed.
- C. J. Wang, L. H. Pao, C. H. Hsiong, C. Y. Wu, J. J. Whang-Peng and O. Y. Hu, J. Chromatogr. B: Anal. Technol. Biomed. Life Sci., 2003, 796, 283–291 CrossRef CAS.
- R. Gatti, M. G. Gioia, A. M. D. Pietra and M. Cini, J. Chromatogr. A, 2001, 905, 345–350 CrossRef CAS.
- B. M. Tashtoush, E. L. Jacobson and M. K. Jacobson, Int. J. Pharm., 2008, 352, 123–128 CrossRef CAS PubMed.
- P. Srinivasu, D. V. SubbaRao, R. V. K. Vegesna and K. S. Babu, Am. J. Anal. Chem., 2010, 1, 113–126 CrossRef CAS.
- R. A. Kenley, M. O. Lee, L. Sukumar and M. F. Powell, Pharm. Res., 1987, 4, 342–347 CrossRef CAS.
- E. Shek, J. Bragonje, E. J. Benjamin, M. J. Sutherland and J. A. P. Gluck, Int. J. Pharm., 1982, 11, 257–269 CrossRef CAS.
- G. Miolo, S. Caffieri, D. Dalzoppo, A. Ricci, E. Fasani and A. Albini, Photochem. Photobiol., 2005, 81, 291–298 CrossRef CAS.
- G. Miolo, S. Caffieri, D. Dalzoppo, F. Gallocchio, E. Fasani and G. M. J. B. v. Henegouwen, J. Photochem. Photobiol., B, 2011, 103, 35–41 CrossRef CAS PubMed.
- S. I. Alqasoumi, P. Alam, A. J. Al-Rehaily, F. Shakeel and M. S. Abdel-Kader, J. Planar Chromatogr.--Mod. TLC, 2011, 24, 48–52 CrossRef CAS.
- C. Pulgarin, N. Adler, P. Péringer and C. Comninellis, Water Res., 1994, 28, 887–893 CrossRef CAS.
- A. Zhang, J. He, Y. Guan, Z. Li, Y. Zhang and J. X. Zhu, Sci. China: Chem., 2012, 55, 830–835 CrossRef CAS.
- Y. Zhou, X. Ren, C. Sheng, X. Chen, Y. Kong, Y. Tao and Z. Chen, J. Solid State Electrochem., 2012, 16, 3159–3164 CrossRef CAS PubMed.
- F. Cataldo, Polym. Int., 1998, 46, 263–268 CrossRef CAS.
- A. Furlani, M. V. Russo and F. Cataldo, Synth. Met., 1989, 29, E507–E510 CrossRef CAS.
- S. I. Sadykh-Zade, A. V. Ragimov, S. S. Suleimanova and V. I. Liogon'Kii, Polym. Sci. U.S.S.R., 1972, 14, 1395–1403 CrossRef.
- D. Skoog, F. Holler and S. Crouch, Principles of Instrumental Analysis, USA, 6th edn, 2007 Search PubMed.
- R. J. Young and P. A. Lovell, Introduction to Polymers, 1991 Search PubMed.
- http://pubchem.ncbi.nlm.nih.gov/compound/6215, accessed April 2015.
- D. H. R. Barton and P. T. Gillam, J. Chem. Soc., 1960, 4596–4599 RSC.
- D. H. R. Barton, P. d. Mayo and M. Shafiq, J. Chem. Soc., 1958, 140–145 RSC.
- G. Miolo, A. Ricci, S. Caffieri, L. Levorato, E. Fasani and A. Albini, Photochem. Photobiol., 2003, 78, 425–430 CrossRef CAS.
- H. E. Zimmerman and D. I. Schuster, J. Am. Chem. Soc., 1962, 84, 4527–4540 CrossRef CAS.
- The United States Pharmacopeia and National Formulary, USP 37-NF 32, U.S. Pharmacopeial Convention, Rockville MD, USA, 2014.
- A. I. Vogel, Practical Organic Chemistry, Longman scientific and technical, 5th edn, 1989 Search PubMed.
- International Conference of Harmonization (ICH) of Technical Requirements for the Registration of Pharmaceuticals for Human Use, Validation of Analytical Procedures: Definitions and Terminology, Stability Testing of New Pure forms and Products Q1A (R2), Geneva, 2003.
- A. Florence and D. Attwood, Physical Principles of Pharmacy, Macmillan Press, 2nd edn, 1998 Search PubMed.
- T. Okuyama and H. Maskill, Organic Chemistry: A Mechanistic Approach, Oxford University Press, 2013 Search PubMed.
- D. Magdziak, A. A. Rodriguez, R. W. V. d. Water and T. R. R. Pettus, Org. Lett., 2002, 4, 285–288 CrossRef CAS PubMed.
Footnote |
| † CCDC 983930. For crystallographic data in CIF or other electronic format see DOI: 10.1039/c5ra07083j |
| This journal is © The Royal Society of Chemistry 2015 |

