DOI:
10.1039/C5RA04663G
(Paper)
RSC Adv., 2015,
5, 48705-48711
Core–shell hydroxyapatite/Mg nanostructures: surfactant free facile synthesis, characterization and their in vitro cell viability studies against leukaemia cancer cells (K562)
Received
17th March 2015
, Accepted 26th May 2015
First published on 26th May 2015
Abstract
Hydroxyapatite/magnesium core–shell nanostructures were synthesized by a simple and cost effective precipitation method without a surfactant. The properties of the prepared samples were studied by using sophisticated analytical techniques. X-ray analysis confirms the phase purity and high crystallinity of the sample with an average crystallite size of 26 nm. The microscopic images show the spherical morphology of the pure and core–shell hydroxyapatite/magnesium. The other characterization studies also confirm the formation of pure hydroxyapatite and hydroxyapatite/magnesium core–shell nanostructures. The obtained materials were subjected to in vitro cell viability analysis by using human leukaemia cancer cells – K562 through a sulforhodamine-B assay. The results obtained depict that the HAp/Mg core–shell nanorods were not significantly toxic to K562 cells in the given concentrations compared with the pristine HAp. This is due to the enhanced biocompatibility and biodegradability of the magnesium shell. The present finding underlines the possible use of this material for biomedical applications.
1. Introduction
Hydroxyapatite (HAp) is one of the most promising ceramic biomaterials which shows excellent bioactivity and biocompatibility and also plays a significant role in tissue regenerative medicine, biosensors and drug carriers.1–3 These multifunctional applications of HAp strongly depend on their morphology, stoichiometric ratio, crystallinity and crystal size distribution. Doping and making a composite with HAp may enhance its functional properties which can lead to a change in morphology, crystallinity, etc. Magnesium is a biologically important alkali earth element and is the fourth most abundant mineral in a normal human body. 50% of the total body magnesium is found in the bone system.4 Magnesium also plays a significant role in bioengineering fields for making corrosion resistive coatings on implant materials, surgical plates, screws and bio glasses for hard tissue regenerative medicine.5–7 The substitution of silicon and magnesium ions in hydroxyapatite shows good biocompatibility, but it may destabilize the original structure and phase of hydroxyapatite.8 At the same time, it is also believed that magnesium alone cannot destabilize the HAp structure.
In order to overcome the destabilization problem and to enhance the bioactivity and biodegradability of the carrier material, researchers concentrate on a new class of materials with improved functionalities based on core–shell nanostructures. Core–shell structures may expose the functional properties of both the materials without disquieting the structure. HAp/metal or metal oxide core–shell nanostructures for various applications have been prepared by many researchers using different methods. For example, Li et al. have prepared mesoporous silica coated HAp core–shell nanostructured particles through a three step chemical method with surfactant.9 Hydroxyapatite/liposome core–shell nanocomposite particles were prepared by using emulsifier assisted chemical method, Fe3O4 core–hydroxyapatite shell by polymer assisted in situ deposition with biomineralization process and hydroxyapatite/chitosan core–shell nano spheres using different processes.10–14 In the present work, hydroxyapatite/magnesium core–shell nanostructures were synthesized by wet chemical method without using any surfactant, ligand or chelating agent. The physical properties of the prepared nano materials were systematically investigated by using different analytical techniques. The cell viability of the nanostructures against human leukaemia cancer cells (K-562) was investigated. Leukaemia cell is a type of blood cancer cell that can affect the bone marrow and lymphatic tissue and interfere with the production and functioning of red cells, white cells and plates. This can lead to severe anaemia, bleeding and impaired ability to fight infections and death.15,16 The literature survey does not show any previous studies using HAp/Mg core–shell nanostructures as carrier materials against human leukaemia cancer cells.17–19
2. Materials and experimental methods
2.1. Material preparation
Calcium chloride dihydrate (CaCl2·2H2O), diammonium hydrogen phosphate ((NH4)2HPO4) and magnesium nitrate hexahydrate (MgNO3·6H2O) were obtained from Himedia Laboratories Pvt. Ltd, India. Ammonia and absolute ethanol 99.9% were obtained from SD-Fine Chem Limited, India. All these precursor materials were AR grade and used without further purification. The source for human leukaemia cancer cell line (K562) was NCI, USA.
A facile, cost effective and easily tuneable wet chemical method was adopted in the present work to prepare the spherical hydroxyapatite nanostructures. Calcium chloride and diammonium hydrogen phosphate were mixed separately with double distilled water with a molar ratio of 1![[thin space (1/6-em)]](https://www.rsc.org/images/entities/char_2009.gif) :0.6 to maintain the stoichiometric ratio of 1.67 for hydroxyapatite. The pH of the phosphate solution was raised to 11 by adding ammonia (25%) solution. Both the solutions were stirred continuously with moderate speed at room temperature. The calcium containing solution was further added to the phosphate solution. The obtained mixture was stirred for 48 h at room temperature and the resultant precipitate was washed with aqueous solution and dried at 100 °C. The resultant pristine HAp nanoparticles were dispersed in ethanol solution containing magnesium nitrate and purged with argon gas and stirred well. The product was washed with ethanol and dried before further characterization.
:0.6 to maintain the stoichiometric ratio of 1.67 for hydroxyapatite. The pH of the phosphate solution was raised to 11 by adding ammonia (25%) solution. Both the solutions were stirred continuously with moderate speed at room temperature. The calcium containing solution was further added to the phosphate solution. The obtained mixture was stirred for 48 h at room temperature and the resultant precipitate was washed with aqueous solution and dried at 100 °C. The resultant pristine HAp nanoparticles were dispersed in ethanol solution containing magnesium nitrate and purged with argon gas and stirred well. The product was washed with ethanol and dried before further characterization.
2.2. Sulforhodamine B (SRB) assay
Sulforhodamine B (SRB) colorimetric assay is used for in vitro cell viability analysis against pure HAp and HAp/Mg core–shell nanoparticles. Human leukaemia cancer cell line (K562, from National Cancer Institute, USA) was used to study the effect of the prepared nanostructures for cell compatibility. The cells were cultured and habitually maintained in RPMI 1640 medium supplemented with 10% fetal bovine serum and 2 mM L-glutamine. The cells were inoculated in 96 well microtiter plates in optimal seeding densities. After cell inoculation, the microtiter plates were incubated in humidified atmosphere containing 5% CO2, 95% air at 37 °C for 24 h prior to addition of HAp and HAp/Mg. The HAp and HAp/Mg were exposed to K562 cell line in different concentrations (10–80 μg ml−1) to measure the cell viability pattern.20 All the experiments were conducted in triplicates.
2.3. Characterization
Phase identification of the prepared nanostructures were performed by using powder X-ray diffractometer (XRD) (Bruker D8 Advance Diffractometer) with Cu-Kα radiation (λ = 1.5406 Å) with an operating voltage of 40 kV. A FEI Quanta-250 field emission scanning electron microscope (FESEM) at 30 kV was employed for the morphological analysis after sputter coating the samples with gold. The morphology and particle size were examined by transmission electron microscope (TEM) (FEI Tecnai G2 20 S-TWIN). Also the selected area electron diffraction (SAED) was recorded with an accelerating voltage of 200 kV. The functional group compositions were analysed using FTIR spectrum recorded using a Jasco FTIR spectrometer. Micro Raman spectrometer-800 (LabRAM HR) with an output power of 20 mW, 514 nm Argon laser was used for the Raman analysis. Thermal analysis was carried out using EXSTAR 6200 TG/DTA (SII Nanotechnology Inc., Japan) with a heating rate of 5 °C min−1.
3. Results and discussion
3.1. Structural analysis
Fig. 1 shows the XRD patterns for the pure HAp and Mg coated HAp nanostructures. The well broadened high intensity peaks in Fig. 1a are attributed to the smaller crystallite size as well as the high crystallinity of the pure HAp sample. The obtained pattern is in good agreement with standard JCPDS # 09-0432 and matches very well with the hexagonal crystal structure with a space group of P63/m.1 The average crystallite size is estimated as 26 nm by using Scherer's formula. The pristine HAp peaks are not clearly visible in Fig. 1b. This may be due to the magnesium coating on the HAp which strongly suppresses the intensity of the HAp peaks. The Mg ions may enter the lattice of the HAp and occupy the Ca2+ sites. Therefore the intensity of the major peaks is decreased and some peaks disappear indicating a reduction in the degree of crystallinity of the HAp.21 It has already been reported that the amorphous silica and Fe3O4 coatings on HAp strongly suppress the peak sharpness and intensity in the HAp due to the encapsulation of Si and Fe3O4.1,22 The lattice parameters have been calculated as a = b = 9.4927, c = 6.8625 Å, lattice density = 3.11 g cm−3 and cell volume = 535.54 cm3. These values are found to match with the standard values of the HAp (JCPDS card no: 09-0432).
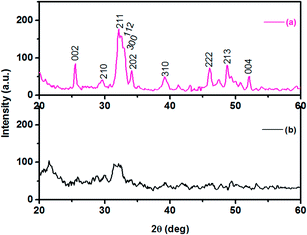 |
| | Fig. 1 XRD patterns for (a) pure HAp and (b) magnesium coated HAp. | |
3.2. Morphological analysis
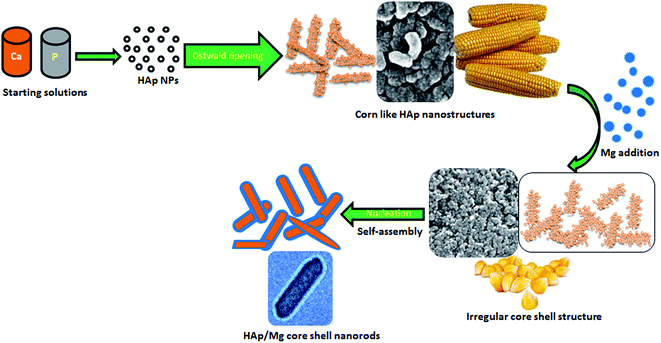
Fig. 2a and b show the spherical morphologies of the HAp nanostructures having uniform shape (∼15 nm) and size distribution. When the as-prepared material was kept at room temperature for a day (self annealing), it was observed that the spherical HAp nanoparticles combined together to form corn like nanostructures due to Ostwald repining process. The shape of the particles is grainy depending on the stirring duration and starting precursors. The mode of addition of precursor solution plays a vital role in the formation of spherical nanoparticles with good crystallinity and morphology and also fast mixing of precursor solution leads to the formation of spherical morphology.23 Moreover, most of the researchers have used nitrate salts and ammonium as precursor materials for the preparation of HAp nanostructures.3,24 In contrast, we have used chloride and diammonium as the staring precursor materials with trouble-free simple precipitation at room temperature. The spherical particles with uniform size distribution obtained due to the effect of stirring period, fast mixing and the starting precursors.
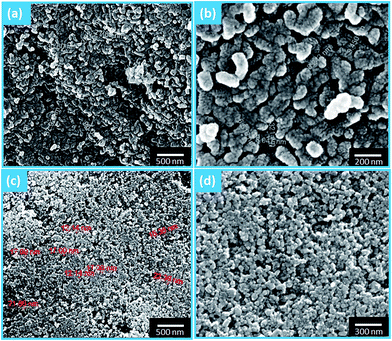 |
| | Fig. 2 FESEM images of (a and b) pure HAp and (c and d) Mg coated HAp. | |
In the precipitation and sol–gel methods, surfactants, templates and special agents were used for the formation of nanostructured particles with different size, shape and morphology, and to control their particle size by minimizing the high tendency of agglomeration of HAp nanoparticles.24 But in the present work, no special agents were used and the particle size was controlled by changing the starting precursors, stirring period and fast mixing.
Fig. 2c and d show the morphology of the Mg coated irregular shaped hydroxyapatite nanostructures with particle size less than 50 nm. It is interesting to note that the corn like nanostructure was destabilized/disturbed with the addition of Mg which leads to the formation of irregular core–shell nanostructures. Also, the Mg shell induced the self-assembling process to form core–shell nanorods. This process was concordant with previous report.8 By comparing Fig. 3a with 3b, it can be clearly seen that only Ca, P and O exist in pristine HAp while Mg appears in Fig. 3b. This indicates that the entry of Mg occurs only after the immersion of HAp nanostructures into the magnesium solution.
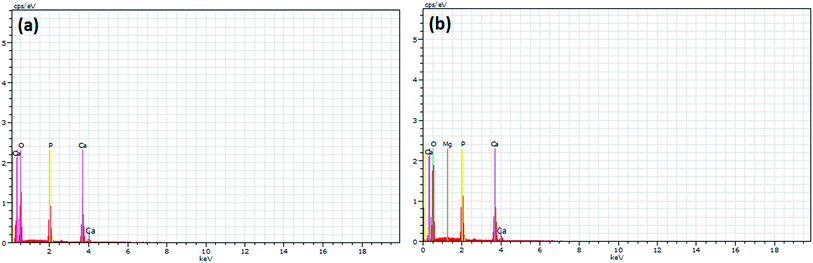 |
| | Fig. 3 EDS spectra of (a) pure HAp and (b) Mg coated HAp. | |
In order to confirm the interior structure of the prepared HAp and HAp/Mg core–shell nanostructures, TEM analysis was undertaken. Fig. 4a and b depicts corn like nano structures containing spherical HAp nanoparticles with less than 15 nm size. It is clearly seen in the higher magnification images (Fig. 4b1 and b2) of Fig. 4b. The average width and length of the corn like nanostructures are 20 and 60 nm respectively. The selected area electron diffraction (SAED) pattern for pristine HAp nanostructure is shown in Fig. 4c. It represents the hexagonal symmetry and single crystalline nature of the corn like HAp. Meanwhile, the formation of Mg layer on the HAp leads to core–shell nanorods. Fig. 4d and e clearly display the core–shell structure of the Mg coated HAp nanorods in which the tinge shell is ascribed to Mg. Here, the added Mg breaks/destabilizes the corn structures and a self-assembling process followed by nucleation leads to the formation of core–shell nanorods from spherical HAp nanoparticles. As reported earlier, the inclusion of Mg produces larger crystals.8 The length and width of these nanorods are 60 and 16 nm respectively and the shell thickness is 2–3 nm. The Mg layer alters the single crystalline nature into poly crystalline which is clearly seen in Fig. 4f. Based on this study, the possible growth mechanism for the formation of corn like HAp nanostructures and HAp/Mg core–shell nanorods can be explained as depicted in Fig. 5. This figure explains the nucleation, growth of nanoparticles, Ostwald ripening, destabilization, and self-assembly processes.
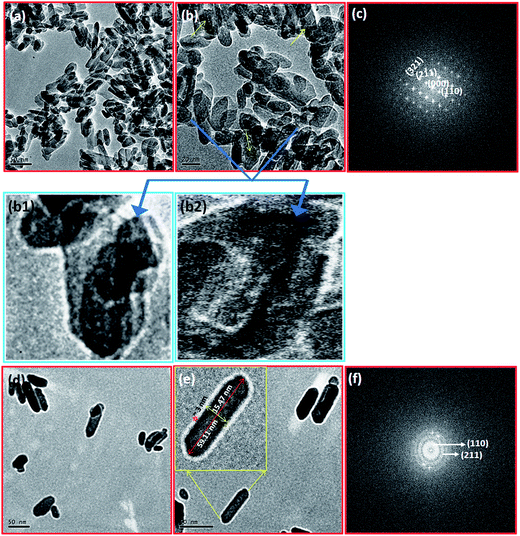 |
| | Fig. 4 TEM micrographs of pristine corn like HAp (a) and (b) nanoparticles inside the corn structure (indicated by arrows); (d and e) core–shell nanostructure of Mg coated HAp and (c and f) SAED pattern for pristine HAp and Mg coated HAp. Inset: higher magnification image of the area indicated by a box. | |
 |
| | Fig. 5 Schematic illustration for the growth mechanism of HAp/Mg core–shell nanostructures. | |
3.3. FTIR and Raman analysis
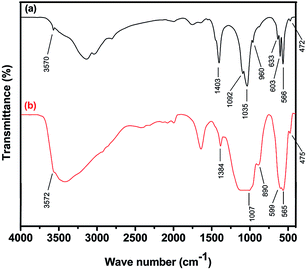
3.3.1. FTIR analysis. Fig. 6a and b show the FTIR spectra of the corn like hydroxyapatite and magnesium coated hydroxyapatite nanorods. The characteristic peaks in Fig. 6a at 3570 and 633 cm−1 are due to the stretching and vibrational modes of the –OH groups of hydroxyapatite. The characteristic tetrahedral PO43− peaks are clearly presented at 472, 566, 603, 960 and 1035–1092 cm−1.18,19 The peak at 472 cm−1 corresponds to PO43−(ν2) mode and the peaks at 566, 603 cm−1 are corresponds to PO43−(ν4) mode. Moreover, the peak at 960 cm−1 is for PO43−(ν1) and the peaks at 1092 and 1035 cm−1 are due to PO43−(ν3). The peak at 1403 cm−1 is assigned to CO32−.25,26 The peaks at 1413 and 874 cm−1 represent the interaction of carbon dioxide molecule with the prepared nanoparticles. The observation of these peaks indicates that the CO32− group is substituted for PO43− group in the HAp lattice, thus confirming the existence of B-type carbonate in the prepared HAp nanoparticles.21 Fig. 6b shows the FTIR spectrum of the Mg coated hydroxyapatite nanorods. It shows the suppression in the intensity of the characteristic stretching bands and vibrational modes of structural OH− groups and PO43− groups of HAp/Mg. The substitution of Mg into HAp reduces the intensity of the characteristic structural hydroxyl groups which is in good agreement with earlier report.8 In addition, the less intense phosphate peaks are observed at 475, 565, 599 and 1007 cm−1. Similarly, the intensity of the carbonate peak is reduced and shifted to 1384 cm−1. It is due to the inert preparation condition such as Ar atmosphere as well as the formation of Mg shell around the HAp.
 |
| | Fig. 6 FTIR spectra of (a) pure hydroxyapatite and (b) Mg coated hydroxyapatite. | |
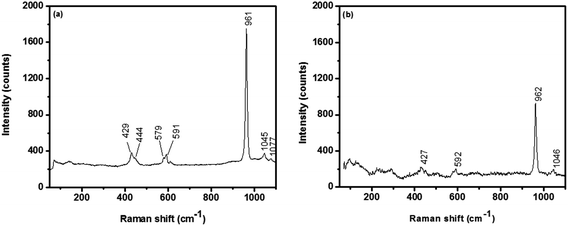
3.3.2. Raman analysis. The Raman peaks observed at 429, 591, 961, 1045 and 1077 cm−1 in Fig. 7a represent the typical hexagonal hydroxyapatite phase. The peak at 961 cm−1 is attributed to the characteristic symmetric stretching vibration of the phosphate group (PO43−). The position of this peak represents the degree of crystallinity of the HAp nanoparticles. Also, the peak at 1077 cm−1 reveals the existence of B-type carbonate. The observed results are in accordance with reported values.24 Similarly, Mg coated HAp core–shell nanorods shows the characteristic peaks in Fig. 7b, but the intensity of all the peaks are found to be significantly lower and the major phosphate peak is slightly shifted to 962 cm−1. It is confirmed the coated Mg layer should present around the HAp nanorods.
 |
| | Fig. 7 Raman spectra of (a) pure hydroxyapatite and (b) Mg coated hydroxyapatite. | |
3.4. Thermal analysis
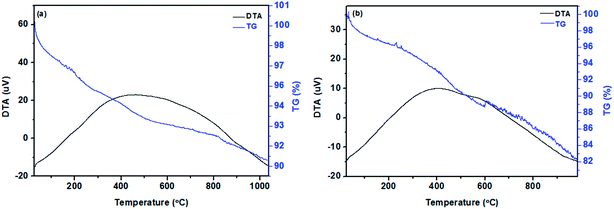
Thermogravimetric curves of the pristine corn like HAp and Mg coated HAp core–shell nanorods are shown in Fig. 8a and b. The thermogram of the pristine HAp in Fig. 8a shows a two-step weight loss, in which the first step occurring below 170 °C corresponds to the adsorbed water molecules. The second weight loss in the temperature range 170 to 910 °C represents the elimination of moisture and residue of precursor material and also the gradual dehydroxylation of HAp.1,27 The thermogram of the Mg coated HAp nanostructures in Fig. 8b shows three step weight losses. The first weight loss below 200 °C represents the evaporation of ethanol solvent and water molecule. The second weight loss at 200–400 °C reveals the elimination of other groups/combinations in the precursors like –OH and –OCH3CH2.28 The third weight loss from 480 °C to 580 °C implies the removal of –NO3 groups and the constitutional water molecule of HAp.29,30 The observed slope seems to be broad in nature which implies less reactions between magnesium and air and this range of slope is attributed due to the oxidation and nitridation of the particles.29,30 No weight loss is observed above 600 °C which confirms the stable phase of the material. It refers the strong cover up of HAp by the Mg layer.
 |
| | Fig. 8 Thermogram of pure HAp (a) and (b) Mg coated HAp. | |
3.5. In vitro cell viability
Fig. 9 shows the optical microscopic image of the human leukaemia cell line (K562) which includes HAp and HAp/Mg core–shell nanoparticles (concentration 80 μg ml−1) incubated in 5% CO2, at 37 °C for 24 h. The cell viability pattern of the K562 cell line has been monitored by exposing them to different concentrations of HAp and HAp/Mg core–shell nanoparticles. The corresponding cell viability studies revealed the direct influence of nanoparticle concentration on cell growth as shown in Fig. 10.
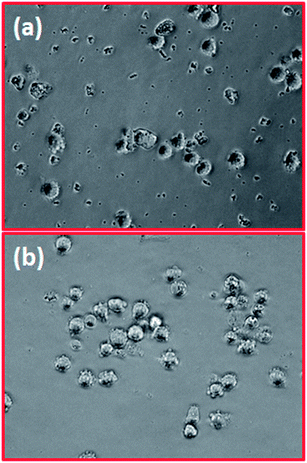 |
| | Fig. 9 Optical images of the nanostructures on K562 cells (a) HAp and (b) Mg coated HAp. | |
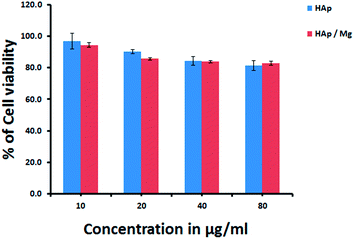 |
| | Fig. 10 Bar diagram for % of cell viability vs. concentration of nanostructures (μg ml−1). | |
From the results it is inferred that there is a gradual reduction in cell growth pattern with the increase in the concentration of HAp and HAp/Mg. The cell viability of the HAp nanoparticles is 96.9% in a concentration of 10 μg ml−1 and it gradually decreases to 81.4% when the concentration was increased to 80 μg ml−1. The results are slightly different when the cells are exposed to HAp/Mg core–shell structures. Here a gradual decrease in growth pattern is seen up to a concentration level of 40 μg ml−1 and then a slight increase of growth from 82.9% to 83.9% when the concentration is 80 μg ml−1. The exposure of the cells to higher concentration adversely affects the function of phenotype, change in cell behaviour and cytotoxicity. The observed results coincide well with that of previous reports.17,31 In terms of biocompatibility pattern, HAp/Mg is found to be more promising than the pure HAp. Mg is known to be bioactive in cell adhesion mechanism and it may boost the cell viability due to the effects on leukaemia cell proliferation.31 The slow degradation of Mg induces metabolic activity against K562 cells and shows good viability. The presence of phosphate ions in the HAp core material helps to slow the degradation of Mg.32 Therefore, the cell viability of the HAp/Mg core–shell nanostructures is slightly increased at 80 μg ml−1. The results of the current study indicate that there would not be much damage to the membrane in the cell line as indicated by the better cell viability observations.
4. Conclusions
In summary, corn like HAp and HAp/Mg core–shell nanostructures were successfully prepared by using facile wet chemical method and the samples were systematically investigated by various analytical techniques. The studies confirm the formation of pure HAp and core–shell nanostructures. The existing elements and purity of the obtained products are confirmed through EDS analysis. SAED pattern confirms the single and polycrystalline nature of the obtained products. FTIR and Raman analysis support the presence of characteristic functional groups in the obtained products. Raman analysis also confirms that the HAp nanostructures are covered with Mg shell. Thermal analysis explains the stability of pristine hydroxyapatite and core–shell structured HAp. The study of the cell viability of the HAp/Mg core–shell nanorods reveals that it was not significantly toxic to K562 cells in the given concentrations compared with the pristine HAp. The prepared nanomaterials can play a significant role in biomedical and industrial applications like targeted drug delivery especially blood cancer cells, gene delivery and peptide delivery.
Acknowledgements
One of the authors M. Manoj would like to thank DST-PURSE programme (BU/DST PURSE PROG./APPT./22), Govt. of India for providing financial support to carry out this work successfully and Dr Mrs Arti Juvekar, ACTREC, India, for her support to do this work.
Notes and references
- K. Mani Rahulan, G. Vinitha, S. Ganesan, R. Philip and P. Aruna, J. Mater. Sci.: Mater. Electron., 2012, 23, 871–877 CrossRef.
- L. Bihui, L. Gang, L. Lijuan and T. Yiwen, J. Wuhan Univ., Nat. Sci. Ed., 2010, 15, 325–329 CrossRef PubMed.
- L. Yubao, K. D. Groot, J. D. Wijn, C. P. A. T. Klein and S. V. D. Meer, J. Mater. Sci.: Mater. Med., 1994, 5, 326–331 CrossRef CAS.
- R. K. Rude, J. Bone Miner. Res., 1998, 13, 749–758 CrossRef CAS PubMed.
- C. Ma, L. Chen, J. Xu, A. Fehrenbacher, Y. Li, F. E. Pfefferkorn, N. A. Duffie, J. Zheng and X. Li, J. Biomed. Mater. Res., Part B, 2013, 101, 870–877 CrossRef PubMed.
- Y. Xin, J. Jiang, K. Huo, G. Tang, X. Tian and P. K. Chu, J. Biomed. Mater. Res., Part A, 2009, 89, 717–726 CrossRef PubMed.
- A. Balamurugan, G. Balossier, J. Michel, S. Kannan, H. Benhayoune, A. H. S. Rebelo and J. M. F. Ferreira, J. Biomed. Mater. Res., Part B, 2007, 83, 546–553 CrossRef CAS PubMed.
- S. R. Kim, J. H. Lee, Y. T. Kim, D. H. Riu, S. J. Jung, Y. J. Lee, S. C. Chung and Y. H. Kim, Biomaterials, 2003, 24, 1389–1398 CrossRef CAS.
- C. Li, X. Ge, S. Liu and F. Liu, Adv. Mater. Res., 2012, 463–464, 543–547 CAS.
- M. Chu and G. Liu, Nanotechnology, 2005, 16, 1208–1212 CrossRef CAS.
- C. Huang, Y. Zhou, Z. Tang, X. Guo, Z. Qian and S. Zhou, Dalton Trans., 2011, 5026–5031 RSC.
- L. Xiangnan, C. Xiaoming, L. Shipu and P. Zhiming, J. Wuhan Univ. Technol., Mater. Sci. Ed., 2010, 25, 252–256 CrossRef.
- Y. H. Liang, C. H. Liu, S. H. Liao, Y. Y. Lin, H. W. Tang, S. Y. Liu, I. R. Lai and K. C. W. Wu, ACS Appl. Mater. Interfaces, 2012, 4, 6720–6727 CAS.
- M. Neumeier, L. A. Hails, S. A. Davis, S. Mann and M. Epple, J. Mater. Chem., 2011, 21, 1250–1254 RSC.
- American Cancer Society, Global Cancer Facts & Figures, Atlanta, 2nd edn, 2011 Search PubMed.
- A. Jemal, F. Bray, M. M. Center, J. Ferlay, E. Ward and D. Forman, Global cancer statistics, Ca-Cancer J. Clin., 2011, 61, 69–90 CrossRef PubMed.
- I. W. Bauer, S. P. Li, Y. C. Han, L. Yuan and M. Z. Yin, J. Mater. Sci.: Mater. Med., 2008, 19, 1091–1095 CrossRef CAS PubMed.
- Q. Fu, M. N. Rahaman, N. Zhou, W. Huang, D. Wang, L. Zhang and H. Li, J. Biomater. Appl., 2008, 23, 37–50 CrossRef CAS PubMed.
- L. Shipu, H. Sheng, Y. Yuhua and W. Youfa, J. Wuhan Univ. Technol., Mater. Sci. Ed., 2007, 22, 288–290 CrossRef PubMed.
- K. Pandey, P. K. Sharma and R. Dudhe, Sci. Rep., 2012, 1, 1–3 Search PubMed.
- Z. Yang, Y. Jiang, L. X. Yu, B. Wen, F. Li, S. Sun and T. Hou, J. Mater. Chem., 2005, 15, 1807–1811 RSC.
- C. Huang, Y. Zhou, Z. Tang, X. Guo, Z. Qian and S. Zhou, Dalton Trans., 2011, 5026–5031 RSC.
- Y. Zhang and J. Lu, J. Nanopart. Res., 2007, 9, 589–594 CrossRef CAS.
- A. J. Nathanael, S. I. Hong, D. Mangalaraj and P. C. Chen, Chem. Eng. J., 2011, 173, 846–854 CrossRef CAS PubMed.
- A. Doat, F. Pelle, N. Gardant and A. Lebugle, J. Solid State Chem., 2004, 177, 1179–1187 CrossRef CAS PubMed.
- S. Koutsopoulos, J. Biomed. Mater. Res., 2002, 62, 600–612 CrossRef CAS PubMed.
- H. Eslami, M. Solati-Hashjin and M. Tahriri, Iran. J. Pharm. Sci., 2008, 4, 127–134 Search PubMed.
- S. Ziani, S. Meski and H. Khireddine, Int. J. Appl. Ceram. Technol., 2014, 11, 83–91 CrossRef CAS PubMed.
- M. R. Song, M. Chen and Z. J. Zhang, Mater. Charact., 2008, 59, 514–518 CrossRef CAS PubMed.
- Z. Yang, Y. Jiang, L. Yu, B. Wen, F. Li, S. Sun and T. Hou, J. Mater. Chem., 2009, 15, 1807–1811 RSC.
- X. Yang, L. Li, J. He, H. Guo and J. Zhang, J. Mater. Sci. Appl., 2014, 5, 59–65 CAS.
- L. Xu, E. Zhang and K. Yang, J. Mater. Sci.: Mater. Med., 2009, 20, 859–867 CrossRef CAS PubMed.
|
| This journal is © The Royal Society of Chemistry 2015 |


