 Open Access Article
Roughness controlled superhydrophobicity on single nanometer length scale with metal nanoparticles†
Gert H.
ten Brink
,
Nolan
Foley
,
Darin
Zwaan
,
Bart J.
Kooi
and
George
Palasantzas
*
Zernike Institute for Advanced Materials and the Materials Innovation Institute, University of Groningen, Nijenborgh 4, 9747 AG Groningen, The Netherlands. E-mail: g.palasantzas@rug.nl
First published on 17th March 2015
Abstract
Here we demonstrate high water pinning nanostructures and trapping of water droplets onto surfaces via control of roughness on a single nanometer length-scale generated by deposition of preformed gas phase distinct copper nanoparticles on hydrophilic and hydrophobic surfaces. It was found that the contact angles of the water droplets were increased to the superhydrophobic limit ∼150° at high nanoparticle coverages (≥80%) independent of the initial type of surface. The water droplets were trapped onto the surfaces by high adhesion forces similar like the rose petal effect. The droplets are in a Wenzel state at their outer part. Local nanocapillarity can force liquid into crevices between nanoparticles and push trapped air within the center of the droplet forming a Cassie–Baxter metastable state. Hence our approach to alter the wetting state is extremely straightforward without involving special micro/nano structuring facilities, but instead using direct single nanoparticles deposition on any type of surfaces creating a rough surface on a single nanometer length-scale, allowing due to its peculiar high water pinning and nanoporous structure liquid trapping phenomena.
1. Introduction
Wetting of liquids over material surfaces is a topic studied for the last 200 years both from the fundamental and application point of view.1–20 Just to mention a few examples, wetting is important for self-cleaning, anti-icing, the adhesion of material surfaces, stiction issues in microelectromechanical systems (MEMS), Gecko's feet,21 capillarity phenomena, reduced fluid drug in micro/nanofluidic systems etc. Moreover, trapping of water drops by modification of surface wettability can play important roles in the efficiency of drop condensation from vapor in heat exchangers and fog harvesters22–25 and anti-fogging of windows and glasses.26The surface wettability is measured by the contact angle θ between a water droplet and the surface it is attached to. A surface that gives a contact angle (CA) smaller than 90° is termed as hydrophilic, while one with larger than 90° is termed as hydrophobic. The creation also of superhydrophobic surfaces (θ > 150°) has attracted enormous attention,10–12 where examples in nature include the feathers of ducks, butterfly's wings or the leaves of the lotus plant.16,27–30 It is believed that the origin of this bio inspired superhydrophobicity is only achieved by incorporating roughness on multiple length-scales.21,31–35
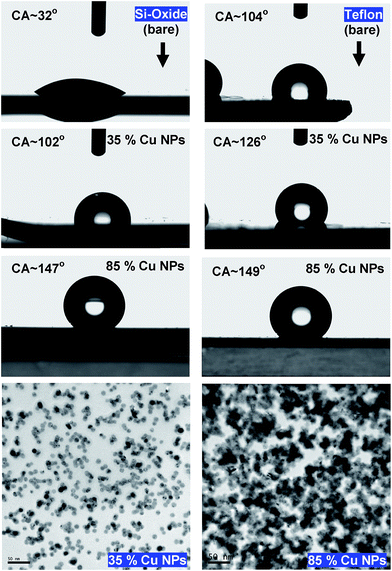
Fig. 1 illustrates the basic wetting surface states (hydrophilic/hydrophobic), where for flat surfaces, θ is given by the Young's equation1 cos![[thin space (1/6-em)]](https://www.rsc.org/images/entities/char_2009.gif) θ = (γsg − γsl)/γlg with γsg, γsl and γlg the solid–gas, solid–liquid and liquid–gas interface energies, respectively. Surface chemistry and roughness play key roles in manipulating wetting phenomena in order to tame surface wettability by proper surface modification.13–20,28–30,36–38 For roughness effects, one may consider the Wenzel (W) model19 where the contact angle θw is given by cos
θ = (γsg − γsl)/γlg with γsg, γsl and γlg the solid–gas, solid–liquid and liquid–gas interface energies, respectively. Surface chemistry and roughness play key roles in manipulating wetting phenomena in order to tame surface wettability by proper surface modification.13–20,28–30,36–38 For roughness effects, one may consider the Wenzel (W) model19 where the contact angle θw is given by cos![[thin space (1/6-em)]](https://www.rsc.org/images/entities/char_2009.gif) θw = R*
θw = R*![[thin space (1/6-em)]](https://www.rsc.org/images/entities/char_2009.gif) cos
cos![[thin space (1/6-em)]](https://www.rsc.org/images/entities/char_2009.gif) θ with R* the ratio of the actual area of the solid–liquid interface to the normally projected area. This model suggests that a hydrophilic surface would be more hydrophilic with surface roughness, while a hydrophobic surface would be more hydrophobic. Moreover, it assumes complete contact of the liquid with the surface (Fig. 2)19 implying that the droplet will not roll off the surface leading to large hysteresis between advancing and receding contact angles. However, liquid droplets on a rough surface are not expected to wet all surface crevices. In this composite or Cassie–Baxter (CB) state (Fig. 2), the droplet rests on surface protrusions and air pockets in between surface features20 resulting in a higher contact angle. Low hysteresis allows the droplets to roll off the surface easier, which is called the Lotus effect. In this model the contact angle θCB is given by cos
θ with R* the ratio of the actual area of the solid–liquid interface to the normally projected area. This model suggests that a hydrophilic surface would be more hydrophilic with surface roughness, while a hydrophobic surface would be more hydrophobic. Moreover, it assumes complete contact of the liquid with the surface (Fig. 2)19 implying that the droplet will not roll off the surface leading to large hysteresis between advancing and receding contact angles. However, liquid droplets on a rough surface are not expected to wet all surface crevices. In this composite or Cassie–Baxter (CB) state (Fig. 2), the droplet rests on surface protrusions and air pockets in between surface features20 resulting in a higher contact angle. Low hysteresis allows the droplets to roll off the surface easier, which is called the Lotus effect. In this model the contact angle θCB is given by cos![[thin space (1/6-em)]](https://www.rsc.org/images/entities/char_2009.gif) θCB = f
θCB = f![[thin space (1/6-em)]](https://www.rsc.org/images/entities/char_2009.gif) cos
cos![[thin space (1/6-em)]](https://www.rsc.org/images/entities/char_2009.gif) θ − (1 − f), where f is the fraction of the solid surface area in contact with the liquid. This model allows for hydrophobicity on a rough surface, even if the flat surface is hydrophilic. During the CB → W transition the air pockets are no longer thermodynamically stable and liquid nucleates within the crevices.39
θ − (1 − f), where f is the fraction of the solid surface area in contact with the liquid. This model allows for hydrophobicity on a rough surface, even if the flat surface is hydrophilic. During the CB → W transition the air pockets are no longer thermodynamically stable and liquid nucleates within the crevices.39
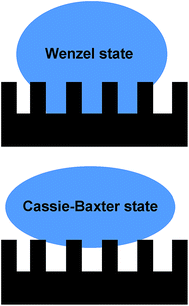 | ||
| Fig. 2 Schematic illustrations of a Wenzel and a Cassie–Baxter state for a liquid drop on top of a rough substrate. | ||
Nowadays the major strategies to form hydrophobic and superhydrophobic surfaces combine roughening of a hydrophobic surface with additional alteration of the surface chemistry using low surface energy materials.13–20,28–30,36–38,40 These endeavors aim to mimic the structure of the lotus leaf or butterfly wings that have strong water repellency and self-cleanliness.16,28–30,41,42 Another possibility is the rose petal effect where a superhydrophobic state exists with a high adhesive force towards water. Other methods to create surfaces with adjusted wettability or hydrophobicity include micro scale roughness,21,28,33–35,41–43 where the roughness can be either random or structured. The structured micro scale roughness, which can take a form resembling a grid of pillars or nail heads sticking out of the surface, have attracted interest for making superhydrophobic and possibly omniphobic surfaces.28,36–38,41,42 Recently, it has also been shown that nanometer-size textures could facilitate more resilient coatings owing to geometry and confinement effects at the nanoscale.40 It was revealed that the superhydrophobic state vanishes above critical pressures which depend on texture shape and size but this phenomenon was irreversible only for conical surface features.40 A thermodynamic analysis of the possibility of making high-contact-angle rough surfaces from low-contact-angle materials has been also considered.44 The high contact-angle state may not be stable and transition from the heterogeneous (CB) wetting regime to the homogeneous (Wenzel) regime with a lower contact angle may occur.44 Theoretically it is possible to make a hydrophobic surface from a hydrophilic material if surface roughness is multivalued.44
Although micro- and nanoscale surface roughness can lead even to superhydrophobicity, the control of wettability via control of the nanostructure of surfaces is far from trivial.31,33–35,43,45–47 Therefore, we propose here decorating surfaces with preformed single distinct metallic nanoparticles (NPs) as an attractive route to control surface wettability by varying the coverage and size of the deposited NPs, and subsequently only the single scale nanoscale surface roughness. The challenge in forming hydrophobic surfaces from hydrophilic materials, as holds for metallic NPs oxidized at their outer surfaces, lies also in designing surface topographies that will lead to very high but stable contact angles. For this reason in order to avoid having different surface chemical compositions, samples were made with Cu NPs deposited onto flat copper surface (roughness much lower than the deposited NP sizes). In addition, comparison is made with the same Cu NPs deposited on oxidized silicon wafers and on polished Teflon surfaces.
2. Experimental methods
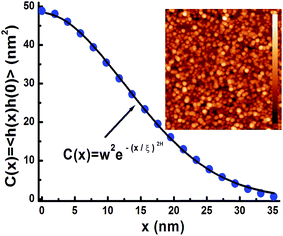
The nanoparticles studied in this research were produced by using plasma sputtering in a home-modified Mantis Nanogen 50 unit (see ESI†).48 A 2-inch silicon wafer was prepared for samples by coating it with a homogeneous 20 nm thick layer of copper as a starting (relatively flat) substrate surface. The homogeneity and roughness of the surface were assessed with a Veeco Nanoscope V atomic force microscope (AFM) in combination with Nanoscope Analysis v1.4 image analysis software. The first set of samples were all made using the same settings to ensure the NPs were of the same size, and only the deposition time was varied between samples to get varying degrees of coverage on the surface. For the second set of samples the deposition time was kept the same to keep the same degree of coverage, but other settings were varied in order to obtain varying size NPs. In addition, transmission electron microscope (TEM) samples underwent deposition simultaneously as those for the contact angle measurements, and they were analyzed in an FEI Tecnai G2 20 TEM or a JEOL 2010 TEM to enable calculation of the surface coverage and measurement of the NP size (Fig. 3). The images produced by the TEM were analyzed with Image-Pro Plus v4.5 image processing software (see ESI† for various NP distributions).48The AFM images of all the samples, e.g. see Fig. 3, were taken over an area 2 μm2 to calculate the surface area difference (SAD) roughness and the root mean squared (RMS ≡ w) roughness. The SAD roughness was calculated by the Nanoscope image Analysis v1.4 software using the formula SAD = (Ra/Rp − 1) × 100% where Ra is the actual surface area and Rp the projected surface area. Correlation function analysis from the AFM topography data, as in Fig. 3, yielded all necessary roughness parameters (besides w, one obtains the roughness exponent H and the lateral roughness correlation ξ) to estimate the average local surface slope.49 The obtained average surface local slopes ρ = tan(φ) ≈ w/ξ were significant (φ ∼ 20°) indicating the formation of relatively steep local nanoscale topology.
Finally, the contact angle measurements (Fig. 4–6) were performed using a Dataphysics OCA25 system. An automated syringe dropped ∼2 μl droplets of pure water (MilliQ) on to the sample, where a high-speed camera recorded the pictures over a period of several seconds and fed them through to the Dataphysics SCA202, v4.1.17 build 1024 image processing software. The values of the contact angle were obtained via a direct fit for the interface region only and a fit using the Young–Laplace (YL) equation based on shape analysis of a complete drop (see Fig. 4 for comparison of both methods).50–52 For every sample the CA measurements were repeated and averaged from seven drops of water.
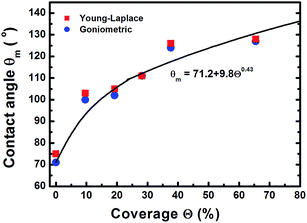 | ||
| Fig. 4 Dependence of contact angle on the coverage of Cu NPs, all having similar sizes of ∼12 nm, on flat Cu surfaces. | ||
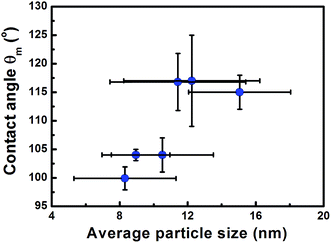 | ||
| Fig. 5 Dependence of contact angle on the particle size for similar NP coverages of ∼40% on flat Cu surfaces. | ||
3. Results and discussion
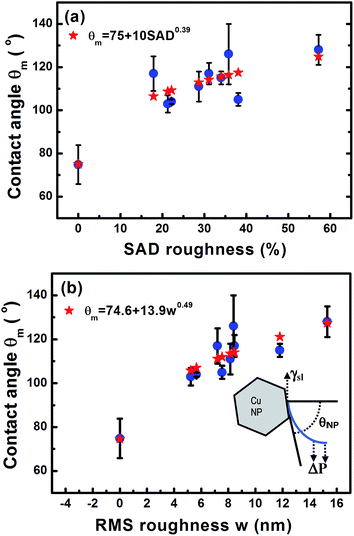
Fig. 1 illustrates that deposition of a moderate NP coverage (∼35%) on a hydrophilic surface (e.g. Si-oxide) leads to fast transition to a hydrophobic surfaces, while if NPs are deposited on hydrophobic surfaces (e.g., as Teflon) the effect is less pronounced. However, at elevated NP coverages (>80%) then the surfaces become superhydrophobic (∼150°) with the NP topology dominating the wetting state irrespective of the underlying substrate. Moreover, the contact angle of a water droplet on the bare oxidized Cu substrate was measured to be ∼75°, which is similar to the contact angle on flat lotus leave wax ∼74°,39 and increased by subsequent deposition of NPs (which are also surrounded by an oxide shell48). Fig. 4–6 illustrate in more detail the relation between coverage, surface roughness (SAD and RMS), and contact angle. The contact angles were measured after sufficient time for the droplet to adjust to its final shape. The error bars in the graphs represent twice the calculated standard deviation of the contact angles measured.The measured contact angle (θm) in Fig. 4 increases non-linearly with NP coverage (Θ) above the value of bare surface following a power law behavior with coverage as θm ∼ Θ0.43. The measured contact angle was ∼130° at coverage of Θ ∼ 65.5%, which is as expected below the superhydrophobic limit ∼150°. On the other hand in order to investigate the influence of particle size, the NP surface coverage (which is difficult to control precisely) was kept ∼40%. The measurements in Fig. 5 imply that larger particles at the same coverage lead to a higher contact angle. If we investigate further the relation of the contact angle with SAD and RMS roughness, then, as shown in Fig. 6, similar power law dependences emerge θm ∼ SAD0.39 and θm ∼ w0.49, respectively. If we define the rough surface area as  , where h(
![[r with combining right harpoon above (vector)]](https://www.rsc.org/images/entities/i_char_0072_20d1.gif) ) is the local surface height at the lateral position
) is the local surface height at the lateral position ![[r with combining right harpoon above (vector)]](https://www.rsc.org/images/entities/i_char_0072_20d1.gif) = (x,y), then for relatively weak local roughness (ρ ≈ w/ξ ≪ 1) we have after expansion RA ≈ RP(1 + ρ2/2…) with RP = ∫d2
= (x,y), then for relatively weak local roughness (ρ ≈ w/ξ ≪ 1) we have after expansion RA ≈ RP(1 + ρ2/2…) with RP = ∫d2![[r with combining right harpoon above (vector)]](https://www.rsc.org/images/entities/i_char_0072_20d1.gif) .49,53,54 Thus we obtain for the SAD roughness (to lowest order) SAD ≈ (ρ2/2) ≈ w2/2ξ2. If we consider the power law dependence θm ∼ SAD0.39 from Fig. 6a, then we obtain θm ∼ w0.78 in qualitative agreement with the power law obtained in Fig. 6b taking into account that in the expansion for SAD more terms ϑ(w/ξ) are in principle necessary, since w/ξ has significant values (∼0.3) as shown for example by the AFM roughness analysis from Fig. 3.
.49,53,54 Thus we obtain for the SAD roughness (to lowest order) SAD ≈ (ρ2/2) ≈ w2/2ξ2. If we consider the power law dependence θm ∼ SAD0.39 from Fig. 6a, then we obtain θm ∼ w0.78 in qualitative agreement with the power law obtained in Fig. 6b taking into account that in the expansion for SAD more terms ϑ(w/ξ) are in principle necessary, since w/ξ has significant values (∼0.3) as shown for example by the AFM roughness analysis from Fig. 3.
Although one would think that a water drop on a rough surface is more likely to be in a Cassie–Baxter (CB-) state, the water droplets here appear to be in a Wenzel (W-) state. This conclusion is drawn empirically from the fact that as the water droplets were evaporating the area where they were making contact on the surface remained constant, meaning that the contact angle decreased with droplet evaporation time, as well as droplets remained pinned onto the surface independent of surface inclination and dynamic agitation.32,45 However, more justification is necessary, because the weight of the liquid droplets used for the contact angle measurements causes only a pressure of at most several tens of Pascals (N m−2), which is insufficient to force liquid into surface nanocrevices. The transition between the CB- and W-states is determined from the Laplace pressure ΔP = Pliquid − Pair (assuming no drop impact as is the case here), which is the main contribution in terms of external forces.38–45 It can induce the CB–W transition either via de-pinning from the apex of surface features (if the contact angle formed by the liquid–air interface is greater than the maximum contact angle that can be sustained on the surface features), or via the sagging mechanism if liquid can reach the bottom of the surface. Even when a liquid–air interface can remain pinned at feature tops, the transition to the Wenzel state is possible.61 This is most likely to occur in our case taking into account the small groove depth of ∼50 nm (e.g., see the scale bar of the AFM image in Fig. 3).
Scanning electron microscopy investigation of the Si surfaces with high NP coverage (e.g., ∼85% in Fig. 1) after the liquid drops were evaporated, see Fig. 7, showed that we deal with a rather complex structure where the outer part of the drop is in a W-like state, while air pockets still persist within the middle part of the drop which thus remains in a CB state (Fig. 7d). Moreover, in front of the drop circumference it appears that a fully wetted area with size Dw ∼ 5 μm (see Fig. 7c) had been formed, while after water evaporation the area where a W-state persisted the surface features strongly altered leading to complete removal of NPs or to their coalescence to larger structures. However, within the central area, where a CB-state persisted, the surface NP structure is significantly less affected though alterations of the NP structures still occurs (see ESI Fig. B4†).
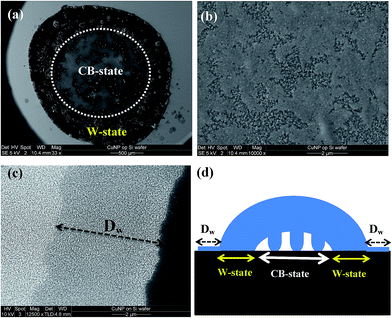 | ||
| Fig. 7 Signatures of droplet evaporation for Cu NP/Si surfaces with high (∼85%) NP coverage (see Fig. 1) obtained with scanning electron microscopy (SEM): (a) large overview with the CB-state indicated for clarity with a circle, and the W-state occurring within the dark area having lots of debris, (b) higher resolution area of the NP topography within the CB-state area, (c) completely wetted area of NPs in front of the W-state area, (d) diagram explaining the W- and CB-state formation underneath the liquid drop. | ||
Since the NP surfaces are hydrophilic (at least an oxidized metal shell is present around the NP), they attract water forming nanocapillaries through the surface crevices and nanoporous NP assembly. As a result the pressure difference over the water–air interface increases driving the interface down more into the space between the NPs. Eventually the hydrophobic state collapses and water penetrates close to the bottom of the structures.55–60,62,63 The vertical force due to pressure on the hanging air–water interface in a surface crevice is the Laplace pressure ΔP multiplied by the horizontal projection area Aaw of the air–water interface. This force in effect balances the vertical component of the surface tension, γsl, along the wetting line at the NPs top assuming an angle θNP that the vector tangent to the interface and normal to the boundary forms with the xy-plane (the contact angle is θNP + 90°, inset Fig. 6b).55–57 Therefore we obtain ΔP = γsl![[thin space (1/6-em)]](https://www.rsc.org/images/entities/char_2009.gif) sin
sin![[thin space (1/6-em)]](https://www.rsc.org/images/entities/char_2009.gif) θNP(SNPS/Aaw), with SNPS the arc-length of the section of the boundary associated with the contact line between NPs.55 Thus the maximum Laplace pressure (θNP = 90°) is
θNP(SNPS/Aaw), with SNPS the arc-length of the section of the boundary associated with the contact line between NPs.55 Thus the maximum Laplace pressure (θNP = 90°) is
| ΔPmax = γsl(SNPS/Aaw). | (1) |
For an estimation of ΔPmax we considered a surface consisting of a square array of cylindrical NPs of top diameter D at a separation that of the lateral correlation length ξ obtained by AFM analysis (see Fig. 3). Thus we have ΔPmax ≈ γslπD/(ξ2 − πD2/4),56 where with D ≈ ξ ≈ 18 nm (see Fig. 3) and γsl = 72 mN m−1 (ref. 64) we obtain ΔPmax ≈ 5.7 × 10⁷ N m−2 ≈ 5.7 × 10² Atm. This pressure is much higher if we compare it with the internal Laplace pressure ΔPd ≈ 1.4 × 10² N m−2 of a spherical water drop of radius R ∼ 1 mm, which is used for the contact angle measurements.64
Moreover, the Laplace pressure is high enough to push liquid into the crevices in agreement also with former studies on nanostructured surfaces.31 Indeed, these pressures, if we compare with the SEM results in Fig. 7, can generate forces to cause NP rearrangement and fusion within the outer Wenzel area around the droplet (Fig. 7d) during the drying process. However, the central region of the droplet (after drying is completed, Fig. 7b) indicates less drastic NP rearrangement. Our hypothesis is that the initial wetting and superhydrophobic state is not based on this rearrangement, because it occurs in a later stage during drying of the droplets.
Finally, attempts were also made to investigate the influence of additional surface roughening on lateral length scales of the order of microns (having significant RMS roughness in the range ∼200–800 nm, see Fig. C1 and Table C1 in ESI† prior to NP deposition. The aim was to achieve a hierarchical surface roughness containing two distinct (micron and nanometer) length scales. These micron scale roughened Si-oxide surfaces had prior to NP deposition contact angles ∼40–45°, while after NP deposition they were increased at most up to ∼108° for NP coverages in the range ∼20–40%, and comparable to intermediate coverages for the relatively flat surfaces. Thus, NPs increased again the contact angle and these results demonstrate that NPs continue to play a dominant role despite the underlying presence of rough surface features.
4. Conclusions
In conclusion, we demonstrated that superhydrophobicity can be induced by roughness on a single nanometer length scale with metal nanoparticles decorated surfaces. This roughness provides sufficient pinning of the contact line so that the superhydrophobic state is approached for elevated (hydrophilic) nanoparticle coverages independent of the initial type of surface (for an overview see Fig. 8) ensuring trapping of water droplets. Indeed, our studies indicate that the water droplets are in a Wenzel state at their outer part where locally nanocapillarity can force liquid into crevices between nanoparticles and push trapped air within the center of the droplet forming a Cassie–Baxter state (cf.Fig. 7c). In fact, the local Laplace pressures are high enough to favor the formation of a Wenzel state at least, as our estimates indicate, for a part of the water droplet. Independent of the exact details, our approach to alter the wetting state and induce droplet trapping is straightforward without involving special micro/nano (hierarchical) structuring facilities but instead using direct single distinct nanoparticle deposition onto any type of surface (hydrophilic and/or hydrophobic). Further studies are in progress to address issues related to oleophobic and omniphobic behavior.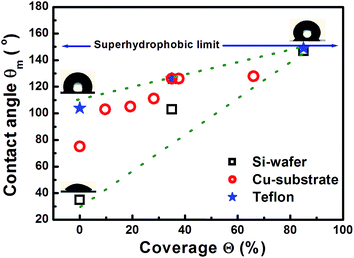 | ||
| Fig. 8 Overview of all contact angles for the different substrates showing the transition towards the superhydrophobic surface state at high NP coverages, irrespective of the initial type of surface. | ||
Acknowledgements
We would like to acknowledge support by the Zernike Institute for Advanced Materials, University of Groningen Netherlands. Furthermore the useful discussions and suggestions by S. Dietrich and A. Giacomello, and finally H. Hauger from Advanced Wet Technologies GmbH for supplying substrates for contact angle measurements on pre-roughened surfaces.References
- P. G. de Gennes, Rev. Mod. Phys., 1985, 57, 827–863 CrossRef CAS.
- John C., Berg Wettability: 9780824790462 http://www.bookdepository.com/Wettability/9780824790462?b=-3%26t=-26#Bibliographicdata-26 accessed October 24, 2014.
- Rowlinson J. S. and Widom B., AbeBooks http://www.abebooks.com/book-search/author/rowlinson-j-s-and-widom-b/ accessed October 24, 2014.
- Modern Approaches to Wettability Theory and Applications, ed. G. I. Loeb and M. E. Schrader, Springer Verlag, 2014 Search PubMed.
- Soft interfaces, The 1994 Dirac memorial lecture/P.G. de Gennes. - Version details - Trovehttp://trove.nla.gov.au/work/15894919?q=+%26versionId=18657496accessed Oct 24, 2014 Search PubMed.
- Y.-S. Ding, X.-F. Shen, S. Gomez, H. Luo, M. Aindow and S. L. Suib, Adv. Funct. Mater., 2006, 16, 549–555 CrossRef CAS PubMed.
- K. Ichimura, S.-K. Oh and M. Nakagawa, Science, 2000, 288, 1624–1626 CrossRef CAS.
- H. Gau, S. Herminghaus, P. Lenz and R. Lipowsky, Science, 1999, 283, 46–49 CrossRef CAS.
- J. D. J. S. Samuel, P. Ruther, H.-P. Frerichs, M. Lehmann, O. Paul and J. Rühe, Sens. Actuators, B, 2005, 110, 218–224 CrossRef CAS PubMed.
- H. Zhang, R. Lamb and J. Lewis, Sci. Technol. Adv. Mater., 2005, 6, 236–239 CrossRef CAS PubMed.
- W. Chen, A. Y. Fadeev, M. C. Hsieh, D. Öner, J. Youngblood and T. J. McCarthy, Langmuir, 1999, 15, 3395–3399 CrossRef CAS.
- B. Roe and X. Zhang, Text. Res. J., 2009, 79, 1115–1122 CrossRef CAS PubMed.
- N. Gao and Y. Yan, Nanoscale, 2012, 4, 2202–2218 RSC.
- X.-M. Li, D. Reinhoudt and M. Crego-Calama, Chem. Soc. Rev., 2007, 36, 1350–1368 RSC.
- C. R. Crick and I. P. Parkin, J. Mater. Chem., 2009, 19, 1074–1076 RSC.
- C. Neinhuis and W. Barthlott, Ann. Bot., 1997, 79, 667–677 CrossRef.
- R. G. Karunakaran, C.-H. Lu, Z. Zhang and S. Yang, Langmuir, 2011, 27, 4594–4602 CrossRef CAS PubMed.
- N. Gao, Y. Y. Yan, X. Y. Chen and D. J. Mee, Mater. Lett., 2011, 65, 2902–2905 CrossRef CAS PubMed.
- R. N. Wenzel, Ind. Eng. Chem., 1936, 28, 988–994 CrossRef CAS.
- A. B. D. Cassie and S. Baxter, Trans. Faraday Soc., 1944, 40, 546–551 RSC.
- M. Jin, X. Feng, L. Feng, T. Sun, J. Zhai, T. Li and L. Jiang, Adv. Mater., 2005, 17, 1977–1981 CrossRef CAS PubMed.
- S. Anand, A. T. Paxson, R. Dhiman, J. D. Smith and K. K. Varanasi, ACS Nano, 2012, 6, 10122–10129 CrossRef CAS PubMed.
- X. Chen, J. Wu, R. Ma, M. Hua, N. Koratkar, S. Yao and Z. Wang, Adv. Funct. Mater., 2011, 21, 4617–4623 CrossRef CAS PubMed.
- C.-H. Chen, Q. Cai, C. Tsai, C.-L. Chen, G. Xiong, Y. Yu and Z. Ren, Appl. Phys. Lett., 2007, 90, 173108 CrossRef PubMed.
- D. 't Mannetje, S. Ghosh, R. Lagraauw, S. Otten, A. Pit, C. Berendsen, J. Zeegers, D. van den Ende and F. Mugele, Nat. Commun., 2014, 5, 3559 Search PubMed.
- A. Tricoli, M. Righettoni and S. E. Pratsinis, Langmuir, 2009, 25, 12578–12584 CrossRef CAS PubMed.
- W. Barthlott and C. Neinhuis, Planta, 1997, 202, 1–8 CrossRef CAS.
- M. Callies and D. Quéré, Soft Matter, 2005, 1, 55–61 RSC.
- D. Quéré, Phys. A, 2002, 313, 32–46 CrossRef.
- Handbook of Nanostructured Biomaterials and Their Applications in Nanobiotechnology http://www.aspbs.com/nanobiomaterials.html accessed October 24, 2014.
- J. B. K. Law, A. M. H. Ng, A. Y. He and H. Y. Low, Langmuir, 2013, 30, 325–331 CrossRef PubMed.
- H. Teisala, M. Tuominen, M. Aromaa, M. Stepien, J. M. Mäkelä, J. J. Saarinen, M. Toivakka and J. Kuusipalo, Langmuir, 2012, 28, 3138–3145 CrossRef CAS PubMed.
- B. Bhushan and M. Nosonovsky, Philos. Trans. R. Soc., A, 2010, 368, 4713–4728 CrossRef CAS PubMed.
- N. Michael and B. Bhushan, Microelectron. Eng., 2007, 84, 382–386 CrossRef CAS PubMed.
- L. Feng, Y. Zhang, J. Xi, Y. Zhu, N. Wang, F. Xia and L. Jiang, Langmuir, 2008, 24, 4114–4119 CrossRef CAS PubMed.
- L. Cao, T. P. Price, M. Weiss and D. Gao, Langmuir, 2008, 24, 1640–1643 CrossRef CAS PubMed.
- A. Tuteja, W. Choi, J. M. Mabry, G. H. McKinley and R. E. Cohen, Proc. Natl. Acad. Sci., 2008, 105, 18200–18205 CrossRef CAS PubMed.
- Z. He, M. Ma, X. Xu, J. Wang, F. Chen, H. Deng, K. Wang, Q. Zhang and Q. Fu, Appl. Surf. Sci., 2012, 258, 2544–2550 CrossRef CAS PubMed.
- C. Ishino and K. Okumura, Eur. Phys. J. E, 2008, 25, 415–424 CrossRef CAS PubMed.
- A. Checco, B. M. Ocko, A. Rahman, C. T. Black, M. Tasinkevych, A. Giacomello and S. Dietrich, Phys. Rev. Lett., 2014, 112, 216101 CrossRef.
- L. Cao, H.-H. Hu and D. Gao, Langmuir, 2007, 23, 4310–4314 CrossRef CAS PubMed.
- Y.-T. Cheng and D. E. Rodak, Appl. Phys. Lett., 2005, 86, 144101 CrossRef PubMed.
- H. Huang and N. S. Zacharia, Langmuir, 2014 Search PubMed.
- A. Marmur, Langmuir, 2008, 24, 7573–7579 CrossRef CAS PubMed.
- S. Wang and L. Jiang, Adv. Mater., 2007, 19, 3423–3424 CrossRef CAS PubMed.
- C. W. Extrand, Langmuir, 2006, 22, 1711–1714 CrossRef CAS PubMed.
- H.-X. Ren, X. Chen, X.-J. Huang, M. Im, D.-H. Kim, J.-H. Lee, J.-B. Yoon, N. Gu, J.-H. Liu and Y.-K. Choi, Lab Chip, 2009, 9, 2140 RSC.
- G. H. ten Brink, G. Krishnan, B. J. Kooi and G. Palasantzas, J. Appl. Phys., 2014, 116, 104302 CrossRef PubMed.
- J. Krim and G. Palasantzas, Int. J. Mod. Phys. B, 1995, 09, 599–632 CrossRef CAS.
- http://www.surface-tension.org/news/54.html Young–Laplace equation fitting method (ADSA-PTM\nosupersub): using complete drop shape for measurement of static contact angle.
- Applied Surface Thermodynamics, ed. A. W. Neumann, R. David and Y. Zuo, 2nd edn, October 13, 2010, p. 161 Search PubMed.
- Z. Xu, Micro Nano Lett., 2014, 9, 6–10 Search PubMed.
- B. N. J. Persson, J. Chem. Phys., 2001, 115, 3840–3861 CrossRef CAS PubMed.
- G. Palasantzas, Phys. Rev. E: Stat. Phys., Plasmas, Fluids, Relat. Interdiscip. Top., 1997, 56, 1254–1257 CrossRef CAS.
- Q.-S. Zheng, Y. Yu and Z.-H. Zhao, Langmuir, 2005, 21, 12207–12212 CrossRef CAS PubMed.
- E. J. Lobaton and T. R. Salamon, J. Colloid Interface Sci., 2007, 314, 184–198 CrossRef CAS PubMed.
- P. Forsberg, F. Nikolajeff and M. Karlsson, Soft Matter, 2010, 7, 104–109 RSC.
- P. Papadopoulos, L. Mammen, X. Deng, D. Vollmer and H.-J. Butt, Proc. Natl. Acad. Sci. U. S. A., 2013, 110, 3254–3258 CrossRef CAS PubMed.
- D. Murakami, H. Jinnai and A. Takahara, Langmuir, 2014, 30, 2061–2067 CrossRef CAS PubMed.
- E. Bormashenko, A. Musin, G. Whyman and M. Zinigrad, Langmuir, 2012, 28, 3460–3464 CrossRef CAS PubMed.
- B. He, N. A. Patankar and J. Lee, Langmuir, 2003, 19, 4999–5003 CrossRef CAS.
- N. A. Patankar, Langmuir, 2010, 26, 8941–8945 CrossRef CAS PubMed.
- A. Giacomello, M. Chinappi, S. Meloni and C. M. Casciola, Phys. Rev. Lett., 2012, 109, 226102 CrossRef.
- http://en.wikipedia.org/wiki/Surface_tension .
Footnote |
| † Electronic supplementary information (ESI) available. See DOI: 10.1039/c5ra02348c |
| This journal is © The Royal Society of Chemistry 2015 |

