 Open Access Article
Creative Commons Attribution 3.0 Unported Licence
Microscopic study of the corrosion behaviour of mild steel in ionic liquids for CO2 capture applications†
I. S. Molchan*a,
G. E. Thompsona,
P. Skeldona,
R. Lindsaya,
J. Waltona,
E. Kouvelosb,
G. Em. Romanosb,
P. Falarasb,
A. G. Kontosb,
M. Arfanisb,
E. Siranidib,
L. F. Zubeirc,
M. C. Kroonc,
J. Klöcknerd,
B. Ilievd and
T. J. S. Schubertd
aCorrosion and Protection Centre, School of Materials, The University of Manchester, Manchester, M13 9PL, UK. E-mail: igor.molchan@manchester.ac.uk
bDivision of Physical Chemistry, Institute of Advanced Materials, Physicochemical Processes, Nanotechnology and Microsystems (IAMPPNM), NCSR “Demokritos”, 15310 Aghia Paraskevi Attikis, Athens, Greece
cSeparation Technology Group, Department of Chemical Engineering and Chemistry, Eindhoven University of Technology, Den Dolech 2, Eindhoven 5600 MB, The Netherlands
dIoLiTec, Ionic Liquids Technologies GmbH, Salzstraße 184, Heilbronn D-74076, Germany
First published on 9th April 2015
Abstract
Three 1-alkyl-3-methylimidazolium tricyanomethanide (TCM) ionic liquids (ILs) (alkyl = ethyl, butyl and hexyl) and one butyrolactam cation-based IL with a fluorinated anion were synthesised and tested in contact with mild steel (MS) at temperatures up to 80 °C. The corrosion behaviour was evaluated by monitoring the morphological changes on the steel surface after testing. Exposure of MS to the IL results in two main types of degradation that depend on the IL type. General etching over the macroscopic surface of the alloy was revealed for the IL with the fluorinated anion. The 1-alkyl-3-methylimidazolium TCM ILs promoted dissolution of MnS inclusions present in the steel. In the ILs with a shorter alkyl chain in the cation (alkyl = ethyl, butyl), the dissolution of MnS was accompanied by generation of corrosion products around the inclusion sites, which are mainly identified as magnetite and maghemite ferrites by micro-Raman spectroscopy. The rest of the macroscopic steel surface remains unaffected. Etching resulted in significant weight loss due to removal of material, whereas no significant weight loss was revealed following MnS dissolution. Butyrolactam cation-based IL severely attacks MS with the formation of a plethora of corrosion products including ferrites (mainly hematite), zinc oxide, sulphates and carbonates. Addition of 500 ppm sodium molybdate to the butyrolactam cation-based IL resulted in efficient inhibition of etching at both room temperature and 60 °C due to adsorption of molybdate on the alloy surface. A side effect of MS degradation is that the CO2 absorption capacity of the ILs can be severely reduced through the transfer of metal ions and corrosion products from the metallic surface to the liquid phase. Therefore, gravimetric CO2 absorption capacity and kinetic measurements on the selected 1-alkyl-3-methylimidazolium tricyanomethanide ILs before and after their contact with MS were also conducted with the purpose to unveil and study these side effects. Moreover, CO2 absorption experiments of the butyrolactam cation-based IL before and after contact with MS, as well as in the presence of a sodium molybdate inhibitor, showed that sodium molybdate has the capacity to limit significantly the etching rate without affecting the CO2 capture performance of the IL.
A Introduction
Room temperature ILs, i.e. salts with melting points below 100 °C, have received increasing academic and industrial interest since their properties may be tuned by selection of an appropriate combination of anion and cation. ILs have potential for diverse applications, including organic synthesis, gas separation, catalysis, electrochemistry, nanotechnology, lubrication, energy and others. Their major properties may be summarised as follows:1 (i) the cation is quite large and the anion is not necessarily large (it may comprise one atom); (ii) they are good solvents for a large variety of organic and inorganic substances; (iii) the vapour pressure is negligible, with a value of the order of 10−11 to 10−10 mbar;2 (iv) the viscosity is typically below 100 cP; (v) the liquids have relatively high specific conductivities, usually up to 10 mS cm−1; and (vi) a wide electrochemical window is displayed, typically ranging from 4 to 5 V, and up to 7 V for some ILs.3 Task-specific ILs are considered as candidate replacements for amine-based solvents for CO2 scrubbing applications and much effort has been undertaken to study the absorption capacity of a number of ILs.4 However, due to their relatively high viscosity and slow CO2 absorption rate, especially when the capture mechanism is physisorption, solvents for CO2 capture based on mixtures of ILs with amines and water attract increasing attention.5,6 ILs were also considered as additives to amine-based CO2 capture solvents to reduce corrosion attack. In many studies, ILs are claimed to be environmentally-friendly and low-toxicity substances. This statement is generally related to the low vapour pressures of the ILs and, therefore, expectations of low environmental impact. Nevertheless, numerous studies show that many ILs are toxic for terrestrial and aquatic organisms, and may be potentially toxic for humans and have poor biodegradability.7 These issues, however, may be improved by tailoring the structure of the anion and cation, and are under extensive study. Further, if ILs are used as a component of more complex systems, for instance in a mixture with other ILs and amines for CO2 scrubbing applications, the toxicity of the entire system should be evaluated rather than the toxicities of the individual components.8In many applications, ILs will be in contact with metallic materials such as pipes, vessels and reaction chambers, which necessitates good understanding of their interactions with the metallic materials used for construction of installations that operate in IL-based environments. MS is an important structural material that is used for building many metallic products. It contains a low quantity of carbon, typically 0.1–0.25%, and combines relatively high strength and low cost. However, it is prone to corrosion and proper measures should be undertaken to protect the alloy in the operating environment, e.g. application of protective coatings or inhibitors. Many studies report on the inhibiting properties of ILs in acidic environments. Acid solutions are widely used in industry for cleaning, pickling, de-scaling and other purposes, and it is important to reduce corrosion attack on metallic structures. It was demonstrated that small additions of certain ILs to hydrochloric or sulphuric acid allowed inhibition efficiencies for MS to reach the values of 88 and 95% respectively.9 The inhibiting effect was attributed to physisorption or chemisorption of ILs on the surface determined by the value of the Gibbs free energy of adsorption of the IL on the metallic surface.10 Addition of 30 wt% [C2mim]OAc and 3 wt% [C2mim]BF4 to CO2 or CO2/O2 loaded aqueous monoethanolamine (MEA) solution reduced the corrosion rate of MS from 19.23 to 2.29 mpy and from 113.2 to 0.22 mpy respectively.5,11 The corrosion behaviour of MS in neat ILs is also addressed in the literature showing, for instance, that the presence of halogen atoms in the IL or increased temperature may increase the corrosivity of the IL.12 Depending on the nature of the cation and anion comprising the IL and the operating conditions, e.g. temperature, pressure, the presence of dissolved gases, water and impurities, the IL may attack metallic materials severely or cause negligible changes. Limited information is available in the literature on reduction of the corrosion susceptibility of metals in the ILs by addition of inhibitors. Uerdingen et al.13 reported that addition of 1H-benzotriazole to the IL, comprising a cation based on quaternary ammonium and methyl sulphate anion, inhibited copper corrosion significantly, whereas it highly stimulated the attack of MS.
In steels, pitting corrosion is initiated around the MnS inclusions if they are classified as active, which was reviewed in detail by Wranglen.14,15 The present authors studied recently the MS behaviour in 1-alkyl-3-methylimidazolium based ILs (alkyl = ethyl, butyl, hexyl and octyl) with the TCM anion at 80 °C for a duration up to 10 days utilising scanning electron microscopy and micro-Raman mapping.16 These ILs are capable of capturing CO2 by physisorption and exhibit CO2 absorption capacities that are higher compared to those of most of the physisorbing ILs examined to date.17 It was revealed that corrosion processes are initiated around the MnS inclusion sites. Corrosion proceeds through dissolution of MnS inclusions, with or without formation of corrosion products and depends on the length of alkyl chain in the cation and the presence of dissolved residual water and oxygen. The corrosion products were identified as magnetite (Fe3O4) and maghemite (γ-Fe2O3).
Herein, the corrosion behaviour of MS in the ILs exclusively developed for post-combustion CO2 capture processes by IoLiTec Ionic Liquids Technologies GmbH is reported. The current study shows that MS withstands long-term immersion in 1-alkyl-3-methylimidazolium TCM at 80 °C for 30 days. It is also shown that dissolution of MnS inclusions does not affect the CO2 absorption capacity and the rate of absorption in the TCM anion-based ILs. Identification of oxidation products has been done by EDX, XPS and micro-Raman imaging. In particular, magnetite and maghemite at the MnS inclusion sites are observed solely in the case of ILs with shorter alkyl chain lengths (ethyl and butyl) and can be related to a minor decrease of their CO2 absorption efficiency.
In contrast, IL with butyrolactam cation and fluorinated anion attacks MS severely even at room temperature, causing modification over the macroscopic surface of the alloy, with many corrosion products. However, the attack may be effectively mitigated by addition of molybdate to the IL. Therefore, the effect of inhibitor addition on the CO2 absorption capacity and the rate of absorption in the butyrolactam IL was also examined. The results show that sodium molybdate can be safely used as an inhibitor to limit MS etching without compromising the CO2 capture efficiency of the IL.
B Experimental
The mild steel used in the study (0.13–0.18% C, max. 0.40% Si, 0.7–0.9% Mn, max. 0.05% S, max. 0.05% P and Fe balance) was supplied by RS Components (UK) as rods of 10 mm diameter. The rods were cut into disks of approximately 4–5 mm thickness for polishing across the rolling direction and into 40 mm length pieces for polishing along the rolling direction. The specimens were mechanically ground using, consecutively, P240, P600, P1200 and P4000 emery papers followed by polishing with 3 and 1 μm diamond pastes on a velvet pad with an ethanol-based lubricant. The resultant roughness, Ra, measured by a Contour GT (Veeco) white light interferometer, was approximately 8 nm.The following types of ILs, developed and supplied by Iolitec, were used in the experiments:
1-Ethyl-3-methylimidazolium tricyanomethanide, [C2mim]TCM.
1-Butyl-3-methylimidazolium tricyanomethanide, [C4mim]TCM.
1-Hexyl-3-methylimidazolium tricyanomethanide, [C6mim]TCM(s) (standard batch).
1-Hexyl-3-methylimidazolium tricyanomethanide, [C6mim]TCM(r) (with reduced water content). This IL was synthesised using the same procedure as the IL from the standard batch. However, prolonged drying was applied, which led to reduction of the water content from 320 ppm for the standard batch to 220 ppm for the batch with reduced water content.
Pyrrolidium-2-one bis[(trifluoromethyl)sulfonyl]imide, [BHC]BTA.
The synthesis procedures of the ILs with TCM anion and [BHC][BTA] have been previously described by the authors.8,16
Sodium molybdate Na2MoO4·2H2O (≥99.0% purity, Sigma-Aldrich) was used to study its inhibition effect with [BHC]BTA. This IL was selected for testing with molybdate inhibitor because neat [BHC]BTA attacks severely MS. The MS specimens were sealed individually with each IL in 30 ml autoclavable plastic bottles in the ambient atmosphere; from 4 to 20 ml of the IL per sample was used. For addition of the inhibitors to the ILs, the required amount of sodium molybdate was dissolved in deionised water and then added dropwise to the IL to obtain 500 ppm of molybdate in the IL, followed by sonication in a U100 Ultrawave benchtop ultrasonic bath for 30 min. Two droplets of aqueous solution of molybdate were added to 10 ml of the IL. The immersion testing was carried out at room temperature (RT), 60 °C and 80 °C for durations ranging from 1 to 30 days. The weights of specimens before and after immersion testing were monitored, employing an MS105DU analytical balance (Mettler Toledo) with an accuracy of 0.01 mg.
A Zeiss Ultra-55 scanning electron microscope was employed for examination of the surface morphology, local chemistry by energy dispersive X-ray spectroscopy (EDX) and surface mapping by electron backscattered diffraction (EBSD) of the samples. The microscope is equipped with SE1, SE2, BSE, EDX and EBSD detectors. Secondary (SE2) electron images were recorded with high Z-contrast at an acceleration voltage of 2 kV; the acceleration voltage was increased to 8–15 kV for EDX characterisation. No additional sputtering of carbon or gold was employed for examination of specimens.
The alloy specimens in the as-polished conditions and after testing in the IL with molybdate were analysed by X-ray photoelectron spectroscopy (XPS) using a Kratos Axis Ultra X-ray photoelectron spectrometer, equipped with a monochromatic aluminium X-ray source (Kα = 1486.6 eV) and a delay-line detector, with a dead time of 480 ns corrected by the acquisition software. The instrument was operated with a base pressure of 2.0 × 10⁻⁹ Pa. The analysis area of the specimen was 700 × 300 μm. Widescan spectra were recorded from 0 to 1000 eV kinetic energy using a 80 eV pass energy, with a step size of 0.8 eV, while high-resolution spectra were also obtained for C 1s, O 1s, F 1s, Mo 3d and Fe 2p, using a 20 eV pass energy and a step size of 0.1 eV. Analysis was performed using CasaXPS software. The binding energy scale was calibrated with respect to the C 1s signal at 285 eV. Curve fitting of the spectra was done by a mixture of Gaussian and Lorentzian functions on a Shirley-type background.
For the micro-Raman study, the corrosion products of three mild steel specimens immersed in [C2mim]TCM, [C4mim]TCM and [C6mim]TCM(s) for a period of 30 days as well as one specimen immersed in [BHC]BTA for 3 days at RT were examined. All the spectra were acquired on a Renishaw inVia reflex Raman microscope using a solid state laser excitation source operating at 514.4 nm. The laser beam was focused on a spot of 0.7 μm2 by means of 100× objective at a power below 0.5 mW to avoid local heating and phase transformation of the corrosion products. The step size for the Raman mapping was adjusted to 0.5 μm. In addition, Raman mapping of the most characteristic and intense modes in terms of signal to baseline ratio was employed to study the distribution of the oxides through representative craters for each sample.
The CO2 solubilities in all examined ILs have been experimentally determined by applying the gravimetric method in two different setups. Both a magnetic suspension balance (MSB, from Rubotherm GmbH) and a force restoration full beam microbalance system (IGA from Hiden Isochema) were used. In the gravimetric method, the change in the weight of the solvent is recorded as function of the gas pressure and time. It should be noted that before applying these setups to investigate the CO2 absorption capacity and kinetics of the new ILs, the accuracy of the measurements was determined by performing experiments with one of the mostly investigated and IUPAC designated IL/CO2 system, involving 1-hexyl-3-methylimidazolium bis[(trifluoromethyl)sulfonyl]imide ([C6mim][Tf2N]/CO2), for comparing experimental results obtained from different research groups. The deviations between the results obtained with the two different setups and between our results and those found in the literature18 were below 3% (ESI, Fig. S1†).
The two gravimetric setups have also been used to determine the absorption kinetics. For this purpose, mass uptake data versus time were acquired for each equilibrium pressure and temperature, and corrected for buoyancy. For the definition of the diffusion coefficient, D, of dissolved CO2 in the examined ILs, the transient curves of absorption (mass uptake vs. time) were fitted to the appropriate solution for the transient absorption curve, holding for diffusion rate controlled gas absorption in liquid films exhibiting one gas–liquid interface:
 | (1) |
![[small script l]](https://www.rsc.org/images/entities/char_e146.gif) is the liquid film thickness.
is the liquid film thickness.
The solution is derived from the transient diffusion equation according to a number of assumptions as follows:
(1) Gas dissolves through a one-dimensional (vertical) diffusion process, in which there is no convective flow in the liquid.
(2) A thin boundary layer between the gas and liquid phases exists where the thermodynamic equilibrium is instantly established with the saturation concentration and where the concentration is constant all the time at a given temperature and pressure.
(3) Temperature and pressure are kept constant.
(4) The uptake occurs over a small change in the absorbed phase concentration and thereby constant diffusivity is assumed.
(5) The uptake within the absorbent sample is very small compared with the capacity of the system, which is implicitly valid in the Henry's law regime, i.e. for a very dilute absorbed phase.
It should be stated that due to the very long period required to complete an absorption isotherm up to 2 MPa, most of the pressure steps were not sufficiently small to be consistent with the assumption number four. Thereby, the diffusivity cannot be constant as pressure increases and the occurrence of convective flow (assumption number one) can not be avoided. For that reason, we prefer further to use the term “apparent diffusivity” instead of “diffusivity” and as an indicator to compare the kinetics of CO2 absorption before and after contact of the IL with the MS.
C Results and discussion
C1 MnS inclusion-induced corrosion in [Cnmim]TCM ILs
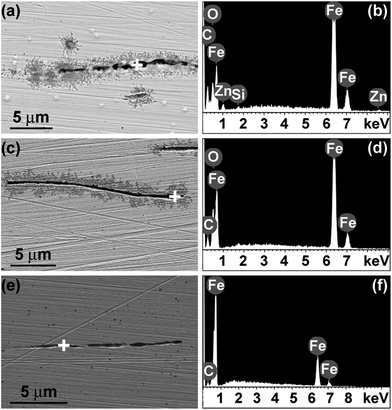
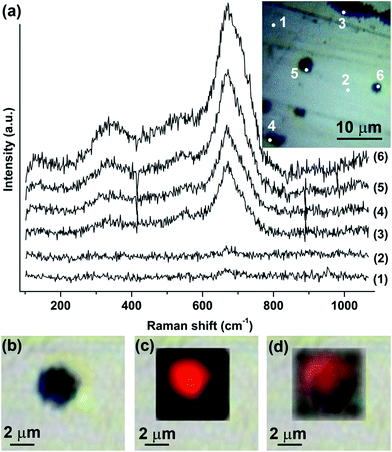
Following the recent work of the authors on the corrosion behaviour of MS immersed in [Cnmim]TCM ILs (n = 2, 4, 6 and 8),16 the duration of immersion was increased to 30 days to evaluate the long-term inhibiting ability of the ILs. Further, the MS specimens were polished in the rolling direction to simulate real conditions in the CO2 scrubbing installation, where the major parts will presumably be assembled from rolled steel plates. The MnS inclusions in the rolling direction appear as thin filaments and may contain various elements such as silicon, aluminium, oxygen and others.19 Fig. 1 shows scanning electron micrographs and related local EDX spectra of the surface of MS after immersion in [C2mim]TCM, [C4mim]TCM and [C6mim]TCM(s). Elongated cavities of approximately 20 μm length and 200–600 nm width, generated as result of dissolution of the MnS inclusions, are evident in the micrographs (Fig. 1a, c and e). The oxygen peaks in the EDX spectra of Fig. 1b and d are attributed to the presence of corrosion products, e.g. iron oxides. The absence of the oxygen peak in the spectrum recorded in the cavity of MS after testing in [C6mim]TCM(s) (Fig. 1f) suggests that the formation of corrosion products is strongly inhibited by the IL with an increased length of the alkyl chain in the cation during long-term immersion for 30 days. No manganese and sulphur were detected in the cavities, indicating that the MnS inclusions were dissolved. The MnS inclusions in the rolling direction have curved shapes, and the cavities shown in the micrographs may extend further beneath the surface. Cavities with lengths above 100 μm were observed by X-ray ultra-microscopy, XuM, using a Quanta FEG 250 instrument (ESI, Fig. S2†). The spectra recorded in the metal matrix area are identical for all specimens and exhibit a series of similar iron peaks, thus confirming that no or negligible amounts of corrosion products were generated over the macroscopic surface of the alloy. Surprisingly, zinc was detected locally in the cavities and at the circular-shaped features of submicron dimensions of brighter appearance encountered occasionally on the surface (Fig. 1b). The presence of zinc can be attributed to contamination of the [C2mim]TCM; however, it is not possible to define from EDX which form of zinc-containing compound is generated.The investigation with Raman spectroscopy was focussed on the examination of nearly-circular cavities of small dimensions generated onto the surface of MS. The large, elongated cavities were avoided as they can hamper the focusing of the laser beam on the specimen surface. In order to ensure the reproducibility of the Raman spectra several spots at the craters were selected for each specimen. Further, the spots on the intact metal areas were examined as reference. A typical image with spots of the specimen immersed in [C2mim]TCM is shown in the inset of Fig. 2, while the corresponding images for the specimens immersed in [C4mim]TCM and [C6mim]TCM(s) are shown in Fig. S3a and c (ESI†). The Raman spectra revealed three broad bands which peak at around 350, 535 and 672 cm−1 as shown in Fig. 2a for [C2mim]TCM and in Fig. S3b and d (ESI†) for [C4mim]TCM and [C6mim]TCM(s) respectively. The characteristic broad band at 672 cm−1 is highly asymmetric at the high frequency range and is attributed to the superposition of the intense A1g mode of magnetite (Fe3O4) at 669 cm−1 and a broad band of maghemite (γ-Fe2O3) at 720 cm−1 as a secondary phase.20 As expected, the lager craters from the most corrosive environment of [C2mim]TCM provided the most intense Raman signal, corresponding to the increased amounts of corrosion products. Conversely, the MS specimen immersed in the [C6mim]TCM efficiently inhibits corrosion and displayed the weakest intensity of the iron oxide Raman modes. Furthermore, it should be mentioned that Raman is not able to resolve ZnO related modes, which are probably of low intensity and overlapped with the magnetite and maghemite modes at the same wavenumber ranges.
In addition, Raman mapping of the characteristic and intense mode centred at 672 cm−1 in terms of signal to baseline ratio was employed to study the distribution of the oxides through representative craters for each specimen. The signal was strong in the middle of the craters and was diminished at the far intact metal areas (ESI, Fig. S4b, d and f†). The distribution of oxides across the craters is illustrated by the chromatic scale in the Raman maps of Fig. S4a, c and e (ESI†) and is reproduced in Fig. 2c for [C2mim]TCM. Fig. 2b shows the optical image of a selected crater of MS immersed in [C2mim]TCM. In Fig. 2c, the 672 cm−1 Raman signal to baseline ratio mapping of the crater and its surrounding area is displayed where the red colour corresponds to the presence of oxides and the black colour to their absence. It is evident in the blended image of Fig. 2d that the oxides are distributed evenly only across the craters. It should be noted that the results of micro-Raman mapping are in good agreement with the EDX data and confirm the less corrosive nature of IL with longer alkyl chain in the cation [C6mim]TCM(s) to MS.
Table 1 shows the weight changes during testing determined after 10 and 30 days of immersion. Rinsing with ethanol was applied after immersion, without additional scrubbing of the surface of the specimens. Weight changes occurred after 10 days of immersion in all ILs; the weight increased by 9.75 mg in [C2mim]TCM, whereas in [C4mim]TCM and [C6mim]TCM(s), the weight reduced by several hundred micrograms. Further increase of the immersion duration generally did not affect the weight of the specimens immersed in [C4mim]TCM and [C6mim]TCM(s), while it significantly reduced in [C2mim]TCM. Thus, the weight change trend in non-contaminated [C4mim]TCM and [C6mim]TCM(s) confirms the previous findings for immersion durations up to 10 days16 that the ILs cause generation of cavities due to dissolution of MnS inclusions, leaving the rest of the alloy surface mainly unaffected due to the inhibiting properties of ILs. Thus, for ILs with [C4mim] and [C6mim] cations, the major changes on the surface of MS occur at the beginning of immersion (presumably within 1 day) in the regions adjacent to MnS inclusions, thus leaving the specimen weight unaffected with increase of the immersion duration from 10 to 30 days. In contrast, relatively high weight gain in the first 10 days of immersion in the contaminated with zinc [C2mim]TCM may be explained by deposition of impurities on the surface. Further weight reduction is probably caused by their partial dissolution. However, additional study is required for precise interpretation of weight change in zinc-contaminated IL.
| [C2mim] | [C4mim] | [C6mim](s) | [C6mim](r) | |
|---|---|---|---|---|
| Before | 20.30011 | 19.98064 | 20.10528 | 19.54027 |
| 10 days | 20.30011 | 19.98041 | 20.10491 | 19.54037 |
| Difference | 0.00975 | −0.00023 | −0.00037 | −0.00010 |
| 30 days | 20.29973 | 19.98041 | 20.10493 | 19.54025 |
| Total difference | −0.00038 | −0.00023 | −0.00035 | −0.00002 |
The weight losses calculated from the weight changes after the 30 day immersion testing in non-contaminated [C4mim]TCM and [C6mim]TCM(s) are approximately 11 and 18 μg ml−1 of IL respectively. MnS is only slightly soluble in water, with a solubility of 4.7 μg ml−1.21 The water contents in [C4mim]TCM and [C6mim]TCM(s) determined by Karl Fischer titration after testing were approximately 2000 and 1500 ppm respectively. With the assumption that the weight loss is mainly caused by the dissolution of MnS inclusions and the inclusions are only soluble in water, theoretically, up to 9.4 and 7.05 ng ml−1 may be dissolved in [C4mim]TCM and [C6mim]TCM(s) respectively. However, the weight loss values are more than three orders of magnitude larger than those calculated from the MnS solubility in water that may be attributed to the solubility of inclusions in ILs. It should be noted that effort to limit dissolution of MnS inclusions was undertaken by deliberately dissolving MnS powder (325 mesh, 99.9% purity, purchased from Sigma-Aldrich) in [C4mim]TCM and [C6mim]TCM(s); the powder was added in amounts to obtain its concentrations in the ILs of 30, 150 and 300 μg ml−1 that are far above MnS solubility in water. It was supposed that dissolving of a relatively large amount of MnS in the IL will saturate the IL with MnS, which will prevent dissolution of MnS inclusions that may benefit the mechanical integrity of the alloy. However, the added powder after sonication remained mainly undissolved in the ILs. During immersion of MS in the IL with added MnS powder, the powder deposited on the MS surface, causing severe attack over the macroscopic surface of the alloy. Interestingly, the remaining excess of ILs with powder that were not used in immersion testing revealed clear appearances of the ILs after several months of storage. This confirms that MnS is soluble in ILs and the amount of MnS inclusions dissolved during immersion is more than three orders of magnitude greater compared with that deduced from the solubility in water. Further, the rate of MnS dissolution in ILs is slow and relatively large amounts of MnS may be dissolved during prolonged storage of the IL/MnS powder mixture.
Unexpected results were obtained after immersion testing for 30 days in [C6mim]TCM(r). Fig. 3a displays the undissolved elongated inclusion on the MS surface polished along the rolling direction after immersion; several near-circular-shaped inclusions of several hundred nanometre dimensions are also evident in the micrograph. In contrast to immersion in the ILs described previously, the intense sulphur and manganese peaks in the EDX spectrum recorded at the inclusion site suggest that the MnS inclusion remains undissolved (Fig. 3b). However, unexpectedly, an intense Kα silver peak centred at 2.96 kV is also present in the spectrum of the inclusion, whereas no silver was detected in the metallic matrix area, indicating that the IL was accidentally contaminated with silver ions. Deposition of silver occurs through a decoration reaction, which is involved in the silver decoration process developed by Schober and Dieker.22 This process is based on reduction of silver ions present in the electrolyte by adsorbed hydrogen atoms:
| Had → H+ + e−; | (2) |
| Ag+ + e− → Ag↓. | (3) |
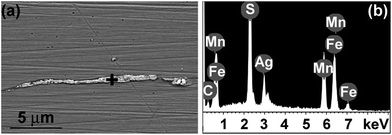 | ||
| Fig. 3 (a) Scanning electron micrograph of the surface of MS after immersion in [C6mim]TCM(r) at 80 °C for 30 days and (b) local EDX spectra recorded in the area marked by cross. | ||
This technique was applied, for instance, for hydrogen mapping produced at MnS inclusions in carbon steel23 or in crevices in iron,24 to study the distribution of hydrogen on the surface of platinum, palladium and steel of type 304,25 etc. In the IL, the following cathodic reaction was assumed to proceed at MnS inclusions:16
| 2H+ + 2e− → H2. | (4) |
Further, dissolution of the inclusions is realised through the reaction
| MnS + 2H+ → H2S + Mn2+. | (5) |
Hence, in this particular IL, silver ions consume the electrons released in the cathodic reaction and then silver crystals are deposited on the MnS inclusions that prevent their dissolution. The reduction in weight after 10 day immersion is smaller compared with [C6mim]TCM(s) and [C4mim]TCM that may be ascribed to partial dissolution of inclusions accompanied by silver deposition. The insignificant weight gain with further increase of immersion duration suggests that silver deposition dominates over dissolution of the inclusions and stops once the inclusion is completely covered by silver, thus preventing cathodic reaction.
C2 Effect of dissolution of MnS inclusions on the CO2 adsorption capacity and rate of [Cnmim]TCM ILs
As discussed previously,16 1 day immersion at 80 °C is sufficient for complete dissolution of the MnS inclusions. Thus, the amount of Mn2+ transferred to the liquid phase does not change significantly with increase of immersion time to 30 days as confirmed by weight monitoring. Further, the surface areas of the specimens were similar and all specimens were immersed in 20 ml of individual ILs, thus suggesting that the amounts of the released inclusions did not vary significantly in the individual ILs. The absorption isotherms obtained for [C2mim]TCM, [C4mim]TCM and [C6mim]TCM(s) in as-received conditions and after immersion testing with MS for 10 and 30 days are presented in Fig. 4. All ILs exhibited almost similar CO2 absorption capacities before and after immersion tests for 10 and 30 days, suggesting that dissolution of MnS inclusions had no significant effect on the CO2 absorption capacities.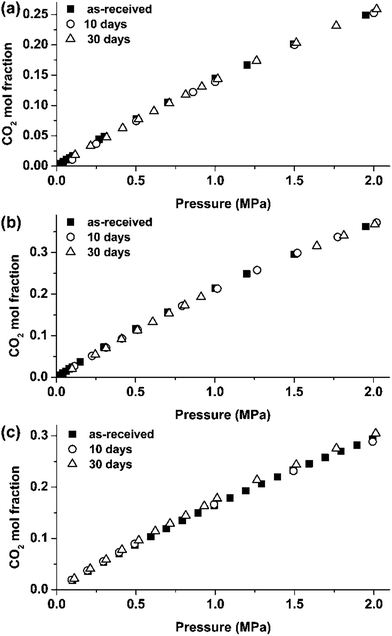 | ||
| Fig. 4 CO2 absorption isotherms of the ILs before and after their contact with mild steel for 10 and 30 days: (a) [C2mim]TCM, (b) [C4mim]TCM, (c) [C6mim]TCM(s). | ||
Examining the Henry's law constants, as calculated from the above isotherms at the low pressure region up to 0.5 MPa (Table 2), it could be stated that oxidation products generated in [C2mim]TCM and [C4mim]TCM caused a slight decrease of the CO2 absorption capacity in these ILs. Although the decrease is within the experimental error of the gravimetric setups used in the experiments (solubility deviation between the two setups is less than 3%), the general trend for [C2mim]TCM and [C4mim]TCM is an increase of the Henry's law constant after immersion testing while for [C6mim]TCM(s), which as already discussed, protects the alloy surface from the generation of oxidation products, the Henry's law constant remains stable or even decreases. Specifically, after the 30 days immersion test, the solubility of CO2 in [C2mim]TCM and [C4mim]TCM decreased by 5.9% and 3.5% respectively while for [C6mim]TCM(s) an increase by 3.5% was observed.
| Immersion time | H, MPa | Deviation, % |
|---|---|---|
| [C2mim]TCM | ||
| As-received | 6.44 (35 °C) | |
| 10 days | 6.36 | −1.24 |
| 30 days | 6.82 | +5.9 |
![[thin space (1/6-em)]](https://www.rsc.org/images/entities/char_2009.gif) |
||
| [C4mim]TCM | ||
| As-received | 4.27 (15 °C) | |
| 10 days | 4.53 | +6.0 |
| 30 days | 4.42 | +3.5 |
![[thin space (1/6-em)]](https://www.rsc.org/images/entities/char_2009.gif) |
||
| [C6mim]TCM(s) | ||
| As-received | 5.72 (35 °C) | |
| 10 days | 5.66 | −1.05 |
| 30 days | 5.52 | −3.5 |
The low sensitivity of the absorption capability in the presence of dissolved MnS inclusions and localised corrosion processes are undoubtedly of high importance for the applicability of the specific ILs in a CO2 capture process.
Interestingly, contamination of [C2mim]TCM with zinc also did not affect the absorption performance of the IL. The colour of [C2mim]TCM and [C4mim]TCM became appreciably darker after immersion, whereas the change of appearance of [C6mim]TCM(s) was less pronounced (Fig. 5). The [Cnmim]TCM ILs change appearance with the duration of exposure of elevated temperature. At 80 °C, the ILs become darker and the degree of darkening increases with the duration of exposure. Further, if the ILs are exposed to elevated temperature without the immersed alloy then the degree of darkening is slightly reduced compared with those with the immersed alloy. Fig. S5 and S6 (ESI†) show change of colours of [Cnmim]TCM ILs during exposure for 1 to 10 days at 80 °C with and without immersed MS specimens. Thus, it may be deduced that changes in the ILs take place at elevated temperature. These changes may not be necessarily related to degradation of the ILs. The ILs contain up to 2% impurities and, hence, these changes may also be attributed to impurity-related reactions. The increase of the degree of darkening of the ILs when in contact with MS may be possible due to (i) release of MnS inclusions, (ii) anodic reaction Fe → Fe2+ + 2e− at sulphur infected matrix surrounding MnS inclusion sites (solidified interdendritic residual melt),14 (iii) catalysing impurities related reactions by the presence of MS and (iv) combinations of these processes. Thus, taking into account that corrosion products were generated in both [C2mim]TCM and [C4mim]TCM the following processes may be responsible for the different absorption behaviour of these ILs, i.e. 5.6% reduction of the CO2 absorption capacity in [C2mim]TCM compared with the 3.5% reduction in [C4mim]TCM: (i) the presence of zinc-related impurities in [C2mim]TCM enhances degradation of absorption performance; (ii) decline of absorption capacity is intrinsic property of [C2mim]TCM. It may be concluded that control of impurities during IL production should be given special attention to avoid undesired effects that they can cause.
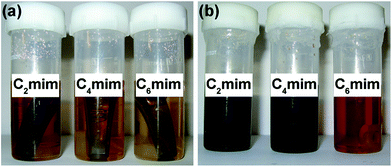 | ||
| Fig. 5 Appearance of [C2mim]TCM, [C4mim]TCM and [C6mim]TCM(s) (a) before and (b) after immersion testing at 80 °C for 30 days. The MS specimens immersed in the ILs are evident in the photograph (a). | ||
It is suggested that ILs do not degrade during immersion testing, which is supported by examining also the results of CO2 absorption kinetics (Fig. 6). The CO2/IL apparent diffusivity constants, D (m2 s−1), were not affected after the 10 and 30 day immersion tests that is indicative of the preservation of the integrity of the ILs. It should be noted that for the calculation of the apparent diffusion constants using eqn (1), the mass uptake over time is normalised over the total amount of absorbed gas at the specific pressure step and that the mass of the specimen has no contribution to the analysis of the results. Therefore, in this case, the analysis of the results is not biased by the existence of corrosion products in the IL.
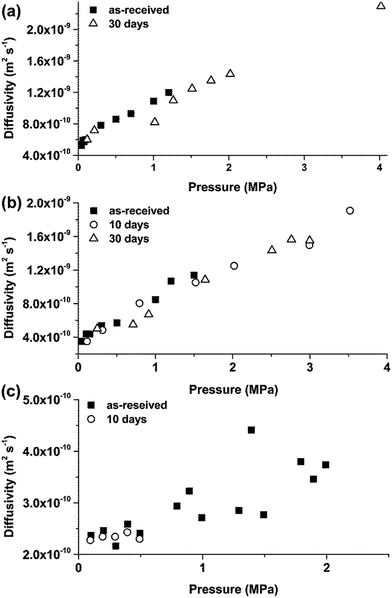 | ||
| Fig. 6 Apparent CO2 diffusivities for the ILs before and after immersion testing with mild steel: (a) [C2mim]TCM, (b) [C4mim]TCM, (c) [C6mim]TCM(s). | ||
C3 Selective etching in [BHC]BTA
The microstructure of the steels with low carbon contents such as MS comprises ferrite (α-Fe) and pearlite phases.26 Ferrite has a body-centred cubic crystal structure and less than 0.01% carbon may be dissolved in ferrite at room temperature. It is soft and ductile, and imparts these properties to the alloy. Pearlite has a lamellar structure comprising alternate layers of ferrite (88%) and cementite (12%). Cementite is composed of Fe3C and is relatively hard and brittle. The presence of cementite in the alloy increases its hardness, with reduction of ductility and toughness. Thus, pearlite combines the hardness and strength of cementite with the ductility of ferrite and is the key to the wide range of the properties of steels. The lamellar structure also acts as a barrier to crack movement, thus adding toughness. Nital, a mixture of 1 to 5% nitric acid in ethanol, is a typical etchant employed for metallographic preparation of carbon steels due to its ability to attack selectively specific microstructural features. Immersion of steel in nital or swabbing with nital for a short duration (seconds to minute) delineates the boundaries between carbides and ferrite, thus showing clearly the pearlite and ferrite phases, and the grain boundaries. Indeed, SEM examination of the nital-etched MS reveals pearlite and ferrite regions; in the EBSD map, the pearlite regions of grey appearance are clearly defined (Fig. 7).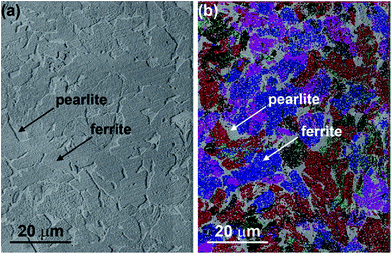 | ||
| Fig. 7 Metallographic examination of MS etched in 2% nital solution: (a) scanning electron micrograph; (b) related EBSD map. | ||
Immersion testing of MS in [BHC]BTA was carried out under the following conditions: (i) 80 °C, 1 day, (ii) 80 °C, 3 days and (iii) room temperature, 3 days. Fig. 8 displays photographs of the MS specimens after testing in comparison with the as-polished alloy. The specimens after immersion in [BHC]BTA at 80 °C are covered by corrosion products of dark appearance and their amount is visually greater after 3 days of immersion compared with that after 1 day (Fig. 8a and b). The appearance of the surface of the specimen tested at room temperature is darker compared with the as-polished specimen (Fig. 8c and d). Table 3 summarises the weights of the specimens before and after immersion. Before weighing, the surfaces of the specimens were scrubbed with cotton wool soaked in ethanol to remove corrosion products. There is significant weight loss during immersion at 80 °C that increases with the duration of immersion. A reduced weight loss occurs during immersion at room temperature, suggesting that increase of temperature significantly increases the corrosion rates in this IL.
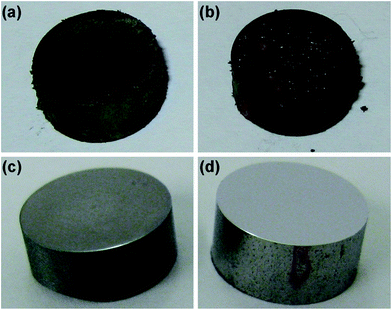 | ||
| Fig. 8 Photographs of the MS specimens after immersion testing in [BHC]BTA: (a) 80 °C, 1 day; (b) 80 °C, 3 days; (c) room temperature, 3 days; (d) as-polished alloy. | ||
| Immersion conditions | Weight, g | ||
|---|---|---|---|
| Before | After | Difference | |
| 1 day, 80 °C | 2.84783 | 2.76788 | −0.07995 |
| 3 days, 80 °C | 2.84420 | 2.64979 | −0.19441 |
| 3 days, RT | 2.46016 | 2.45928 | −0.00088 |
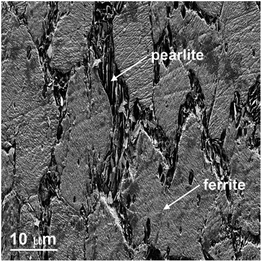
Similar to exposure to nital, interaction with [BHC]BTA results in dissolution of metal over the macroscopic surface, revealing the ferrite regions and pearlite regions with lamellar structure (Fig. 9). No manganese and sulphur were detected in the numerous cavities on the surface, suggesting that the MnS inclusions are dissolved faster than the metal. The lamellar appearance of pearlite phase follows from galvanic coupling between cementite and ferrite in the pearlite regions. Cementite acts as cathode site resulting in anodic dissolution of ferrite.27
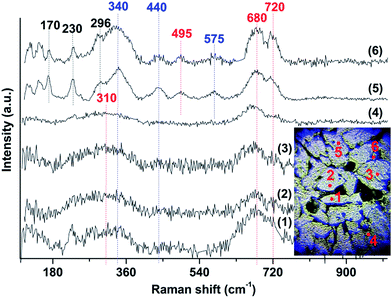
The corrosion products, their phase composition and their distribution across the surface of MS were also investigated by micro-Raman spectroscopy, selecting a representative MS area and performing Raman mapping at different spots. The specimen after immersion in [BHC]BTA for 3 days at RT is covered by corrosion products of dark appearance which are visible by the naked eye. Under the optical microscope the sample presents an inhomogeneous surface (see inset images in Fig. 10 and 11). Grey areas and various black inclusions appear, suggesting generation of a variety of oxides. Spectra were acquired from spots outside (grey areas) and inside (black spots) the inclusions.
All the Raman spectra obtained from different spots outside the inclusions (with grey or yellow color), covering the whole surface of the specimen, present some weak peaks at below 160 cm−1 and at ∼170, 230, 296, 340, 440, 495 and 575 cm−1, as well as some broad modes at ∼300, 680 and ∼720 cm−1 (Fig. 10), indicating that even the areas that showed relative intact under the microscope are in fact severely affected by corrosion. However, the spectra of some spots exhibit only two very broad bands, expanding over 250–400 cm−1 and 600–750 cm−1, covering some of the previously mentioned weak peaks (spots 1, 2, 3 and 4). Raman peaks over the region of 660–720 cm−1 represent the modes of tetrahedral group (T-site) and those in the 460–660 cm−1 region correspond to the modes of octahedral group (O-site) of ferrites with the main phase being maghemite (γ-Fe2O3).28 The 340, 440 and 575 cm−1 peaks are observed with high intensity only in the Raman spectra of spots (5 and 6) and are probably related to ZnO in the form of nanoparticles.29 In the same spectra (5 and 6), many peaks are also observed at very low frequency, below 300 cm−1 which are lying in the range of librational and lattice modes of oxides and sulphates. The emergence of these peaks indicates the appearance of extra corrosion products on the surface of the MS, which cannot be identified with sufficient accuracy by the Raman analysis.
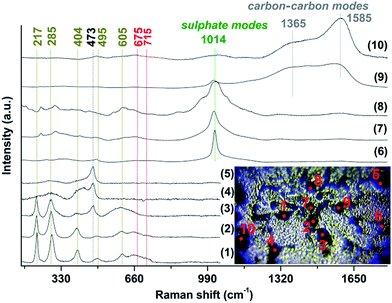
A plethora of cavities, of different size and shape was also examined by Raman spectroscopy (Fig. 11). Their spectra present differences from spot to spot, indicating that a variety of corrosion products are generated on their surface. The Raman spectra of some inclusions revealed strong peaks at ∼217, 285, 404 cm−1 and some broad bands at ∼495, 605, 675 and 715 cm−1 (spots 1–3). The corrosion product is identified as a mixture of hematite (α-Fe2O3) and maghemite (γ-Fe2O3), with high accuracy by the coincidence of the detected Raman modes (220, 285, 400, 495, 605 cm−1 and 675, 715 cm−1 respectively) with results in the literature.16,30,31 The Raman spectra of other inclusions present broad bands at ∼285, 420 cm−1 and a strong peak at ∼473 cm−1 (spots 4 and 5), that may be due to Zn(OH)2.31 Raman spectra acquired from spots 6–8 on some cavities show, apart from the ferrite modes, strong Raman peaks at ∼1014 cm−1 and several sidebands. These bands are attributed to the symmetric stretching vibrations of the sulphate ion in metal sulphates such as FeSO4, e.g. rozenite, FeSO4·4H2O or MnSO4.32 Finally, the broad bands at ∼1365 and 1585 cm−1, which dominate in the spectra at spots 9, 10, are due to the D and G characteristic carbon–carbon vibrational bands commonly observed from carbonaceous compounds.33
C4 Application of molybdate to [BHC]BTA
In an attempt to reduce the severe corrosion attack of the alloy by [BHC]BTA, molybdate was selected as an inhibitor. The inhibiting action of molybdate has been extensively studied for steel and other metals and alloys, with related mechanisms of inhibition proposed.34,35 Due to low toxicity, molybdate is considered as potential replacement for chromates to protect metallic materials in aqueous systems. The molybdate is classified as an anodic inhibitor. However, in contrast to chromate, it has weak oxidising power in basic or neutral solution and, thus, it is ineffective in the absence of oxidising agent such as oxygen. Dissolved oxygen can be present in the ILs and its fraction in the IL may be three times larger than in water.36 Further, it was shown recently that removal of oxygen from [C2mim]TCM reduced significantly corrosion rate of MS.16It was established that molybdate inhibits through formation of a protective film on the metallic surface. However, the mechanism of inhibition by molybdate is not well understood and is a subject of discussion. Lizvols37 proposed that during iron corrosion in the presence of chlorides molybdate reacts with divalent iron ions producing non protective complex probably through the following reaction:
| Fe2+ + MoO42− → FeMoO4. | (6) |
In the presence of oxygen, the divalent ferrous ion is oxidised to trivalent ferric ion that then forms ferric molybdate complex, which is insoluble in basic and neutral solutions:
| 2Fe3+ + 3MoO42− → Fe2(MoO4)3. | (7) |
It was speculated that the ferric molybdate layer finally precipitates on the corroding surface, thus generating a protective film that may additionally contain ferric oxide. In the study of hydrous ferric oxide film, Sakashito and Sato38 revealed that in the absence of molybdate, the film is anodic-selective in NaCl solution and permeable for chloride ions, thus making the film non-protective. In contrast, adsorption of molybdate on the hydrous ferric oxide film switches the film to cation-selective in NaCl. The film becomes permeable for monovalent cations and not-permeable for multivalent Fe2+ and Fe3+ ions. Thus, the film with molybdate becomes protective in NaCl by preventing the transport of aggressive chloride anions to the metallic surface and escaping metallic cations into solution.
The concentration of molybdate of 500 ppm was taken from the literature based on the ability to provide efficient corrosion inhibition in aqueous solutions of acids.35 The addition of molybdate to the IL reduces significantly the corrosivity of the IL at RT. Generally, immersion resulted in only dissolution of MnS inclusions, leaving the macroscopic alloy surface unattacked by the IL (Fig. 12a). In order to explore further the inhibiting ability of molybdate in [BHC]BTA, immersion was carried out at 60 °C. This temperature was selected based on TGA analysis, suggesting that at this temperature the IL is much more stable compared with that at 80 °C. However, it should be noted that about 4% weight loss occurred during the test run for 12 h at 60 °C. The inhibition effect remains strong during immersion at 60 °C for 1 day (Fig. 12b). Severe etching, revealing pearlite and ferrite regions, does not occur and shallow scratches in the polishing direction may be observed. However, the surface is covered by numerous microcavities generated due to localised etching of the alloy.
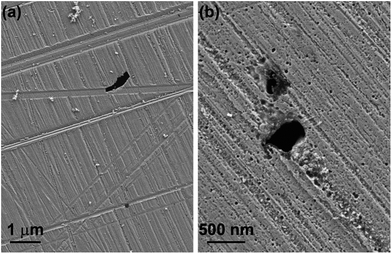 | ||
| Fig. 12 Scanning electron micrographs of MS after immersion testing in [BHC]BTA with addition of 500 ppm molybdate at (a) RT for 3 days and (b) 60 °C for 1 day. | ||
Analysis of the alloy surface by XPS confirmed the presence of the hexavalent molybdenum compound on the surface of the alloy after immersion. Fig. 13 shows overview XPS spectra recorded from the surface of the as-polished alloy and the alloy after immersion in [BHC]BTA with 500 ppm of molybdate. For both spectra, peaks ascribed to C 1s, N 1s, O 1s and Fe 2p are evident. The spectrum of the immersed specimen exhibits additional peaks ascribed to P 2p, S 2s, S 2p, Mo 3d, F 1s and Cu 2p. The P 2p and Cu 2p peaks may be attributed to contamination of the IL, whereas F 1s, S 2s and S 2p peaks are associated with the species originating from the IL anions.
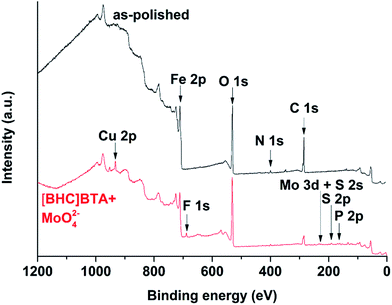 | ||
| Fig. 13 Overview XPS spectra recorded from the MS specimens in the as-polished conditions and after immersion in [BHC]BTA with 500 ppm molybdate at 60 °C for 1 day. | ||
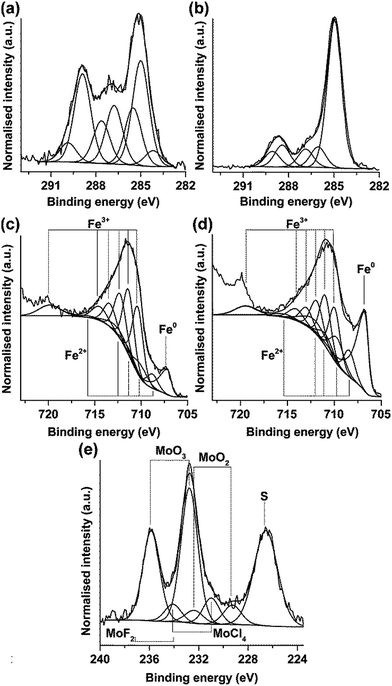
High energy resolution XPS data of the selected core levels of immersed and as-polished specimens are displayed in Fig. 14, namely Mo 3d + S 2s, F 1s, C 1s and Fe 2p. Peak fitting to the C 1s region reveals a complex series of peaks which is very different from the polished steel (Fig. 14a and b). However, in contrast to the XPS study of the ILs with similar pyrrolidinium-based cation and the same anion, no component at 293 eV assigned to –CF3 bond in the anion is observed,39 thus indicating that intact IL is not present on the surface. The difference of the fitting of as-polished and immersed alloy may be explained by interaction of the alloy with the IL.
Deconvolution of the iron region Fe 2p reveals the Fe peak centred at 707.2 eV and a series of components assigned to Fe2+ and Fe3+ oxides (Fig. 14c and d). The area under an iron peak at 707.2 eV reduces after exposure to molybdate with a corresponding increase of the area under oxide components. This suggests an increase of the thickness of the oxide film during immersion. Table 4 summarises the results of fitting in the region of binding energies ascribed to Fe 2p. It should be mentioned that Fe3+ components dominate in the oxide film following immersion in IL.
| Species | As-polished | [BHC]BTA and MoO42− | ||
|---|---|---|---|---|
| Position, eV | Area, % | Position, eV | Area, % | |
| Fe | 706.76 | 25.68 | 707.15 | 9.92 |
| Fe2+ | 708.41 | 6.44 | 708.78 | 4.20 |
| Fe2+ | 709.71 | 7.99 | 710.08 | 5.21 |
| Fe2+ | 710.91 | 3.86 | 711.28 | 2.52 |
| Fe2+ | 712.11 | 6.81 | 712.48 | 4.44 |
| Fe2+ | 715.41 | 1.49 | 715.78 | 0.97 |
| Total area of Fe2+ | 26.59 | 17.34 | ||
| Fe3+ | 709.97 | 12.87 | 710.37 | 19.61 |
| Fe3+ | 710.97 | 12.25 | 711.37 | 18.67 |
| Fe3+ | 711.87 | 9.42 | 712.27 | 14.35 |
| Fe3+ | 712.97 | 5.12 | 713.37 | 7.80 |
| Fe3+ | 714.07 | 3.87 | 714.47 | 5.90 |
| Fe3+ | 719.47 | 4.20 | 719.87 | 6.41 |
| Total area of Fe3+ | 47.73 | 72.74 | ||
Two binding energies at 232.75 and 235.85 eV of Mo 3d5/2 and Mo 3d3/2 features imply the presence of hexavalent molybdenum species embedded in the film (Fig. 14e). The presence of less intense fit components at binding energies of 229.27 and 232.37 eV corresponding to molybdenum in Mo4+ valence state is not clear since in aqueous solutions molybdate is not reduced. However, Stranick40 reported on the formation of a non-protective MoO4 film on the surface of MS in acidic solution containing sodium molybdate. It was suggested that in acidic medium, MoO42− ions condense into various isopolymolybdate anions that further reduce to MoO2. The components resulting from the fitting of spectrum in the region of Mo 3d + S 2p binding energies are listed in Table 5.
| Species | Position, eV |
|---|---|
| S 2s | 226.55 |
| MoO2 3d5/5 | 229.27 |
| MoO2 3d3/2 | 232.37 |
| MoO3 3d5/2 | 232.75 |
| MoO3 3d3/2 | 235.85 |
| MoCl4 3d5/2 | 230.99 |
| MoCl4 3d3/2 | 234.09 |
| MoF2 3d5/2 | 234.13 |
| MoF2 3d3/2 | 237.23 |
The components that may originate from MoF2 and MoCl4 species may be generated during interaction of molybdate with the IL (fluorine in the anion) or with contamination in the IL (chlorine); however, the statement about formation of fluoride is highly speculative. Further, a sulphur S 2s peak is evident at 226.55 eV that may originate from interaction with the IL anion. The detailed study of inhibition by molybdate in this particular IL needs further investigation. It may be preliminary concluded that, similar to aqueous solution, molybdate is adsorbed on the surface thus preventing transport of aggressive species containing chlorine or fluorine to the metal surface.
C5 Effect of etching and inhibitors on the CO2 absorption capacity and kinetics of [BHC]BTA
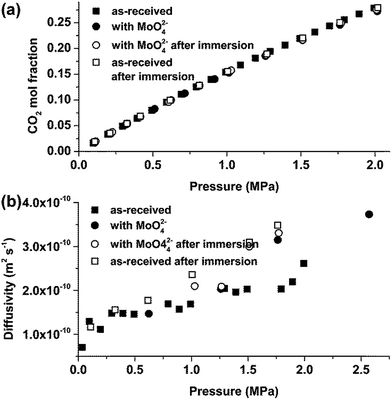
Elucidating the effect of corrosion inhibitors on the CO2 absorption capacity and kinetics of ILs and other novel solvents that could be applied in CCS is of high importance. Fig. 15a and b shows that the Na2MoO4 inhibitor used in this work not only prevents corrosion, but also has no effect on the CO2 absorption capacity and diffusivity in [BHC]BTA. Indeed, the deviations between the CO2 Henry's law constants of the [BHC]BTA without and with the use of the inhibitor and before and after the immersion tests are within the limits of the accuracy of the gravimetric setups involved (Table 6).| Testing conditions | H, MPa | Deviation, % |
|---|---|---|
| As-received [BHC]BTA | 6.28 (35 °C) | |
| [BHC]BTA with 500 ppm MoO42− before immersion test | 6.14 | −2.23 |
| [BHC]BTA with 500 ppm MoO42− after immersion test (RT, 3 days) | 6.29 | +0.16 |
| [BHC]BTA without inhibitor after immersion test (RT, 3 days) | 6.15 | −2.07 |
It is also important to note that similar to [Cnmim]TCM ILs, where the transfer of small quantities (<0.5 mg) of corrosion products such as MnS in the IL phase (20 ml) did not affect the absorption capacity for CO2, etching of the mild steel surface in [BHC]BTA and transfer of the etching products (about 1 mg in 5 ml of IL) into the IL phase also had no effect on the CO2 absorptivity and kinetics of absorption.
D Conclusions
The effect of ionic liquids, specifically designed for CO2 capture applications, on mild steel was studied by scanning electron microscopy. Depending on the structure of ionic liquid, the interaction with mild steel results in (i) local changes on the surface at the locations of MnS inclusions and (ii) modification over the macroscopic surface of the alloy.Long-term inhibiting ability of 1-alkyl-3-methylimidazolium tricyanomethanide ionic liquids ([Cnmim]TCM, n = 4 and 6) was confirmed after 30 days of immersion of mild steel at 80 °C. The immersion results in dissolution of MnS inclusions that may be accompanied by formation of corrosion products around the inclusion sites. Raman investigation confirmed the presence of iron oxides of maghemite (γ-Fe2O3) and magnetite spinel (Fe3O4) as the corrosive products of MS after the immersion in the ILs. Moreover the ionic liquid with the longer chains [C6mim]TCM was hardly corrosive to mild steel. Accidental addition of silver ions to [C6mim]TCM resulted in deposition of silver onto the MnS inclusions. Thus, deliberate introduction of silver ions may be considered as a possible way to prevent dissolution of inclusions, which may benefit the mechanical integrity of the alloy if their addition does not degrade the functionality of the IL. [BHC]BTA attacks severely the surface of mild steel and results in selective etching of the alloy over the macroscopic surface of the alloy revealing the ferrite and pearlite regions. Many corrosion products, including ferrites, sulphates, carbonates and oxides, were detected by micro-Raman analysis.
Molybdate inhibits etching of MS in [BHC]BTA at a concentration of 500 ppm at both room temperature and 60 °C. Moreover, the presence of molybdate in the IL phase has no effect on the CO2 absorption capacity and kinetics. XPS examination confirms that molybdate species with molybdenum in the hexavalent state are adsorbed on the surface of mild steel, thus providing effective corrosion inhibition. The presence of the Mo4+ species and molybdenum fluoride/chloride requires further confirmation.
Acknowledgements
The research was supported by EC in the framework of IOLICAP Grant (Project number 283077; Call Identifier FP7-ENERGY-2011-1).Notes and references
- N. V. Plechkova and K. R. Seddon, Chem. Soc. Rev., 2008, 37, 123 RSC.
- S. Z. El Abedin and F. Endres, Acc. Chem. Res., 2007, 40, 1106 CrossRef CAS PubMed.
- P. A. Z. Suarez, V. M. Selbach, J. E. L. Dullius, S. Einloft, C. Piatnicki, D. S. Azambuja, R. F. de Souza and J. Dupont, Electrochim. Acta, 1997, 42, 2533 CrossRef CAS.
- (a) E. Torralba-Calleja, J. Skinner and D. Gutiérrez-Tauste, J. Chem., 2013, 2013, 473584 Search PubMed; (b) D. M. D'Alessandro, B. Smit and J. R. Long, Angew. Chem., Int. Ed., 2010, 49, 6058 CrossRef PubMed; (c) Z. Lei, C. Dai and B. Chen, Chem. Rev., 2014, 114, 1289 CrossRef CAS PubMed.
- M. Hasib-ur-Rahman and F. Larachi, Ind. Eng. Chem. Res., 2013, 52, 17682 CrossRef CAS.
- S. Baj, A. Siewniak, A. Chrobok, T. Krawczyk and A. Sobolewski, J. Chem. Technol. Biotechnol., 2013, 88, 1220 CrossRef CAS PubMed.
- (a) T. P. T. Pham, C.-W. Cho and Y.-S. Yun, Water Res., 2010, 44, 352 CrossRef CAS PubMed; (b) R. F. M. Frade and C. A. M. Afonso, Hum. Exp. Toxicol., 2010, 29, 1038 CrossRef CAS PubMed.
- X. Papatryfon, N. S. Heliopoulos, I. S. Molchan, L. F. Zubeir, N. D. Bezemer, M. Arfanis, A. Kontos, V. Likodimos, B. Iliev, G. Em. Romanos, P. Falaras, K. Stamatakis, K. G. Beltsios, M. C. Kroon, G. E. Thompson, J. Klöckner and T. J. S. Schubert, Ind. Eng. Chem. Res., 2014, 53, 12083 CrossRef CAS.
- (a) N. V. Likhanova, M. A. Dominguez-Aguilar, O. Olivares-Xometl, N. Nava-Entzana, E. Arce and H. Dorantes, Corros. Sci., 2010, 52, 2088 CrossRef CAS PubMed; (b) G. Moretti, F. Guidi and F. Fabris, Corros. Sci., 2013, 76, 206 CrossRef CAS PubMed.
- H. Nollet, M. Roels, P. Lutgen, P. Van der Meeren and W. Verstraete, Chemosphere, 2003, 53, 655 CrossRef CAS.
- A. Acidi, M. Hasib-ur-Rahman, F. Larachi and A. Abbaci, Korean J. Chem. Eng., 2014, 31, 1043 CrossRef CAS PubMed.
- (a) Y. Kondo, S. Yagi, T. Koyama, R. Tsuboi and S. Sasaki, Proc. Inst. Mech. Eng., Part J, 2012, 226, 991 CrossRef CAS PubMed; (b) M. F. Arenas and R. G. Reddy, J. Min. Metall., Sect. B, 2003, 39, 81 CrossRef CAS; (c) I. Perissi, U. Bardi, S. Caporali and A. Lavacchi, Corros. Sci., 2006, 48, 2349 CrossRef CAS PubMed.
- M. Uerdingen, C. Treber, M. Balser, G. Schmitt and C. Werner, Green Chem., 2005, 7, 321 RSC.
- G. Wranglen, Corros. Sci., 1974, 14, 331 CrossRef.
- G. Wranglen, Corros. Sci., 1969, 9, 585 CrossRef CAS.
- I. S. Molchan, G. E. Thompson, R. Lindsay, P. Skeldon, V. Likodimos, G. E. Romanos, P. Falaras, G. Adamova, B. Iliev and T. J. S. Schubert, RSC Adv., 2014, 4, 5300 RSC.
- (a) G. E. Romanos, L. F. Zubeir, V. Likodimos, P. Falaras, M. C. Kroon, B. Iliev, G. Adamova and T. J. S. Schubert, J. Phys. Chem. B, 2013, 117, 12234 CrossRef CAS PubMed; (b) A. I. Labropoulos, G. E. Romanos, E. Kouvelos, P. Falaras, V. Likodimos, M. Francisco, M. C. Kroon, B. Iliev, G. Adamova and T. J. S. Schubert, J. Phys. Chem. C, 2013, 117, 10114 CrossRef CAS.
- (a) S. Raeissi, L. Florusse and C. J. Peters, J. Supercrit. Fluids, 2010, 55, 825 CrossRef CAS PubMed; (b) M. B. Shiflett and A. Yokozeki, J. Phys. Chem. B, 2007, 11, 2070 CrossRef PubMed; (c) J. Kumelan, Á. Pérez-Salado Kamps, D. Tuma and G. Maurer, J. Chem. Thermodyn., 2006, 38, 1396 CrossRef CAS PubMed.
- C. Gaspard, P. Messien and T. Greday, Met. Sci., 1982, 16, 105 CrossRef CAS.
- (a) P. Refait, M. Jeannin, R. Sabot, H. Antony and S. Pineau, Corros. Sci., 2015, 90, 375 CrossRef CAS PubMed; (b) A. I. Kontos, V. Likodimos, T. Stergiopoulos, D. S. Tsoukleris, P. Falaras, I. Rabias, G. Papavassiliou, D. Kim, J. Kunze and P. Schmuki, Chem. Mater., 2009, 21, 662 CrossRef CAS.
- ESPI Metals website,http://www.espimetals.com/index.php/msds/667-manganese-sulfide.
- T. Schober and C. Dieker, Metall. Trans. A, 1983, 14, 2440 CrossRef.
- J. Shinozaki, I. Muto, T. Omura, M. Numata and N. Hara, J. Electrochem. Soc., 2011, 158, C302 CrossRef CAS PubMed.
- T. Sundararajan, E. Akiyama and K. Tsuzaki, Electrochem. Solid-State Lett., 2005, 8, B30 CrossRef CAS PubMed.
- H. Saitoh, T. Hishi and T. Misawa, Mater. Trans. JIM, 1996, 37, 373 CrossRef CAS.
- B. L. Bramfitt, Metals Handbook Desk Edition, ed. J. R. Davis, ASM International, 2nd edn, 1998, pp. 153–173 Search PubMed.
- D. N. Staicopolus, J. Electrochem. Soc., 1963, 110, 1121 CrossRef CAS PubMed.
- (a) T. Yu, Z. X. Shen, Y. Shi and J. Ding, J. Phys.: Condens. Matter, 2002, 14, L613 CrossRef CAS; (b) G. Dixit, J. P. Singh, R. C. Srivastava, H. M. Agrawal and R. J. Chaudhary, et al., Adv. Mater. Lett., 2012, 3, 21 CrossRef CAS PubMed.
- K. A. Alim, V. A. Fonoberov, M. Shamsa and A. A. Balandin, J. Appl. Phys., 2005, 97, 124313 CrossRef PubMed.
- (a) D. L. A. de Faria, S. Venâncio Silva and M. T. de Oliveira, J. Raman Spectrosc., 1997, 28, 873 CrossRef CAS; (b) I. Chourpa, L. Douziech-Eyrolles, L. Ngaboni-Okassa, J.-F. Fouquenet, S. Cohen-Jonathan, M. Soucé, H. Marchais and P. Dubois, Analyst, 2005, 130, 1395 RSC.
- P. Colomban, S. Cherifi and G. Despert, J. Raman Spectrosc., 2008, 39, 881 CrossRef CAS PubMed.
- (a) J. Aramendia, L. Gómez-Nubla, K. Castro and J. M. Madariaga, Microchem. J., 2014, 115, 138 CrossRef CAS PubMed; (b) X. Guo, H.-S. Xiao, F. Wang and Y.-H. Zhang, J. Phys. Chem. A, 2010, 114, 6480 CrossRef CAS PubMed.
- (a) S. Dimovski, A. Nikitin, H. Ye and Y. Gogotsi, J. Mater. Chem., 2004, 14, 238 RSC; (b) E. Park and O. Ostrovski, Metall. Mater. Trans. B, 2001, 32, 839 CrossRef PubMed.
- (a) W. D. Robertson, J. Electrochem. Soc., 1951, 98, 94 CrossRef CAS PubMed; (b) M. J. Pryor and M. Cohen, J. Electrochem. Soc., 1953, 100, 203 CrossRef CAS PubMed; (c) M. S. Vukasovich and J. P. G. Farr, Polyhedron, 1986, 5, 551 CrossRef CAS; (d) A. M. Shams El Din, R. A. Mohammed and H. H. Haggag, Desalination, 1997, 114, 85 CrossRef CAS.
- A. J. Bentley, L. G. Earwaker, J. P. G. Farr, M. Saremi and A. M. Seeney, Polyhedron, 1986, 5, 547 CrossRef CAS.
- I. Perissi, U. Bardi, S. Caporali, A. Fossatia and A. Lavacchi, Sol. Energy Mater. Sol. Cells, 2008, 92, 510 CrossRef CAS PubMed.
- E. A. Lizlows, Corrosion, 1976, 32, 263 CrossRef.
- M. Sakashita and N. Sato, Corros. Sci., 1977, 17, 473 CrossRef CAS.
- M. A. Stranick, Corrosion, 1984, 40, 296 CrossRef CAS.
- S. Men, K. R. J. Lovelock and P. License, Phys. Chem. Chem. Phys., 2011, 13, 15244 RSC.
- M. C. Biesinger, B. P. Payne, A. P. Grosvenor, L. W. M. Lau, A. R. Gerson and R. St. C. Smart, Appl. Surf. Sci., 2011, 257, 2717 CrossRef CAS PubMed.
Footnote |
| † Electronic supplementary information (ESI) available. See DOI: 10.1039/c5ra01097g |
| This journal is © The Royal Society of Chemistry 2015 |

