 Open Access Article
Creative Commons Attribution 3.0 Unported Licence
Controlled ionic conductivity via tapered block polymer electrolytes†
Wei-Fan
Kuan
a,
Roddel
Remy
b,
Michael E.
Mackay
ab and
Thomas H.
Epps, III
*ab
aDepartment of Chemical and Biomolecular Engineering, University of Delaware, Newark, DE 19716, USA. E-mail: thepps@udel.edu
bDepartment of Materials Science and Engineering, University of Delaware, Newark, DE 19716, USA
First published on 23rd January 2015
Abstract
We present the design of novel solid electrolytes using tapered block polymers (TBPs). In this work, we synthesize a series of TBPs via atom transfer radical polymerization (ATRP) consisting of rigid polystyrene and ion-conducting poly(oligo-oxyethylene methacrylate) segments and explore the role of tapered interfaces on ion transport. Previous studies on TBPs have shown that manipulating the taper composition in block polymers can reduce the unfavorable polymer–polymer interactions between blocks, enabling the design for highly-processable (lower order–disorder transition temperature) polymer electrolytes. Herein, we demonstrate that the taper profile and taper volume fraction significantly impact the glass transition temperatures (Tgs) in block polymer electrolytes, thus affecting the ionic conductivity. Additionally, we find that the normal-tapered materials with ≈60 vol% tapering exhibit remarkable improvements in ionic conductivity (increase ≈190% at 20 °C and increase ≈90% at 80 °C) in comparison to their non-tapered counterparts. Overall, our TBPs, with controllable interfacial interactions, present an exciting opportunity for the fabrication of cost-effective, highly-efficient, and stable energy storage membranes.
Introduction
Rechargeable lithium-metal batteries are among the most promising technologies for future electrochemical energy storage devices due to their high energy densities, low self-discharge rates, and minimal memory effects.1–6 However, conventional liquid electrolytes in lithium-metal batteries are potential hazards due to dendrite formation that can short-circuit batteries during repeated charge–discharge cycles.7–9 Moreover, recent incidents with commercial lithium ion battery packs in the transportation industry indicate that the flammable organic liquid electrolyte may allow batteries to become thermally and electrochemically unstable.10 These safety and performance concerns have promoted interest in solid-state lithium-metal batteries containing solvent-free electrolytes.11–13Block polymers (BPs) have been investigated extensively as solid-state electrolytes for rechargeable lithium-metal batteries due to their ability to self-assemble into ordered nanostructures.14–16 Such BP nanostructure formation, governed by the segregation strength (χN, χ: Flory–Huggins interaction parameter and N: degree of polymerization) and volume fraction (f) of the block, permits simultaneous control over ion transport and mechanical strength, thus providing an enticing opportunity toward fabricating designer materials for polymer electrolytes.16–20 For example, in diblock copolymer systems, the ion-conducting block can be complexed with lithium salts, and the lithium ion in polymer–salt complexes can be transported via segmental motion of polymer chains. In this case, the non-conducting block can provide mechanical support and suppress dendrite formation. Researchers have reported the preparation of solid-state electrolytes with a combination of high mechanical strength and ionic conductivity using nanostructured BPs.17,21–23 For example, Balsara and co-workers designed a high-molecular-weight poly(styrene-b-ethylene oxide) (P(S-EO)) BP electrolyte that achieved ionic conductivities on the order of 10−4 S cm−1 and shear moduli on the order of 108 Pa at 90 °C.21 Additionally, recent work by Lodge and co-workers demonstrated the preparation of a bicontinuous polymer electrolyte containing interpenetrating domains of cross-linked PS and PEO/ionic liquid.22 Their materials achieved ionic conductivities above 10−3 S cm−1 and tensile moduli ≈108 Pa at room temperature.22 Although these high-molecular-weight polymer electrolytes provide exceptional transport and mechanical properties, the high processing cost due to the high segregation strength, among other factors, has restricted their potential in battery applications.24
To overcome the above limitation, we report a new design of BP electrolytes using tapered block polymers (TBPs). TBPs consist of a transition region with a gradient composition profile between two pure blocks as shown in Fig. 1.25–29 This architecture differs from gradient copolymers, which have a graded compositional profile extending along the entire polymer chain.30–35 Previous studies have demonstrated that manipulating the segment distribution in BP systems can decrease the effective segregation strength between blocks by reducing the effective χ; in other words, the processing temperatures can be tuned independent of the chemical constituents and the molecular weight (i.e., mechanical properties) using tapered interfaces.26,32,35–38 Additionally, the intermixing between two polymer domains in BPs substantially increases block compatibility, enabling independent control over BP chain stretching and the glass transition temperature (Tg) at a constant chemical composition.28,29,31,39–42 Moreover, both experimental and theoretical work on TBPs has shown that these materials are able to self-assemble into ordered cylinder and complex network nanostructures, which are advantageous for polymer electrolytes due to their three-dimensional conducting pathways.25,26,37 These unique properties make TBPs attractive candidates for potential conducting applications.
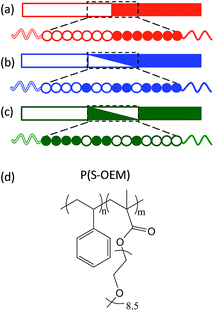 | ||
| Fig. 1 Illustration of a (a) block polymer, (b) normal-tapered block polymer, and (c) inverse-tapered block polymer. (d) Molecular structure of P(S-OEM). | ||
In this work we applied, for the first time, TBPs as electrolytes and explored the role of tapered interfaces on the ionic conductivity using a model system comprised of mechanically rigid PS and ion-conducting poly(oligo-oxyethylene methacrylate) (POEM) (Fig. 1(d)). POEM was chosen in this work for its superior room temperature conductivity relative to PEO as a result of a significantly reduced driving force toward crystallization in POEM.24,43,44 The influence of tapering on ionic conductivity was studied relative to taper profile (normal-tapered vs. inverse-tapered) and taper volume fraction. By developing a better understanding of TBPs, this work provides a promising strategy for designing novel polymer electrolytes with a combination of improved ionic conductivity and sufficient mechanical strength, without compromising processability.
Experimental
Materials
Styrene monomers (99%, stabilized, Acros Organics) and oligo-oxyethylene methacrylate monomers (OEM, >99%, stabilized, Sigma-Aldrich, average molar mass = 475 g mol−1) were purified by passage through basic alumina columns. The styrene monomer also was dried by distilling from calcium hydride. Both monomers were degassed by three freeze–pump–thaw cycles before use. Propargyl 2-bromoisobutyrate (PgBiB) was synthesized according to literature procedures (yield ≈ 80 wt%).45 Copper bromide (Cu(I)Br, 98%, Acros Organics) was purified by stirring in acetic acid for 20 min, filtering, washing twice with cold ethanol, and drying under dynamic vacuum. N,N,N′,N″,N‴-pentamethyldiethylenetriamine (PMDETA, 99%, Sigma-Aldrich), tetrahydrofuran (THF, >99%, optima, Fisher Scientific), and anisole (>99%, Fisher Scientific) were degassed before storing in an argon-filled glove box. Lithium trifluoromethanesulfonate (lithium triflate, LiCF3SO3, 99%, Sigma-Aldrich) was dried at room temperature under dynamic vacuum overnight before being transferred into the glove box.Synthesis of tapered block polymers (TBPs)
The synthesis of TBPs was accomplished via atom transfer radical polymerization (ATRP). The PS block was polymerized at 100 °C in a mixture of Cu(I)Br (0.73 mmol), PMDETA (1.46 mmol), styrene (0.3 mol), and anisole (17 ml) using PgBiB (0.73 mmol) as the initiator. The reaction proceeded for 8 h and was terminated by cooling at room temperature and exposing to air. The Br-capped PS (PS–Br) was purified by passage through a neutral alumina column and followed by precipitation from methanol. The number-average molar mass (Mn) and dispersity (Đ) were determined using gel permeation chromatography (GPC) on a Viscotek 270Max instrument fitted with Waters Styragel HR1 and HR4 columns in series, operating with THF as the mobile phase, and calibrated using PS standards. PS-Br served as the macroinitiator for the semi-batch synthesis of the normal-tapered and inverse-tapered polymers. Styrene and OEM monomers were added to the reactor vessel at predetermined flow rates using automated syringe pumps. The flow rates were calculated based on monomer reactivity ratios determined from the Mayo–Lewis relationship (ESI Fig. S1†).46 To confirm the composition profile in the taper, aliquots were taken during the polymerization of the tapered segment and analyzed via proton nuclear magnetic resonance (1H NMR) spectroscopy (Bruker AV-400) (ESI Fig. S2†). The ATRP reaction to form the tapered segment was designed to reach the desired composition and molecular mass at relatively low monomer conversions (≈30%) to maximize the bromine endgroup fidelity. At the end of the taper region polymerization, pure OEM monomer was added to the reactor for the synthesis of the POEM block. The final TBP was purified by passage through neutral alumina and precipitation from cold isopropanol. The non-tapered P(S-OEM) BP was synthesized in a similar fashion but with no tapering step. Mn, Đ, and POEM volume fraction were characterized via a combination of GPC and 1H NMR using homopolymer densities at room temperature (ρPS = 1.05 g cm−3,47ρPOEM = 1.22 g cm−3), for which the density of POEM was estimated using group contribution theory.481H NMR δH (400 MHz; CDCl3; Me4Si) 7.2–6.3 (5H, br m, Ar–H), 4.2 (2H, br s, CH2, OEM side chain), 3.9–3.5 (br m, CH2, OEM side chain), 3.4 (3H, s, CH3, OEM side chain), 2.2–0.7 (br m, CH, CH2, CH3, polymer backbone). The characterization results for all samples are listed in Table 1. Normal-tapered and inverse-tapered samples are denoted as P(S-SOEM-OEM)x and P(S-OEMS-OEM)x, respectively, for which x represents the taper volume fraction in the TBP.| Polymer | f taper a | M n (kg mol−1) | Đ | f PS b |
|---|---|---|---|---|
| a Taper volume fraction in BPs. b Overall PS volume fraction (fPS = 1 − fPOEM and fPS = 1 − fPEO). | ||||
| P(S-OEM) | 0 | 35.0 | 1.17 | 0.49 |
| P(S-SOEM-OEM)0.62 | 0.62 | 33.0 | 1.13 | 0.48 |
| P(S-SOEM-OEM)0.32 | 0.32 | 31.0 | 1.10 | 0.52 |
| P(S-OEMS-OEM)0.61 | 0.61 | 32.0 | 1.17 | 0.48 |
| P(S-EO) | 0 | 53.1 | 1.09 | 0.25 |
Preparation of salt-doped samples
Salt-doped polymers were prepared in an argon-filled glove box to prevent moisture uptake. Polymers were dried rigorously before transferred into the glove box. Measured amounts of polymers and LiCF3SO3 were dissolved in anhydrous THF, followed by solvent removal under dynamic vacuum, and then stored in the glove box.Small-angle X-ray scattering (SAXS)
Synchrotron SAXS experiments were conducted on the DND-CAT 5-ID-D beamline at the Advanced Photon Source of Argonne National Laboratory with an incident beam of wavelength λ = 0.7293 Å and a Mar CCD detector at a sample-to-detector distance of 8503 mm (APS-SAXS). Lab source SAXS experiments were conducted at the University of Delaware (UD) on a Rigaku SAXS instrument as described elsewhere (UD-SAXS).49 All two-dimensional scattering data were azimuthally integrated, resulting in plots of scattered intensity versus scattering vector, q = 4πλ−1![[thin space (1/6-em)]](https://www.rsc.org/images/entities/char_2009.gif) sin(θ/2), for which θ is the scattering angle. All SAXS samples were pre-annealed at 120 °C for 2 h, heated to 150 °C for 2 h, and then cooled to 30 °C under dynamic vacuum. APS-SAXS and UD-SAXS data were acquired at 30 °C, 120 °C, and 150 °C heating ramp with 15 min annealing at each temperature. APS-SAXS experiments were performed under nitrogen flow, and UD-SAXS experiments were conducted under dynamic vacuum.
sin(θ/2), for which θ is the scattering angle. All SAXS samples were pre-annealed at 120 °C for 2 h, heated to 150 °C for 2 h, and then cooled to 30 °C under dynamic vacuum. APS-SAXS and UD-SAXS data were acquired at 30 °C, 120 °C, and 150 °C heating ramp with 15 min annealing at each temperature. APS-SAXS experiments were performed under nitrogen flow, and UD-SAXS experiments were conducted under dynamic vacuum.
Transmission electron microscopy (TEM)
BP morphologies were examined on a JEM-3010 TEM. TEM samples were prepared following the same pre-annealing protocol used for the SAXS specimens. Samples were cut into ≈70 nm slices at −120 °C using a cryo Leica Reichart Ultracut S microtome. The TEM was operated at an accelerating voltage of 200 kV. The POEM domain was stained with ruthenium tetroxide (RuO4) vapor at room temperature for ≈60 s to enhance contrast prior to imaging.AC impedance spectroscopy
A Princeton Applied Research PARSTAT 2273 frequency response analyzer with a homemade test cell on a Linkam HFS91 CAP stage was used to conduct ionic conductivity measurements. Polymer specimens were hot-pressed into disks under vacuum in the glove box and then placed into a test cell as described previously.50 Samples were pre-annealed at 120 °C for 2 h and then cooled to 20 °C at 30 °C min−1 and held for 1 h. The impedance measurements were conducted under dynamic vacuum, and the ionic conductivity was measured on heating. Two impedance measurements were taken at each temperature with 5 min and 8 min annealing times. The first measurement is reported in the text, while the second measurement was used to ensure that the ionic conductivity results were consistent during the annealing. The AC frequency range and voltage amplitude were 0.1–1 MHz and 10 mV, respectively. The bulk resistance of the electrolyte, R, was determined from the high-frequency plateau in the real impedance data, and the ionic conductivity, σ, was calculated using σ = L/(RA), for which L is the sample thickness, and A is the contact area between the sample and the aluminum foil electrode.Differential scanning calorimetry (DSC)
DSC experiments were conducted using a TA Instruments Discovery DSC equipped with an RCS90 cooling accessory. Samples were sealed in aluminum pans and heated through three cooling/heating cycles between −85 °C and 150 °C at 10 °C min−1 under a nitrogen atmosphere. Baseline calibration was performed with sapphire disks, while the temperature and the cell constant were calibrated using an indium standard. The Tg value was determined from the midpoint of the inflection in the third heating trace.Results and discussion
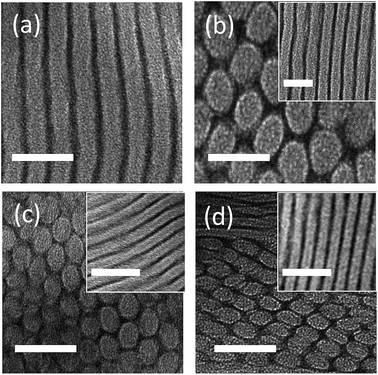
The macromolecular characterization of non-tapered P(S-OEM), normal-tapered P(S-SOEM-OEM)0.62, and inverse-tapered P(S-OEMS-OEM)0.61 BPs is reported in Table 1. GPC traces, as shown in ESI Fig. S3,† were used to confirm the shifts in molecular mass distributions, indicating the formation of well-defined polymers at each synthetic step. The morphologies of neat (non-doped) and LiCF3SO3-doped polymers were examined using a combination of SAXS and TEM. SAXS data, acquired at 30 °C, for P(S-OEM), P(S-SOEM-OEM)0.62, and P(S-OEMS-OEM)0.61 are presented in Fig. 2. The neat P(S-OEM) BP (Fig. 2(a)) exhibited SAXS diffraction peaks at q/q* = 1 and 2 (for which q* was the primary peak location), and the domain spacing of 25.8 nm in P(S-OEM) was obtained from q* (d = 2π/q*). The peak ratios were indicative of a lamellae (LAM) phase, and the TEM micrograph (Fig. 3(a)) further confirmed the LAM assignment. The domain spacing of P(S-OEM) obtained from TEM was 21.3 nm, which is smaller than that obtained from SAXS. However, the thickness of a PS stripe in Fig. 3(a) was ≈13 nm as expected based on the PS volume fraction and the domain spacing from SAXS. The deviation between SAXS and TEM results likely was due to POEM shrinkage under exposure to the electron beam in TEM.16,50 With the addition of LiCF3SO3 at the salt-doping ratio of [EO]![[thin space (1/6-em)]](https://www.rsc.org/images/entities/char_2009.gif) :
:![[thin space (1/6-em)]](https://www.rsc.org/images/entities/char_2009.gif) [Li] = 15
[Li] = 15![[thin space (1/6-em)]](https://www.rsc.org/images/entities/char_2009.gif) :
:![[thin space (1/6-em)]](https://www.rsc.org/images/entities/char_2009.gif) 1, the primary peak of P(S-OEM) shifted to q* = 0.018 Å−1, giving a domain spacing of 34.4 nm. The scattering peaks located at q/q* = 1, √3, 2, √7, and 3 suggest a hexagonally-packed cylinder (HEX) morphology. TEM micrographs showed both hexagonally-packed dots (Fig. 3(b)) and parallel stripes (Fig. 3(b) inset), which support the HEX assignment.
1, the primary peak of P(S-OEM) shifted to q* = 0.018 Å−1, giving a domain spacing of 34.4 nm. The scattering peaks located at q/q* = 1, √3, 2, √7, and 3 suggest a hexagonally-packed cylinder (HEX) morphology. TEM micrographs showed both hexagonally-packed dots (Fig. 3(b)) and parallel stripes (Fig. 3(b) inset), which support the HEX assignment.
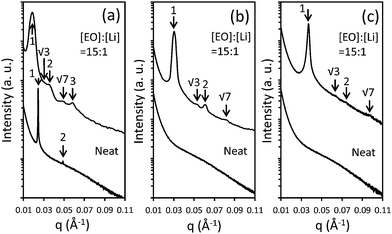 | ||
| Fig. 2 APS-SAXS data for neat and LiCF3SO3-doped (a) P(S-OEM), (b) P(S-SOEM-OEM)0.62, and (c) P(S-OEMS-OEM)0.61. Data were shifted vertically for clarity. | ||
A similar morphological analysis was conducted for normal-tapered P(S-SOEM-OEM)0.62 and inverse-tapered P(S-OEMS-OEM)0.61 to investigate the effects of taper profile on BP self-assembly. The SAXS patterns for neat P(S-SOEM-OEM)0.62 (Fig. 2(b)) and P(S-OEMS-OEM)0.61 (Fig. 2(c)) were featureless and indicative of disordered morphologies. This difference in morphology in comparison to the P(S-OEM) specimen was due to the interfacial modification of our tapered polymers and suggested a lower order–disorder transition temperature (TODT) in the tapered materials relative to their non-tapered counterpart. Upon salt doping at [EO]![[thin space (1/6-em)]](https://www.rsc.org/images/entities/char_2009.gif) :
:![[thin space (1/6-em)]](https://www.rsc.org/images/entities/char_2009.gif) [Li] = 15
[Li] = 15![[thin space (1/6-em)]](https://www.rsc.org/images/entities/char_2009.gif) :
:![[thin space (1/6-em)]](https://www.rsc.org/images/entities/char_2009.gif) 1, SAXS profiles of LiCF3SO3-doped P(S-SOEM-OEM)0.62 (Fig. 2(b)) and LiCF3SO3-doped P(S-OEMS-OEM)0.61 (Fig. 2(c)) exhibited scattering peaks at q/q* = 1, √3, 2, and √7, indicative of HEX morphologies. The TEM micrographs for LiCF3SO3-doped P(S-SOEM-OEM)0.62 (Fig. 3(c)) and LiCF3SO3-doped P(S-OEMS-OEM)0.61 (Fig. 3(d)) with hexagonally-packed dots and parallel stripes (insets in Fig. 3(c) and (d)) support our HEX assignments. Notably, the domain spacings of LiCF3SO3-doped P(S-SOEM-OEM)0.62 and LiCF3SO3-doped P(S-OEMS-OEM)0.61 were 20.6 nm and 17.0 nm, respectively, showing a significant deviation from the corresponding non-tapered LiCF3SO3-doped P(S-OEM) (dP(S-OEM):Li = 34.4 nm), especially for the inverse-tapered material. The reduction in d for TBPs was consistent with theoretical predictions by Hall and co-workers.37 This result demonstrates that the domain sizes of lithium-doped BPs can be manipulated independent of the chemical constituents and the polymer molecular mass using tapered interfaces.
1, SAXS profiles of LiCF3SO3-doped P(S-SOEM-OEM)0.62 (Fig. 2(b)) and LiCF3SO3-doped P(S-OEMS-OEM)0.61 (Fig. 2(c)) exhibited scattering peaks at q/q* = 1, √3, 2, and √7, indicative of HEX morphologies. The TEM micrographs for LiCF3SO3-doped P(S-SOEM-OEM)0.62 (Fig. 3(c)) and LiCF3SO3-doped P(S-OEMS-OEM)0.61 (Fig. 3(d)) with hexagonally-packed dots and parallel stripes (insets in Fig. 3(c) and (d)) support our HEX assignments. Notably, the domain spacings of LiCF3SO3-doped P(S-SOEM-OEM)0.62 and LiCF3SO3-doped P(S-OEMS-OEM)0.61 were 20.6 nm and 17.0 nm, respectively, showing a significant deviation from the corresponding non-tapered LiCF3SO3-doped P(S-OEM) (dP(S-OEM):Li = 34.4 nm), especially for the inverse-tapered material. The reduction in d for TBPs was consistent with theoretical predictions by Hall and co-workers.37 This result demonstrates that the domain sizes of lithium-doped BPs can be manipulated independent of the chemical constituents and the polymer molecular mass using tapered interfaces.
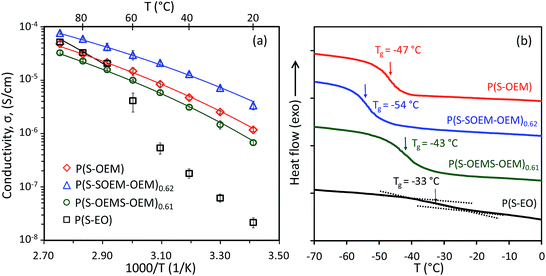
To determine the effects of tapering on the ionic conductivity, AC impedance experiments were conducted on the HEX-forming P(S-OEM), P(S-SOEM-OEM)0.62, and P(S-OEMS-OEM)0.61 samples at a salt-doping ratio of [EO]![[thin space (1/6-em)]](https://www.rsc.org/images/entities/char_2009.gif) :
:![[thin space (1/6-em)]](https://www.rsc.org/images/entities/char_2009.gif) [Li] = 15
[Li] = 15![[thin space (1/6-em)]](https://www.rsc.org/images/entities/char_2009.gif) :
:![[thin space (1/6-em)]](https://www.rsc.org/images/entities/char_2009.gif) 1. The temperature-dependent conductivity profiles of LiCF3SO3-doped tapered and non-tapered BPs are shown in Fig. 4(a). For comparison, the ionic conductivity of a P(S-EO) sample with HEX morphology (Table 1 and ESI Fig. S4†) at [EO]
1. The temperature-dependent conductivity profiles of LiCF3SO3-doped tapered and non-tapered BPs are shown in Fig. 4(a). For comparison, the ionic conductivity of a P(S-EO) sample with HEX morphology (Table 1 and ESI Fig. S4†) at [EO]![[thin space (1/6-em)]](https://www.rsc.org/images/entities/char_2009.gif) :
:![[thin space (1/6-em)]](https://www.rsc.org/images/entities/char_2009.gif) [Li] = 15
[Li] = 15![[thin space (1/6-em)]](https://www.rsc.org/images/entities/char_2009.gif) :
:![[thin space (1/6-em)]](https://www.rsc.org/images/entities/char_2009.gif) 1 also is shown in Fig. 4(a). The ionic conductivity of P(S-EO) dropped substantially below 60 °C due to crystallization of PEO domain (see DSC data in ESI Fig. S5†).51 For the POEM-containing specimens, all salt-doped polymers remained amorphous (ESI Fig. S5†) and showed the absence of a sharp drop in conductivity over the experimental temperature range. The conductivity of POEM-based BPs was ∼10−6 S cm−1 at 20 °C, which was 2 orders of magnitude higher than P(S-EO) samples (σP(S-EO) ∼10−8 S cm−1 at 20 °C). Additionally, the POEM-based samples exhibited lower Tgs (Fig. 4(b)) in comparison to P(S-EO), suggesting the potential for enhanced segmental motion in POEM domains relative to PEO domains.
1 also is shown in Fig. 4(a). The ionic conductivity of P(S-EO) dropped substantially below 60 °C due to crystallization of PEO domain (see DSC data in ESI Fig. S5†).51 For the POEM-containing specimens, all salt-doped polymers remained amorphous (ESI Fig. S5†) and showed the absence of a sharp drop in conductivity over the experimental temperature range. The conductivity of POEM-based BPs was ∼10−6 S cm−1 at 20 °C, which was 2 orders of magnitude higher than P(S-EO) samples (σP(S-EO) ∼10−8 S cm−1 at 20 °C). Additionally, the POEM-based samples exhibited lower Tgs (Fig. 4(b)) in comparison to P(S-EO), suggesting the potential for enhanced segmental motion in POEM domains relative to PEO domains.
Among the three POEM-based BPs, the normal-tapered P(S-SOEM-OEM)0.62 showed the maximum ionic conductivity. Considering that all samples had the same morphology, we postulate that the improved ionic conductivity in the normal-tapered sample resulted from the lower Tg of the conducting domains as reported in Fig. 4(b).52–55 As the POEM-based polymer electrolytes had similar molecular masses and chemical compositions, the shifting of the Tg in the P(S-OEM) systems likely was caused by the presence of tapered interfaces. Additionally, we hypothesize that the direction of Tg shifting is influenced by the chain conformation at the block interface, which is different between the normal-tapered and inverse-tapered polymers.37,56
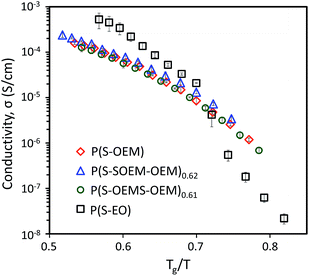
To examine the effect of Tg on the ion transport, the conductivity data for all LiCF3SO3-doped polymers were normalized by Tg as shown in Fig. 5. The Tg-scaled conductivity profiles of POEM-based polymers collapsed onto a single master curve, confirming that Tg plays a critical role for lithium-ion conduction in this BP system.
To further explore the influence of tapered interfaces on the ionic conductivity, the nonlinear Vogel–Fulcher–Tammann (VFT) equation (eqn (1)) was employed,1,57,58
 | (1) |
| Polymer | [EO]![[thin space (1/6-em)]](https://www.rsc.org/images/entities/char_2009.gif) : :![[thin space (1/6-em)]](https://www.rsc.org/images/entities/char_2009.gif) [Li] [Li] |
T g (°C)a | B (K)b |
|---|---|---|---|
a
T
g of the conducting domains (POEM![[thin space (1/6-em)]](https://www.rsc.org/images/entities/char_2009.gif) : :![[thin space (1/6-em)]](https://www.rsc.org/images/entities/char_2009.gif) LiCF3SO3 and PEO LiCF3SO3 and PEO![[thin space (1/6-em)]](https://www.rsc.org/images/entities/char_2009.gif) : :![[thin space (1/6-em)]](https://www.rsc.org/images/entities/char_2009.gif) LiCF3SO3).
b The standard deviation was determined from measurements of three different samples.
c Data fit was over a temperature range of 70 °C to 150 °C. LiCF3SO3).
b The standard deviation was determined from measurements of three different samples.
c Data fit was over a temperature range of 70 °C to 150 °C.
|
|||
| P(S-OEM) | 15![[thin space (1/6-em)]](https://www.rsc.org/images/entities/char_2009.gif) : :![[thin space (1/6-em)]](https://www.rsc.org/images/entities/char_2009.gif) 1 1 |
−47 | 1149 ± 27 |
| P(S-SOEM-OEM)0.62 | 15![[thin space (1/6-em)]](https://www.rsc.org/images/entities/char_2009.gif) : :![[thin space (1/6-em)]](https://www.rsc.org/images/entities/char_2009.gif) 1 1 |
−54 | 1057 ± 33 |
| P(S-OEMS-OEM)0.61 | 15![[thin space (1/6-em)]](https://www.rsc.org/images/entities/char_2009.gif) : :![[thin space (1/6-em)]](https://www.rsc.org/images/entities/char_2009.gif) 1 1 |
−43 | 1154 ± 55 |
| P(S-EO) | 15![[thin space (1/6-em)]](https://www.rsc.org/images/entities/char_2009.gif) : :![[thin space (1/6-em)]](https://www.rsc.org/images/entities/char_2009.gif) 1 1 |
−33 | 1523c ± 82 |
| P(S-SOEM-OEM)0.62 | 24![[thin space (1/6-em)]](https://www.rsc.org/images/entities/char_2009.gif) : :![[thin space (1/6-em)]](https://www.rsc.org/images/entities/char_2009.gif) 1 1 |
−61 | 933 ± 32 |
| P(S-SOEM-OEM)0.32 | 24![[thin space (1/6-em)]](https://www.rsc.org/images/entities/char_2009.gif) : :![[thin space (1/6-em)]](https://www.rsc.org/images/entities/char_2009.gif) 1 1 |
−51 | 1031 ± 53 |
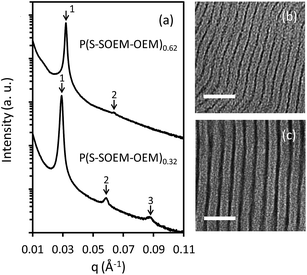
We further investigated the effect of taper fraction, ftaper, on TBP ionic conductivity using normal-tapered BPs with ftaper = 0.62 (P(S-SOEM-OEM)0.62) and ftaper = 0.32 (P(S-SOEM-OEM)0.32). The SAXS profile for LiCF3SO3-doped P(S-SOEM-OEM)0.32 exhibited a LAM phase at a salt-doping ratio of [EO]![[thin space (1/6-em)]](https://www.rsc.org/images/entities/char_2009.gif) :
:![[thin space (1/6-em)]](https://www.rsc.org/images/entities/char_2009.gif) [Li] = 15
[Li] = 15![[thin space (1/6-em)]](https://www.rsc.org/images/entities/char_2009.gif) :
:![[thin space (1/6-em)]](https://www.rsc.org/images/entities/char_2009.gif) 1 (ESI Fig. S6†). To eliminate the morphology effect on the ionic conductivity (P(S-SOEM-OEM)0.62 exhibited a HEX morphology at 15
1 (ESI Fig. S6†). To eliminate the morphology effect on the ionic conductivity (P(S-SOEM-OEM)0.62 exhibited a HEX morphology at 15![[thin space (1/6-em)]](https://www.rsc.org/images/entities/char_2009.gif) :
:![[thin space (1/6-em)]](https://www.rsc.org/images/entities/char_2009.gif) 1), a salt-doping ratio of 24
1), a salt-doping ratio of 24![[thin space (1/6-em)]](https://www.rsc.org/images/entities/char_2009.gif) :
:![[thin space (1/6-em)]](https://www.rsc.org/images/entities/char_2009.gif) 1 was chosen to compare these TBPs. Both polymers exhibit the same morphology at this ratio as demonstrated below. The SAXS patterns for LiCF3SO3-doped P(S-SOEM-OEM)0.62 and LiCF3SO3-doped P(S-SOEM-OEM)0.32 are displayed in Fig. 6(a). P(S-SOEM-OEM)0.62 showed SAXS diffraction peaks located at q/q* = 1 and 2. These peak ratios corresponded to a LAM morphology, which was supported by the TEM micrograph in Fig. 6(b). The P(S-SOEM-OEM)0.32 sample, which had a smaller taper fraction, also exhibited a LAM morphology as evidenced by the SAXS peak ratios of 1, 2, and 3 shown in Fig. 6(a) and the corresponding TEM micrograph in Fig. 6(c). From the primary peak locations, the domain spacings of LiCF3SO3-doped P(S-SOEM-OEM)0.62 and LiCF3SO3-doped P(S-SOEM-OEM)0.32 were 19.1 nm and 22.5 nm, respectively. This difference likely did not occur as a result of molecular mass or composition, which were similar between the two samples. Instead, the smaller domain spacing in P(S-SOEM-OEM)0.62 was attributed to the wider tapered interface and reduced chain stretching that resulted from the increased compatibility between the two blocks.35,37
1 was chosen to compare these TBPs. Both polymers exhibit the same morphology at this ratio as demonstrated below. The SAXS patterns for LiCF3SO3-doped P(S-SOEM-OEM)0.62 and LiCF3SO3-doped P(S-SOEM-OEM)0.32 are displayed in Fig. 6(a). P(S-SOEM-OEM)0.62 showed SAXS diffraction peaks located at q/q* = 1 and 2. These peak ratios corresponded to a LAM morphology, which was supported by the TEM micrograph in Fig. 6(b). The P(S-SOEM-OEM)0.32 sample, which had a smaller taper fraction, also exhibited a LAM morphology as evidenced by the SAXS peak ratios of 1, 2, and 3 shown in Fig. 6(a) and the corresponding TEM micrograph in Fig. 6(c). From the primary peak locations, the domain spacings of LiCF3SO3-doped P(S-SOEM-OEM)0.62 and LiCF3SO3-doped P(S-SOEM-OEM)0.32 were 19.1 nm and 22.5 nm, respectively. This difference likely did not occur as a result of molecular mass or composition, which were similar between the two samples. Instead, the smaller domain spacing in P(S-SOEM-OEM)0.62 was attributed to the wider tapered interface and reduced chain stretching that resulted from the increased compatibility between the two blocks.35,37
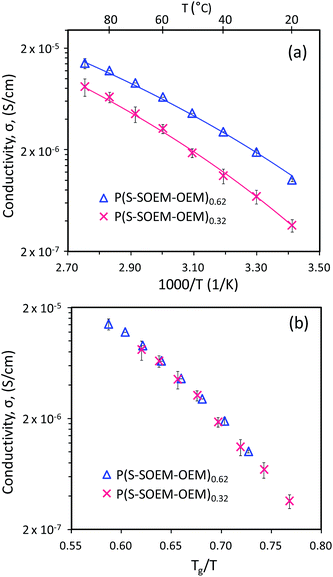
Fig. 7(a) shows the temperature-dependent ionic conductivity profiles for P(S-SOEM-OEM)0.62 and P(S-SOEM-OEM)0.32 at a salt-doping ratio of 24![[thin space (1/6-em)]](https://www.rsc.org/images/entities/char_2009.gif) :
:![[thin space (1/6-em)]](https://www.rsc.org/images/entities/char_2009.gif) 1. P(S-SOEM-OEM)0.32 exhibited lower conductivities relative to P(S-SOEM-OEM)0.62 over the entire experimental temperature range, which was expected when considering that the Tg of P(S-SOEM-OEM)0.32 was 10 °C higher than that of P(S-SOEM-OEM)0.62 (Table 2). Normalization of the data to Tg/T collapsed the ionic conductivities for the two LiCF3SO3-doped normal-tapered materials onto a single curve (Fig. 7(b)), again suggesting that ion transport in these materials is dominated by the Tg. Moreover, this result showed that the Tg could be tuned by the interfacial width, thus allowing control of the ionic conductivity. Analysis of the ionic conductivity using the VFT equation also revealed that the VFT activation energy decreased when the tapered interface was increased (Table 2). This result possibly indicates that the modification of interfacial structure between blocks can reduce the barriers for ion motion and promote ion transport. In future work, a systematic analysis of TBP mechanical properties is useful to gain insight into the additional effects of tapering. As TODT and Tg of the salt-doped BPs have shown a strong dependence on the interfacial profile between polymer blocks, an impact in mechanical properties by tapered interfaces may be expected.
1. P(S-SOEM-OEM)0.32 exhibited lower conductivities relative to P(S-SOEM-OEM)0.62 over the entire experimental temperature range, which was expected when considering that the Tg of P(S-SOEM-OEM)0.32 was 10 °C higher than that of P(S-SOEM-OEM)0.62 (Table 2). Normalization of the data to Tg/T collapsed the ionic conductivities for the two LiCF3SO3-doped normal-tapered materials onto a single curve (Fig. 7(b)), again suggesting that ion transport in these materials is dominated by the Tg. Moreover, this result showed that the Tg could be tuned by the interfacial width, thus allowing control of the ionic conductivity. Analysis of the ionic conductivity using the VFT equation also revealed that the VFT activation energy decreased when the tapered interface was increased (Table 2). This result possibly indicates that the modification of interfacial structure between blocks can reduce the barriers for ion motion and promote ion transport. In future work, a systematic analysis of TBP mechanical properties is useful to gain insight into the additional effects of tapering. As TODT and Tg of the salt-doped BPs have shown a strong dependence on the interfacial profile between polymer blocks, an impact in mechanical properties by tapered interfaces may be expected.
Conclusions
We prepared, for the first time, TBP electrolytes based on P(S-OEM) BPs. This new family of nanostructured polymer electrolytes provided a unique approach for tuning thermal and transport properties at constant molecular mass and chemical composition. Of particular importance, the tapered interfaces presented an excellent ability to manipulate Tg of BP electrolytes through adjustments in the taper profile and taper volume fraction, thus enabling the ability to design materials with tailored conductivity. This interfacial modification approach for polymer electrolytes offers an avenue for solving the dueling problems of efficiency and cost in current electrolytes and displays promising potential for energy storage devices.Acknowledgements
We gratefully acknowledge AFOSR-PECASE (FA9550-09-1-0706) for financial support. R. Remy is supported by NIST (70NANOBIOH256) and funding provided through the Department of Materials Science and Engineering at UD. This research used resources of the Advanced Photon Source, a U.S. Department of Energy (DOE) Office of Science User Facility operated for the DOE Office of Science by Argonne National Laboratory under Contract no. DE-AC02-06CH11357. We thank the W. M. Keck Electron Microscopy Facility at UD for use of the TEM and cryomicrotome facilities. We also acknowledge the Advanced Materials Characterization Laboratory at UD for the use of DSC and SAXS instruments.Notes and references
- R. C. Agrawal and G. P. Pandey, J. Phys. D: Appl. Phys., 2008, 41, 223001 CrossRef.
- J.-M. Tarascon and M. Armand, Nature, 2001, 414, 359–367 CrossRef CAS PubMed.
- K. Xu, Chem. Rev., 2014, 114, 11503–11618 CrossRef CAS PubMed.
- D. T. Hallinan and N. P. Balsara, Annu. Rev. Mater. Res., 2013, 43, 503–525 CrossRef CAS.
- J. B. Goodenough and K.-S. Park, J. Am. Chem. Soc., 2013, 135, 1167–1176 CrossRef CAS PubMed.
- I. Y. Choi, H. Kim and M. J. Park, RSC Adv., 2014, 4, 61333–61336 RSC.
- K. Xu, Chem. Rev., 2004, 104, 4303–4418 CrossRef CAS PubMed.
- K. J. Harry, D. T. Hallinan, D. Y. Parkinson, A. A. MacDowell and N. P. Balsara, Nat. Mater., 2014, 13, 69–73 CrossRef CAS PubMed.
- W. Li, H. Zheng, G. Chu, F. Luo, J. Zheng, D. Xiao, X. Li, L. Gu, H. Li, X. Wei, Q. Chen and L. Chen, Faraday Discuss., 2014 10.1039/c4fd00124a.
- M. Jacoby, Chemical & Engineering News Archive, 2013, 91, 33–37 Search PubMed.
- E. Quartarone and P. Mustarelli, Chem. Soc. Rev., 2011, 40, 2525–2540 RSC.
- R. Senthil Kumar, M. Raja, M. Anbu Kulandainathan and A. Manuel Stephan, RSC Adv., 2014, 4, 26171–26175 RSC.
- Y. Lin, J. Li, Y. Lai, C. Yuan, Y. Cheng and J. Liu, RSC Adv., 2013, 3, 10722–10730 RSC.
- W.-S. Young, W.-F. Kuan and T. H. Epps, III, J. Polym. Sci., Part B: Polym. Phys., 2014, 52, 1–16 CrossRef CAS.
- P. W. Majewski, M. Gopinadhan and C. O. Osuji, Soft Matter, 2013, 9, 7106–7116 RSC.
- W.-S. Young and T. H. Epps, III, Macromolecules, 2012, 45, 4689–4697 CrossRef CAS.
- B. K. Cho, A. Jain, S. M. Gruner and U. Wiesner, Science, 2004, 305, 1598–1601 CrossRef CAS PubMed.
- R. L. Weber, Y. S. Ye, A. L. Schmitt, S. M. Banik, Y. A. Elabd and M. K. Mahanthappa, Macromolecules, 2011, 44, 5727–5735 CrossRef CAS.
- I. Nakamura and Z.-G. Wang, ACS Macro Lett., 2014, 3, 708–711 CrossRef CAS.
- Y. Ye, S. Sharick, E. M. Davis, K. I. Winey and Y. A. Elabd, ACS Macro Lett., 2013, 2, 575–580 CrossRef CAS.
- M. Singh, O. Odusanya, G. M. Wilmes, H. B. Eitouni, E. D. Gomez, A. J. Patel, V. L. Chen, M. J. Park, P. Fragouli, H. Iatrou, N. Hadjichristidis, D. Cookson and N. P. Balsara, Macromolecules, 2007, 40, 4578–4585 CrossRef CAS.
- M. W. Schulze, L. D. McIntosh, M. A. Hillmyer and T. P. Lodge, Nano Lett., 2013, 14, 122–126 CrossRef PubMed.
- C. Wang, T. Sakai, O. Watanabe, K. Hirahara and T. Nakanishi, J. Electrochem. Soc., 2003, 150, A1166–A1170 CrossRef CAS.
- A.-V. G. Ruzette, P. P. Soo, D. R. Sadoway and A. M. Mayes, J. Electrochem. Soc., 2001, 148, A537–A543 CrossRef CAS.
- W.-F. Kuan, R. Roy, L. Rong, B. S. Hsiao and T. H. Epps, III, ACS Macro Lett., 2012, 1, 519–523 CrossRef CAS PubMed.
- R. Roy, J. K. Park, W.-S. Young, S. E. Mastroianni, M. S. Tureau and T. H. Epps, III, Macromolecules, 2011, 44, 3910–3915 CrossRef CAS PubMed.
- P. Hodrokoukes, G. A. Floudas, S. Pispas and N. Hadjichristidis, Macromolecules, 2001, 34, 650–657 CrossRef CAS.
- T. Hashimoto, Y. Tsukahara, K. Tachi and H. Kawai, Macromolecules, 1983, 16, 648–657 CrossRef CAS.
- T. Hashimoto, Y. Tsukahara and H. Kawai, Polym. J., 1983, 15, 699–711 CrossRef CAS.
- R. Jiang, Q. Jin, B. Li, D. Ding, R. A. Wickham and A.-C. Shi, Macromolecules, 2008, 41, 5457–5465 CrossRef CAS.
- M. M. Mok, S. Pujari, W. R. Burghardt, C. M. Dettmer, S. T. Nguyen, C. J. Ellison and J. M. Torkelson, Macromolecules, 2008, 41, 5818–5829 CrossRef CAS.
- M. D. Lefebvre, M. Olvera de la Cruz and K. R. Shull, Macromolecules, 2004, 37, 1118–1123 CrossRef CAS.
- K. R. Shull, Macromolecules, 2002, 35, 8631–8639 CrossRef CAS.
- K. Matyjaszewski and J. H. Xia, Chem. Rev., 2001, 101, 2921–2990 CrossRef CAS PubMed.
- T. Pakula and K. Matyjaszewski, Macromol. Theory Simul., 1996, 5, 987–1006 CrossRef CAS.
- N. Singh, M. S. Tureau and T. H. Epps, III, Soft Matter, 2009, 5, 4757–4762 RSC.
- J. R. Brown, S. W. Sides and L. M. Hall, ACS Macro Lett., 2013, 2, 1105–1109 CrossRef CAS.
- B. S. Beckingham and R. A. Register, Macromolecules, 2011, 44, 4313–4319 CrossRef CAS.
- M. M. Mok, J. Kim and J. M. Torkelson, J. Polym. Sci., Part B: Polym. Phys., 2008, 46, 48–58 CrossRef CAS.
- M. M. Mok, J. Kim, C. L. H. Wong, S. R. Marrou, D. J. Woo, C. M. Dettmer, S. T. Nguyen, C. J. Ellison, K. R. Shull and J. M. Torkelson, Macromolecules, 2009, 42, 7863–7876 CrossRef CAS.
- T. A. Huy, L. H. Hai, R. Adhikari, R. Weidisch, G. H. Michler and K. Knoll, Polymer, 2003, 44, 1237–1245 CrossRef CAS.
- S. Jouenne, J. A. González-León, A.-V. Ruzette, P. Lodefier, S. Tencé-Girault and L. Leibler, Macromolecules, 2007, 40, 2432–2442 CrossRef CAS.
- J. Rolland, J. Brassinne, J. P. Bourgeois, E. Poggi, A. Vlad and J. F. Gohy, J. Mater. Chem. A, 2014, 2, 11839–11846 CAS.
- J.-H. Helen Wang and R. H. Colby, Soft Matter, 2013, 9, 10275–10286 RSC.
- X. Jiang, G. Zhang, R. Narain and S. Liu, Soft Matter, 2009, 5, 1530–1538 RSC.
- F. R. Mayo and F. M. Lewis, J. Am. Chem. Soc., 1944, 66, 1594–1601 CrossRef CAS.
- J. Brandrup, E. H. Immergut and E. A. Grulke, in Polymer Handbook, Wiley, New York, 4th edn, 1999 Search PubMed.
- D. W. Van Krevelen and K. Te Nijenhuis, in Properties of Polymers, ed. D. W. V. Krevelen and K. T. Nijenhuis, Elsevier, Amsterdam, 4th edn, 2009, pp. 71–108 Search PubMed.
- W.-S. Young and T. H. Epps, III, Macromolecules, 2009, 42, 2672–2678 CrossRef CAS.
- W.-S. Young, J. N. L. Albert, A. B. Schantz and T. H. Epps, III, Macromolecules, 2011, 44, 8116–8123 CrossRef CAS.
- C. D. Robitaille and D. Fauteux, J. Electrochem. Soc., 1986, 133, 315–325 CrossRef CAS.
- S. Liang, M. V. O'Reilly, U. H. Choi, H.-S. Shiau, J. Bartels, Q. Chen, J. Runt, K. I. Winey and R. H. Colby, Macromolecules, 2014, 47, 4428–4437 CrossRef CAS.
- R. Khurana, J. L. Schaefer, L. A. Archer and G. W. Coates, J. Am. Chem. Soc., 2014, 136, 7395–7402 CrossRef CAS PubMed.
- M. D. Green, D. Wang, S. T. Hemp, J.-H. Choi, K. I. Winey, J. R. Heflin and T. E. Long, Polymer, 2012, 53, 3677–3686 CrossRef CAS.
- Y. Zhang, C. A. Lim, W. Cai, R. Rohan, G. Xu, Y. Sun and H. Cheng, RSC Adv., 2014, 4, 43857–43864 RSC.
- P. Hodrokoukes, S. Pispas and N. Hadjichristidis, Macromolecules, 2002, 35, 834–840 CrossRef CAS.
- K. P. Barteau, M. Wolffs, N. A. Lynd, G. H. Fredrickson, E. J. Kramer and C. J. Hawker, Macromolecules, 2013, 46, 8988–8994 CrossRef CAS.
- L. D. McIntosh, T. Kubo and T. P. Lodge, Macromolecules, 2014, 47, 1090–1098 CrossRef CAS.
- O. Kim, S. Y. Kim, H. Ahn, C. W. Kim, Y. M. Rhee and M. J. Park, Macromolecules, 2012, 45, 8702–8713 CrossRef CAS.
- R. Yuan, A. A. Teran, I. Gurevitch, S. A. Mullin, N. S. Wanakule and N. P. Balsara, Macromolecules, 2013, 46, 914–921 CrossRef CAS.
- J. Karo and D. Brandell, Solid State Ionics, 2009, 180, 1272–1284 CrossRef CAS.
Footnote |
| † Electronic supplementary information (ESI) available: Plot of the reactivity ratio evaluation of styrene and OEM monomers, plot of the taper composition profile as a function of ATRP reaction time, and additional characterization data (GPC, SAXS, and DSC). See DOI: 10.1039/c4ra15953e |
| This journal is © The Royal Society of Chemistry 2015 |

