 Open Access Article
Creative Commons Attribution 3.0 Unported Licence
A unique strategy towards high dielectric constant and low loss with multiwall carbon nanotubes anchored onto graphene oxide sheets
Sourav
Biswas†
,
Goutam Prasanna
Kar†
,
Deepshikha
Arora
and
Suryasarathi
Bose
*
Department of Materials Engineering, Indian Institute of Science, Bangalore-560012, India. E-mail: sbose@materials.iisc.ernet.in; Tel: +91-80-2293 3407
First published on 23rd February 2015
Abstract
Multiwall carbon nanotubes (MWNTs) were anchored onto graphene oxide sheets (GOs) via diazonium and C–C coupling reactions and characterized by spectroscopic and electron microscopic techniques. The thus synthesized MWNT–GO hybrid was then melt mixed with 50/50 polyamide6–maleic anhydride-modified acrylonitrile-butadiene-styrene (PA6–mABS) blend to design materials with high dielectric constant (ε′) and low dielectric loss. The phase morphology was studied by SEM and it was observed that the MWNT–GO hybrid was selectively localized in the PA6 phase of the blend. The ε′ scales with the concentration of MWNT–GO in the blends, which interestingly showed a very low dielectric loss (<0.2) making them potential candidate for capacitors. In addition, the dynamic storage modulus scales with the fraction of MWNT–GO in the blends, demonstrating their reinforcing capability as well.
Introduction
Polymeric composites with high dielectric constant and low dielectric loss have received considerable attention in the recent past.1–4 They have been explored for various applications in high energy storage devices, electronics and other industries.5–7 Dielectric properties arise from the uneven displacement of electrons under an external electric field. Complex permittivity is expressed as ε* = ε′ − iε′′, where ε′ and ε′′ are the real and imaginary parts of the complex permittivity.8–10 According to the Kramers–Kronig relation, ε′ and ε′′ depend on the frequency, ω, of the applied electric field, and this is expressed as Kramers–Kronig relation,11 | (1) |
The real part of the permittivity is expressed as ε′ = ε0εr, where ε0 is the vacuum permittivity (8.85 × 10⁻¹² F m−1) and εr is the relative permittivity of the material. Higher values of ε′ indicate the material’s ability to store energy under an applied electrical field. The imaginary part of the permittivity (ε′′) is the dielectric loss. It is envisaged that under the influence of an external electric field, part of the electrical energy is dissipated as heat due to charge hopping. Hence, for better performance, this dielectric loss needs to be minimized. The energy stored by a parallel plate capacitor is given by
 | (2) |
 | (3) |
 | (4) |
 is the breakdown field strength.
Polymers generally have a very low dielectric constant (<10) but high breakdown field strength.6 On the other hand, ferroelectric ceramic particles have a very high dielectric constant (ε′) but very low breakdown strength.12 So, a high ε′ and low loss can be achieved by incorporating ceramic particles into a polymer matrix. But this strategy usually requires a higher fraction of the ceramic particles and hence produces an unwanted increase of the composite rigidity.13 In most other cases the increase of the dielectric constant has been met with relatively high loss tangent values, which is also an important factor while considering materials for capacitor applications.14 Due to the addition of ferroelectric ceramic particles, the interfacial polarization is increased.12 Hence, it is very difficult to obtain high dielectric permittivity and low loss tangent values at the same time. However, by altering the interfacial interaction between the ceramic particles and the polymer matrix, the dielectric constant can be tuned.5 So, the surface chemistry of the particles can play an important role in obtaining materials with a high dielectric constant.15,16
In the recent past, in view of good electrical and mechanical integrity, carbon-based nanostructures like multiwall carbon nanotubes (MWNTs) and graphene have attracted a great deal of interest for a wide range of applications.17,18 MWNTs show relatively high dielectric loss due to energy dissipation.8 Recently, reduced graphene oxide sheets (rGO) with partial chlorination were shown to exhibit a high dielectric constant and low dielectric loss, due to the polarizable C–Cl bond.19
In an attempt to enhance the dielectric constant and reduce the losses, a unique strategy was adopted here by chemically conjugating MWNTs with graphene oxide sheets. The hybrid nanoparticles were then melt blended with 50/50 (wt/wt) PA6–mABS blends, which have a low dielectric constant but are mechanically stable. The dielectric, rheological and dynamical mechanical properties were evaluated as a function of the amount of hybrid particles.
Experimental section
Materials
PA6 (1022B) was kindly provided by Ube Industries. mABS (Bondyram 6000, MFI 8 g per 10 min) was obtained from Polyram. The pristine MWNTs (NC 7000 of 90% purity, with an average diameter of 9.5 nm and an average length of 1.5 μm) were obtained from Nanocyl, Belgium. 4,4′-Methylenedianiline (MDA) was procured from Sigma Aldrich. The solvents like ethanol, tetrahydrofuran (THF), chloroform (CHCl3), hydrochloric acid and sodium nitrite (NaNO2) were obtained from Merck, India.Synthesis of NH2 terminated GO
GO was synthesized by a modified Hummers method as described in our earlier work.20 GO–NH2 was synthesized by a nucleophillic substitution reaction.21 Typically, 250 mg of GO was suspended in 100 ml of THF and sonicated to exfoliate the sheets. The dispersed GO was then mixed with 250 mg of MDA and refluxed in a oil bath under a nitrogen atmosphere at 80 °C for 8 h. The solids thus obtained were separated by vacuum filtration, and re-dispersed in 100 ml of ethanol. This was again subjected to vacuum filtration. By repeating this purification cycle for about four times, the obtained solids were dried at 60 °C under vacuum for 24 h, thus yielding GO–NH2.Synthesis of hybrid MWNT–GO
A diazotization reaction was adopted to synthesize MWNT–GO hybrid structures.22 Briefly, the required amount of GO–NH2 was added to 40% HCl and bath sonicated. NaNO2 was then added under ice-cold conditions (0–5 °C) with stirring. This step converts GO–NH2 to a diazonium salt of GO. After 2 h of stirring, the pre-sonicated MWNTs (in dilute HCl) were then added under an inert atmosphere. N2 escapes from the diazonium salt of GO and a MWNT–GO hybrid is formed via a C–C coupling reaction. The mixture was then washed by dilute HCl followed by water and vacuum dried overnight. The same amounts of MWNTs and GO–NH2 were used, thus yielding MWNT–GO (1![[thin space (1/6-em)]](https://www.rsc.org/images/entities/char_2009.gif) :
:![[thin space (1/6-em)]](https://www.rsc.org/images/entities/char_2009.gif) 1).
1).
Blend preparation
50/50 (wt/wt) blends of PA6–mABS were prepared with or without MWNT–GO by melt mixing using a Minilab II HAAKE extruder CTW5 (7 cc) at 260 °C with a rotational speed of 60 rpm for 20 min.23 The mixing was performed under N2 atmosphere to prevent oxidative degradation. The samples were pre-dried at 80 °C in a vacuum oven for 24 h prior to processing to remove traces of moisture.24Characterizations
Fourier transform infrared (FTIR) spectroscopy was carried out using Perkin-Elmer GX in the range of 4000–400 cm−1 using a resolution of 4 cm−1 and KBr pellets.Transmission Electron Microscopy (TEM) images were acquired using a Tecnai G2 F30 at 300 kV.
Morphological analysis for various blends was assessed by using scanning electron microscope on ESEM (environmental scanning electron microscope) at a 10 kV accelerating voltage. The extruded samples were cryofractured in liquid nitrogen. Then the mABS phase was selectively etched out by chloroform at room temperature.
The complex viscosity and storage modulus of the melt state for all the blends were measured by using a Discovery Hybrid Rheometer (DHR-3), TA-instruments, using a parallel plate geometry of a 25 mm diameter and 1 mm gap. The extrude strands were vacuum dried at 80 °C for 12 h before performing the rheological measurements. Experiments were carried out at a fixed temperature of 260 °C by varying the frequency from 0.1 to 100 rad s−1 at 1% strain rate under nitrogen atmosphere to prevent any degradation of the sample.
Dielectric measurements were performed on compression-molded disks using an Alpha-N Analyzer (Novocontrol, Hundsangen, Germany) in the broad frequency range of 100 ≤ ω ≤ 106 Hz.
Dynamic mechanical thermal analysis (DMTA) was done on a TA Instruments Q800 Dynamic Mechanical Analyzer on a compression-molded film.
Results and discussion
Synthesis and characterization of MWNT–GO hybrids
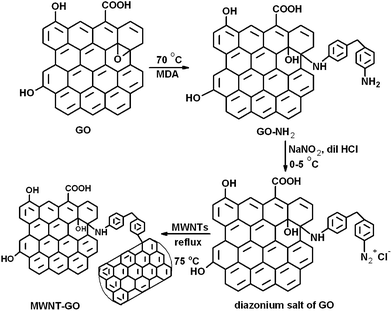
The MWNTs were grafted onto the GO sheets by a diazotization reaction as described in Scheme 1. Amine groups were introduced onto the GO sheets by reacting with MDA. The amine groups of MDA react with the epoxy groups of the GO. The terminal amine groups thus generated on GO–NH2 were converted to diazonium salt (–N2+Cl−) by reacting with NaNO2 in the presence of dilute HCl at 0–5 °C. The mixture was then heated to 75 °C, followed by the addition of MWNTs to facilitate the C–C coupling reaction with GO. This is well supported by FT-IR (Fig. 1a) where C–N bond formation (1300 cm−1) further supports the reaction between the MWNTs and GO. The broad peak in the range 3650–3250 cm−1 is the overlap of the O–H and N–H vibrational frequencies.21 The peak at 2930 cm−1 corresponds to the C–H stretching vibration. The HR-TEM images shown in Fig. 1b and c further confirm this conjugation between the MWNTs and GO sheets.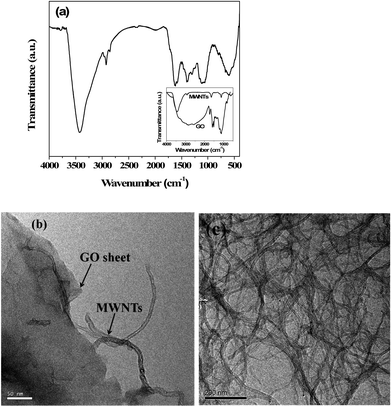 | ||
| Fig. 1 (a) FT-IR spectra of MWNT–GO (inset shows the FTIR for GO–NH2 and MWNTs) (b) TEM micrograph of MWNT–GO and (c) TEM micrograph of entangled MWNTs. | ||
Phase morphology and selective localization of MWNT–GO in the blends
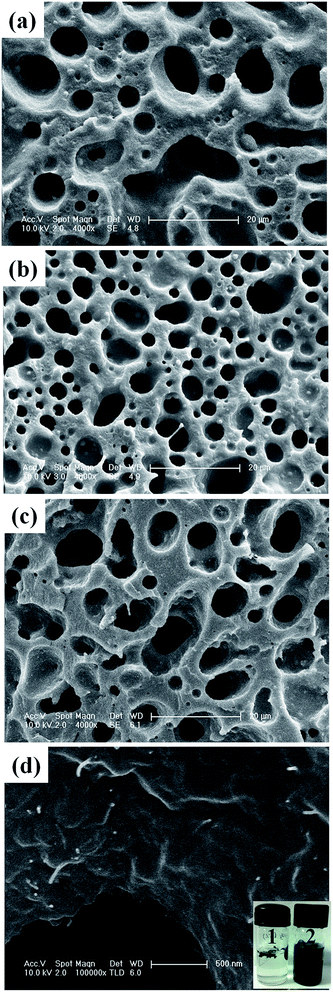
The phase morphology of PA6–mABS (50/50, wt/wt) blends with or without MWNT–GO hybrid was studied by SEM. The mABS phase was etched with chloroform.25 The holes thus generated represent the etched out mABS phase as shown in Fig. 2.26It is well known that PA6 and mABS are immiscible in nature, hence, they present a coarse morphology.23 It is evident from Fig. 2 that mABS is randomly dispersed in the PA6 matrix. It is envisaged that the maleic anhydride groups in mABS can react with the PA6 during blending.27 However, as the maleic anhydride content in mABS is less than 0.7 wt% (as provided by the supplier) the extent of the reaction can be less. The possibility of the terminal amine groups in PA6 reacting with the carbonyl acid groups of GO cannot be ruled out either. The possible reactions are explained in more detail in the next section by spectroscopic evidence. The SEM images (Fig. 2a–c) show a sea-island structure of the PA6–mABS blends in the presence of MWNT–GO.
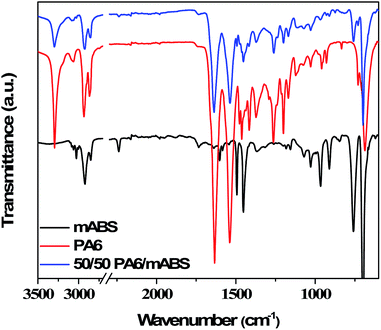
The extent of various possible reactions was assessed by FT-IR (Fig. 3). The peaks at 2930 cm−1 for C–H stretching, 2236 cm−1 for C–N stretching, 1500–2000 cm−1 for polystyrene moieties and 1733 cm−1 for the C![[double bond, length as m-dash]](https://www.rsc.org/images/entities/char_e001.gif) O group of maleic anhydride are evident in the FTIR spectra of mABS.25 The characteristic peak for free amine groups at 3292 cm−1 in the FTIR spectra for neat PA6 and the decrease in the intensity of this peak for the blends clearly suggest the reaction between the terminal amine groups in PA6 with either maleic anhydride groups in mABS or carbonyl groups on the GO. This is also supported by the peak at 3440 cm−1 corresponding to the hydrogen bonded amine group in the blends. In addition, the bands at 1633 cm−1 and 1539 cm−1 can be attributed to amide I and amide II, respectively, in the FTIR spectra for neat PA6. The bands at 1370, 1260 and 1205 cm−1 corresponding to amide III and CH2 wagging are noted in the FTIR spectra for neat PA6.25 In addition, the imide-five-ring deformation vibration appears at 749 cm−1.
O group of maleic anhydride are evident in the FTIR spectra of mABS.25 The characteristic peak for free amine groups at 3292 cm−1 in the FTIR spectra for neat PA6 and the decrease in the intensity of this peak for the blends clearly suggest the reaction between the terminal amine groups in PA6 with either maleic anhydride groups in mABS or carbonyl groups on the GO. This is also supported by the peak at 3440 cm−1 corresponding to the hydrogen bonded amine group in the blends. In addition, the bands at 1633 cm−1 and 1539 cm−1 can be attributed to amide I and amide II, respectively, in the FTIR spectra for neat PA6. The bands at 1370, 1260 and 1205 cm−1 corresponding to amide III and CH2 wagging are noted in the FTIR spectra for neat PA6.25 In addition, the imide-five-ring deformation vibration appears at 749 cm−1.
In order to assess the selective localization of the hybrid structure in the blends, solution-dissolution experiments were performed.28 Typically, known amounts of the samples were dissolved in formic acid to remove the PA6 phase and in chloroform to remove the mABS phase from the blends. The vial containing formic acid turned dark after brief sonication indicating that the hybrid nanoparticles were selectively localized in the PA6 phase of the blend. This was further supported by the fact that the vial containing chloroform showed no change in colour. Moreover, the higher resolution SEM images show the nanoparticles in the remaining PA6 phase (Fig. 2d) where bright dots represent MWNTs.
State of dispersion assessed via melt rheology
Melt rheology is a very sensitive tool to study the state of dispersion of the nanoparticles in a given polymeric matrix.21,29–32Fig. 4a shows the storage modulus as a function of frequency for various blends. The storage modulus of PA6 is lower than mABS over the entire frequency range, while for the blends the storage modulus is in between that of the components. Blends with MWNT–GO hybrid particles exhibited a higher storage modulus with respect to the neat blends. In addition, the storage modulus scales with increasing fraction of MWNT–GO in the blends, indicating restricted motion of the macromolecules in the flow field.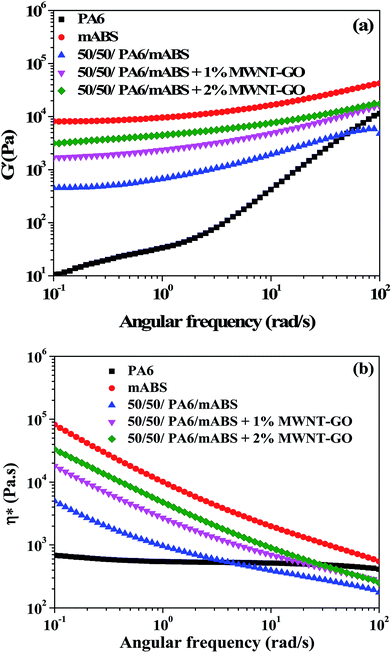 | ||
| Fig. 4 Melt rheological properties: (a) storage modulus and (b) complex viscosity as a function of frequency for various blends and the constituent homopolymers. | ||
The complex viscosity of the blends as a function of frequency (Fig. 4b) clearly shows a pseudo-solid nature and distinct yield stress in the lower frequency region. Neat PA6 exhibited Newtonian like behavior in the measured frequency range, whereas mABS and the different blends showed a strong shear thinning behavior with yield stress in the lower frequency region.25 The effect of particles on the flow properties is most prominent at lower frequencies where sufficient time is available for molecular relaxation. It was observed that the complex viscosity of the blends scaled with the fraction of MWNT–GO in the blends.24
Dielectric properties
Dielectric properties were measured at room temperature. Fig. 5a–c shows the dielectric constant (ε′), dielectric loss tangent (tan![[thin space (1/6-em)]](https://www.rsc.org/images/entities/char_2009.gif) δ) and AC electrical conductivity (σAC) for the various blends investigated here. The dielectric constant of the blend substantially increased with respect to the neat blend upon addition of MWNT–GO hybrid nanoparticles. For instance, at 100 Hz, the neat blend showed a ε′ of 22.5, whereas the blends with 1 wt% MWNT–GO and 2 wt% MWNT–GO showed a ε′ of 46.5 and 62.5, respectively (Table 1). Interestingly, the hybrid MWNT–GO structures showed a higher dielectric constant compared to individual MWNTs (or GO). At 100 Hz the dielectric constants of the 50/50 PA6–mABS blend with 1 wt% GO and 1 wt% MWNTs were 22.5 and 28.5, respectively, and as explained above, the dielectric constant of MWNT–GO was much higher. The dielectric constant is increased by the easy polarization of the electrons residing in the π orbital of the MWNT–GO. The charge carrier originating under the electric field of the electrode migrates through the blend and accumulates at the interface as the relaxation time is different for the components. However, all the blends are insulating at room temperature (Fig. 5b). This is an ideal criterion for a dielectric material where the dielectric constant is higher but does not allow the free flow of electrons, thereby rendering insulating characteristics to the materials. This is also reflected in the dielectric loss tangent (Fig. 5c). The tan(δ) value of the neat blend is 0.02, and for the blends with MWNT–GO hybrid the loss tangent values are 0.12 (for 1 wt% MWNT–GO) and 0.16 (for 2 wt% MWNT–GO) at 100 Hz. So, the increase of the dielectric constant is attributed to the high interfacial polarization occurring at the interface of the blend and MWNT–GO.11,33 The dielectric constant progressively increases with decreasing frequency. The components which are insulating, MWNTs which are conducting and GO sheets that are insulating but are composed of an abundant π-electron cloud, lead to a large disparity in the dielectric constant.34 The increased dielectric dispersion seems to originate from the MWS effect (Maxwell–Wagner–Sillars polarization). This study clearly demonstrates that by anchoring MWNTs onto GO sheets, the dielectric constant of the material can be significantly enhanced, yet low dielectric loss achieved due to the restricted flow of electrons. It is a well-known fact that MWNTs enhance the dielectric constant of materials, however, also increase the dielectric loss due to leakage current. Hence, this unique strategy of anchoring MWNTs onto the GO sheets can trap charge at the interface of materials that show very different dielectric constants. Such materials can potentially be explored for capacitor applications.
δ) and AC electrical conductivity (σAC) for the various blends investigated here. The dielectric constant of the blend substantially increased with respect to the neat blend upon addition of MWNT–GO hybrid nanoparticles. For instance, at 100 Hz, the neat blend showed a ε′ of 22.5, whereas the blends with 1 wt% MWNT–GO and 2 wt% MWNT–GO showed a ε′ of 46.5 and 62.5, respectively (Table 1). Interestingly, the hybrid MWNT–GO structures showed a higher dielectric constant compared to individual MWNTs (or GO). At 100 Hz the dielectric constants of the 50/50 PA6–mABS blend with 1 wt% GO and 1 wt% MWNTs were 22.5 and 28.5, respectively, and as explained above, the dielectric constant of MWNT–GO was much higher. The dielectric constant is increased by the easy polarization of the electrons residing in the π orbital of the MWNT–GO. The charge carrier originating under the electric field of the electrode migrates through the blend and accumulates at the interface as the relaxation time is different for the components. However, all the blends are insulating at room temperature (Fig. 5b). This is an ideal criterion for a dielectric material where the dielectric constant is higher but does not allow the free flow of electrons, thereby rendering insulating characteristics to the materials. This is also reflected in the dielectric loss tangent (Fig. 5c). The tan(δ) value of the neat blend is 0.02, and for the blends with MWNT–GO hybrid the loss tangent values are 0.12 (for 1 wt% MWNT–GO) and 0.16 (for 2 wt% MWNT–GO) at 100 Hz. So, the increase of the dielectric constant is attributed to the high interfacial polarization occurring at the interface of the blend and MWNT–GO.11,33 The dielectric constant progressively increases with decreasing frequency. The components which are insulating, MWNTs which are conducting and GO sheets that are insulating but are composed of an abundant π-electron cloud, lead to a large disparity in the dielectric constant.34 The increased dielectric dispersion seems to originate from the MWS effect (Maxwell–Wagner–Sillars polarization). This study clearly demonstrates that by anchoring MWNTs onto GO sheets, the dielectric constant of the material can be significantly enhanced, yet low dielectric loss achieved due to the restricted flow of electrons. It is a well-known fact that MWNTs enhance the dielectric constant of materials, however, also increase the dielectric loss due to leakage current. Hence, this unique strategy of anchoring MWNTs onto the GO sheets can trap charge at the interface of materials that show very different dielectric constants. Such materials can potentially be explored for capacitor applications.
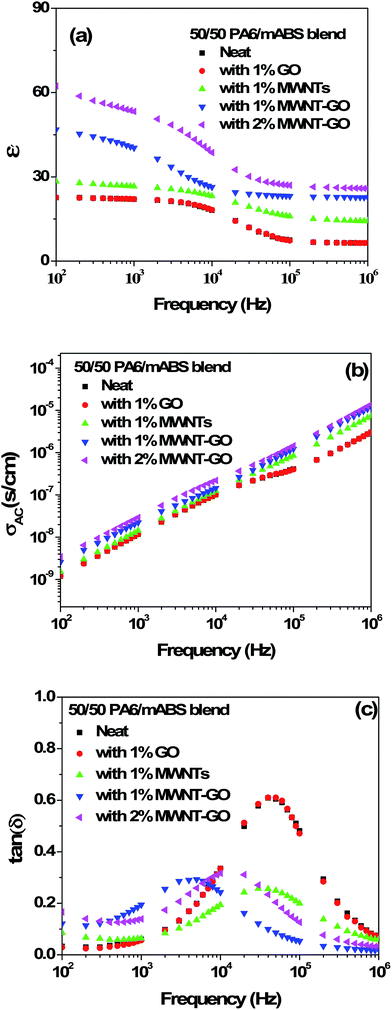 | ||
| Fig. 5 (a) Dielectric constant, (b) AC electrical conductivity and (c) tan(δ) as function of frequency for various blends investigated here. | ||
| Blend | ε′ | tan(δ) |
|---|---|---|
| 50/50 PA6/mABS neat | 22.5 | 0.02 |
| 50/50 PA6/mABS with 1 wt% GO | 22.5 | 0.02 |
| 50/50 PA6/mABS with 1 wt% MWNT | 28.5 | 0.08 |
| 50/50 PA6/mABS with 1 wt% MWNT–GO | 46.5 | 0.12 |
| 50/50 PA6/mABS with 2 wt% MWNT–GO | 62.5 | 0.16 |
Structural behaviour of the blends: effect of MWNT–GO
The reinforcing capability of the hybrid nanoparticles was evaluated by DMTA.28Fig. 6 shows the variation in elastic storage modulus (E′) as a function of temperature. It is evident that in the lower temperature range (−10–100 °C) the storage E′ is significantly higher for the blends with MWNT–GO, in striking contrast to the neat blends. It is evident from the melt rheological investigations that the hybrid nanoparticles form a pseudo-solid like structure in the blend. Hence, the increase in the elastic modulus can be related to the reinforcing effects of the hybrid nanoparticles. Moreover, the enhanced interfacial adhesion between the functional moieties on the GO sheets and PA6–mABS can facilitate better stress transfer at the interface. Interestingly, from the tan(δ) plots it can be observed that the Tg of mABS has decreased on addition of 2 wt% MWNT–GO, demonstrating the fact that the hybrid nanoparticles act as a plasticizing agent. The enhanced elastic storage modulus in the presence of MWNT–GO limits the possibility of chain scission. A more detailed investigation is required to get more insight in the plasticization effect in the presence of MWNT–GO hybrid particles.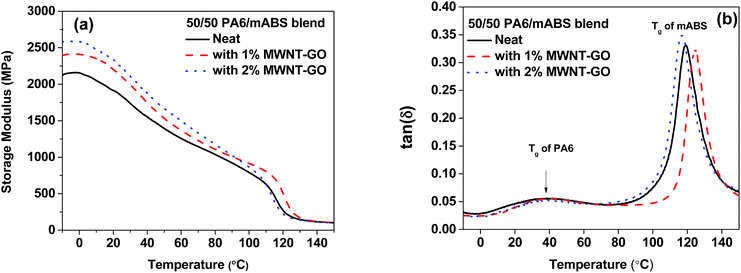 | ||
| Fig. 6 Dynamic mechanical thermal analysis for the various blends investigated here: (a) variation of storage modulus and (b) variation of tan(δ) with temperature. | ||
Conclusions
In summary, a hybrid nanostructure of MWNTs anchored onto graphene oxide sheets was synthesized and melt blended with PA6–mABS blends. The hybrid nanoparticles were localized in the PA6 phase of the blend as confirmed by electron microscopic techniques. The hybrid nanostructures enhanced the dielectric constant of the blends by three fold in striking contrast to the neat blends and interestingly, exhibited low dielectric loss. This enhancement was attributed to the increased specific surface area of the conductor–insulator hybrid particles leading to increased interfacial polarization in the blend. The elastic storage modulus also improved with the addition of MWNT–GO hybrid structures. Such materials can be explored for capacitor type applications.Acknowledgements
The authors gratefully acknowledge financial support from DST (India).References
- K. Yang, X. Huang, L. Fang, J. He and P. Jiang, Nanoscale, 2014, 6, 14740–14753 RSC.
- C. Pecharromán, F. Esteban-Betegón, J. F. Bartolomé, S. López-Esteban and J. S. Moya, Adv. Mater., 2001, 13, 1541–1544 CrossRef.
- Z. M. Dang, Y. H. Lin and C. W. Nan, Adv. Mater., 2003, 15, 1625–1629 CrossRef CAS.
- M. Sharma, S. Ranganatha, A. K. Kalyani, R. Ranjan, G. Madras and S. Bose, Mater. Res. Express, 2014, 1, 045301 CrossRef.
- J.-Y. Kim, T. Kim, J. W. Suk, H. Chou, J.-H. Jang, J. H. Lee, I. N. Kholmanov, D. Akinwande and R. S. Ruoff, Small, 2014, 10, 3405–3411 CrossRef CAS PubMed.
- Q. M. Zhang, H. F. Li, M. Poh, F. Xia, Z. Y. Cheng, H. S. Xu and C. Huang, Nature, 2002, 419, 284–287 CrossRef CAS PubMed.
- R. Liu, J. Wang, Q. Li, S. Li, S. Zhang and X. Ding, J. Appl. Polym. Sci., 2014, 131 DOI:10.1002/app.39975.
- L. Wang and Z.-M. Dang, Appl. Phys. Lett., 2005, 87, 042903 CrossRef.
- C. Yang, Y. Lin and C. W. Nan, Carbon, 2009, 47, 1096–1101 CrossRef CAS.
- J.-K. Yuan, S.-H. Yao, A. Sylvestre and J. Bai, J. Phys. Chem. C, 2011, 116, 2051–2058 Search PubMed.
- P. Barber, S. Balasubramanian, Y. Anguchamy, S. Gong, A. Wibowo, H. Gao, H. J. Ploehn and H.-C. zur Loye, Materials, 2009, 2, 1697–1733 CrossRef CAS.
- M. Arbatti, X. Shan and Z. Cheng, Adv. Mater., 2007, 19, 1369–1372 CrossRef CAS.
- D. K. Das-Gupta and K. Doughty, Thin Solid Films, 1988, 158, 93–105 CrossRef CAS.
- P. Mishra and P. Kumar, Compos. Sci. Technol., 2013, 88, 26–32 CrossRef CAS.
- M.-F. Lin and P. S. Lee, J. Mater. Chem. A, 2013, 1, 14455–14459 CAS.
- L. Xie, X. Huang, C. Wu and P. Jiang, J. Mater. Chem., 2011, 21, 5897–5906 RSC.
- S. Bose, R. A. Khare and P. Moldenaers, Polymer, 2010, 51, 975–993 CrossRef CAS.
- C. Li, E. T. Thostenson and T.-W. Chou, Compos. Sci. Technol., 2008, 68, 1227–1249 CrossRef CAS.
- J.-Y. Kim, W. H. Lee, J. W. Suk, J. R. Potts, H. Chou, I. N. Kholmanov, R. D. Piner, J. Lee, D. Akinwande and R. S. Ruoff, Adv. Mater., 2013, 25, 2308–2313 CrossRef CAS PubMed.
- P. Xavier, K. Sharma, K. Elayaraja, K. S. Vasu, A. K. Sood and S. Bose, RSC Adv., 2014, 4, 12376–12387 RSC.
- G. P. Kar, S. Biswas and S. Bose, Phys. Chem. Chem. Phys., 2015, 17, 1811–1821 RSC.
- M. Kotal and A. K. Bhowmick, J. Phys. Chem. C, 2013, 117, 25865–25875 CAS.
- S. Bose, A. R. Bhattacharyya, P. V. Kodgire and A. Misra, Polymer, 2007, 48, 356–362 CrossRef CAS.
- S. Bose, A. R. Bhattacharyya, A. P. Bondre, A. R. Kulkarni and P. Poetschke, J. Polym. Sci., Part B: Polym. Phys., 2008, 46, 1619–1631 CrossRef CAS.
- S. Bose, A. R. Bhattacharyya, A. R. Kulkarni and P. Pötschke, Compos. Sci. Technol., 2009, 69, 365–372 CrossRef CAS.
- S. Bose, A. R. Bhattacharyya, P. V. Kodgire, A. Misra and P. Pötschke, J. Appl. Polym. Sci., 2007, 106, 3394–3408 CrossRef CAS.
- L. Zhou, Y. Wan, X. Chen, S. Sun and C. Zhou, Polym. Compos., 2014, 35, 864–871 CrossRef CAS.
- S. Bose, A. R. Bhattacharyya, L. Häußler and P. Pötschke, Polym. Eng. Sci., 2009, 49, 1533–1543 CAS.
- G. P. Kar, N. Begam, J. K. Basu and S. Bose, Macromolecules, 2014, 47, 7525–7532 CrossRef CAS.
- G. P. Kar, P. Xavier and S. Bose, Phys. Chem. Chem. Phys., 2014, 16, 17811–17821 RSC.
- G. P. Kar, A. Bharati, P. Xavier, G. Madras and S. Bose, Phys. Chem. Chem. Phys., 2015, 17, 868–877 RSC.
- A. Bharati, P. Xavier, G. P. Kar, G. Madras and S. Bose, J. Phys. Chem. B, 2014, 118, 2214–2225 CAS.
- S. Y. Yang, K. Shin and C. E. Park, Adv. Funct. Mater., 2005, 15, 1806–1814 CrossRef CAS.
- J. W. Wang, Q. D. Shen, C. Z. Yang and Q. M. Zhang, Macromolecules, 2004, 37, 2294–2298 CrossRef CAS.
Footnote |
| † GPK and SB made equal contribution to this work. |
| This journal is © The Royal Society of Chemistry 2015 |

