The effect of surfactant type and concentration on the size and stability of microbubbles produced in a capillary embedded T-junction device

M. Parhizkara, M. Edirisinghea and E. Stride*ab
aDepartment of Mechanical Engineering, University College London, Torrington Place, London, WC1E 7JE, UK. E-mail: eleanor.stride@eng.ox.ac.uk
bInstitute of Biomedical Engineering, Department of Engineering Science, University of Oxford, Old Road Campus Research Building, Headington, Oxford OX3 7DQ, UK

Received 24th November 2014 , Accepted 19th December 2014

First published on 19th December 2014


Abstract

This work presents an investigation of the effect of various surfactants on microbubble formation, size and stability in a capillary embedded T-Junction microfluidic device. Four different surfactants were chosen. An anionic surfactant, sodium dodecyl sulfate (SDS), two non-ionic surfactants, polyoxyethylene sorbitan monopalmitate (Tween 40) and polyoxyethylene glycol 40 stearate (PEG 40), and a cationic surfactant, cetyltrimethyl ammonium bromide (CTAB). Each surfactant was added to 50 wt% aqueous glycerol solution at high concentration (above the critical micelle concentration) varying from 2 to 5 and 10 wt%. Static surface tension and contact angle were measured, as well as the viscosity of the solutions. While the value of surface tension did not significantly change with increasing surfactant concentration, other properties of the solutions (i.e. viscosity and contact angle) were affected. Microbubbles with sizes varying from 50 to 360 μm all with polydispersity index values of <2% were produced with this technique. The nonionic surfactants were found to produce smaller bubbles. This is likely to have been due to their higher adsorption on to the hydrophobic channel surface and hence increase in the thickness of the liquid film at the contact line between the three phases for approximately similar capillary numbers and viscosities. Bubble stability for all cases was evaluated by monitoring the change in average diameter with time. Microbubbles coated with PEG 40 were found to be the most stable, lasting for 150 days with a uniform size reduction of ∼1.5% as compared with SDS microbubbles lasting only for 30 min after collection.

1. Introduction

Microbubbles with potential applications in areas such as the biomedical,1,2 food,3 cosmetics4 and chemical5 industries continue to be a subject of interest for many researchers. Control over the size and size distribution of microbubbles is critical for all of these applications.6 Microfluidic techniques are highly promising for production of monodisperse microbubbles due to their ability to provide precise control in space and time over the transport of fluids as well as their ease of fabrication.7

Micro-foams have the potential to create new materials such as scaffolds for tissue engineering,8 microporous media,9 photonic and phononic crystals.10 In addition, micro-foams have numerous other applications from protein and bacteria separation,11 oil recovery12 to contaminated water treatment.13 In these applications micro-foams are utilised due to their large interfacial area, the adsorption of particles at the microbubble interface, and their stability for enhanced mass transfer. Microfluidic devices assist in generating such materials, enabling the required degree of control over their physical properties.

In order to facilitate bubble formation and to stabilize the formed microbubbles, surfactants are added to the liquid phase.14,15 Surfactants reduce the gas–liquid interfacial tension16 and influence the hydrophilic or hydrophobic character of the microchannel surface.17 The interfacial rheological properties of the liquid phase depend upon the orientation, concentration and interactions of the adsorbed surfactant molecules and will both affect bubble formation and play an important role in determining bubble stability.18 Varying the surfactant type can thus have a large impact on drop/microbubble behaviour as different surfactant molecules have different characteristics. Both interfacial tension and diffusivity are strongly dependent on the local surface concentration of surfactant molecules and hence both the concentration in the liquid and adsorption characteristics.19 The choice of surfactant is thus crucial to achieve the desired microbubble characteristics.

The size and size distribution of microbubbles generated in microfluidic devices are affected by various operating and process parameters.20 Several studies have investigated the effects of surfactant type and concentration on microbubble and droplet formation.16,21 Xu et al.18 investigated the effect of an anionic surfactant, sodium dodecyl sulphate (SDS) and addition of an electrolyte, sodium chloride (NaCl) on bubble diameter and stability. Their results indicated that by increasing the concentration of the surfactant and by addition of NaCl the production rate and stability of smaller microbubbles were improved. This was attributed to the significant decrease in the zeta potential and corresponding reduction in the surface charge of the SDS micelles enabling enhanced adsorption. Kukizaki and Baba16 studied the effect of differently charged surfactants on microbubble formation using Shirasu porous glass membranes and generated monodisperse microbubbles with systems containing anionic and nonionic surfactants SDS and Tween 20, respectively. However, they demonstrated that the solution containing the cationic surfactant CTAB resulted in the formation of polydisperse bubbles due to the adsorption of CTAB molecules onto the negatively charged membrane surface. Tong et al.21 produced monodisperse oil-in-water microspheres using a microchannel emulsification technique and studied the effect of different surfactants on microsphere production. Their results indicated that for the case of nonionic and anionic surfactants the hydrophilic group was repelled from the negatively charged microchannel surface thereby maintaining its hydrophilicity. The positively charged group of the cationic surfactant, however, caused it to be adsorbed on to the microchannel surface which deteriorated the emulsification process.

The composition and physicochemical properties of the surfactant used can greatly affect the formation and stabilization of microbubbles. One of the most important factors to consider with respect to surfactant containing solutions is the critical micelle concentration (CMC),18 at which the surfactant aggregates and form micelles, as the properties of the solution dramatically change at this concentration. Previous studies have indicated that in order to achieve the maximum effect of the surfactant, concentrations higher than the CMC are required.22 Therefore, in this study experimental investigation of the influence of three different types of commonly used surfactants (cationic, anionic and nonionic surfactants) at concentrations much higher than CMC was made. The effect of the chain lengths and molecular structure of the surfactants on the properties of the liquid phase, mainly the contact angle and capillary number were studied; and a detailed analysis of the effect of concentration and type of surfactant on bubble formation and size in a capillary embedded T-Junction device was carried out. In addition, the stability of microbubbles produced with each surfactant type and concentration was examined.

2. Theoretical description

2.1. Surfactant effect on bubble formation

Surfactants can alter the interfacial stresses produced during bubble/droplet formation in a complicated manner under dynamic conditions. The surfactant mass transfer dynamics and the amount of surfactant adsorption are the key factors determining whether bubble/droplet formation is facilitated or inhibited. Surfactants can also cause droplets/bubbles that would otherwise be stable to break up under flow.19,23 Gravitational and inertial effects are generally insignificant in comparison to interfacial and viscous forces in microfluidic devices. As well as the capillary number that describes the ratio of viscous to interfacial forces, fluid wetting plays a central role in determining the flow regime. The wetting of solid surfaces in the presence of surfactants depends on the characteristics of the solid and liquid phases, the surfactant and its concentration.24 The contact angle characterises the movement of the three phase contact line and hence the force balance at the bubble breakup region and ultimately the size of the bubbles.25

When surfactant molecules are adsorbed at an interface (either gas–liquid or liquid–solid), the dynamic surface tension of the liquid as well as the interfacial tension between the liquid and solid is reduced by an amount that depends upon the level of adsorption.17,26 On a bubble, surfactant molecules are adsorbed with their polar heads facing out into the aqueous solution and their tails inwards towards the gas core.27 At the liquid–solid interface, either the hydrophilic or hydrophobic group may be oriented toward the surface, depending upon the nature of the surface.28 Since the surface of a microchannel will, in most cases, be non-polar, molecules will be adsorbed with their hydrophobic group toward the surface, and therefore make it more hydrophilic.

2.2. Surfactant effect on microbubble stability

Due to the action of interfacial tension, microbubbles are naturally unstable. The effect of capillary pressure acting on a spherical microbubble surface can be expressed by the Laplace equation:
 
PLaplace = 2σ/R (1)
where R is the instantaneous radius of the microbubble and σ is the interfacial tension. The diameter of a microbubble in an unsaturated liquid will decrease exponentially as the gas diffuses into the surrounding liquid under constant ambient conditions. The rate of dissolution of the gas depends on the magnitude of the interfacial tension, the concentration and diffusivity of the gas in the liquid, the ambient temperature and pressure, and the size of the microbubble.29,30 Epstein and Plesset29 presented an equation for the rate of change of bubble radius image file: c4ra15167d-t1.tif under constant interfacial tension (σ), while they considered the effect of convection negligible:
 
image file: c4ra15167d-t2.tif(2)
where Ci and Csat are the initial and saturation concentrations of the dissolved gas in the liquid, respectively, M is the molecular weight of the gas, B is the universal gas constant, T is the gas temperature, t is time and ρ(∞) is the density of the gas at a zero curvature interface with a constant coefficient of dissolution, D. Eqn (2) is for an uncoated bubble, hence the effect of a surfactant coating is not considered. These can be included either by writing diffusivity and surface tension as functions of surfactant concentration at the gas–liquid interface, as previously described by Azmin et al.31 or by introducing a “shell” term similar to the model proposed by Borden and Longo.32 By introducing a surfactant layer on the microbubble surface, the dissolution of the bubble is affected due to the decrease in interfacial tension as well as the restriction to the mass transfer of the gas in and out of the bubble surface by the surfactant film. The concentration of the surfactant on the bubble surface is thus important to consider with respect to both phenomena.33

3. Materials and methods

3.1. Materials

Glycerol with 99% purity (Sigma Aldrich, UK) was diluted with distilled water to achieve 50 wt% concentration to form the main component of the liquid phase. In order to facilitate bubble formation and reduce the surface tension of the newly created interfaces, four different surfactants were added to the aqueous glycerol solution in varying concentrations. To investigate the effect of liquid surface tension and surfactant type on the size and stability of the bubbles produced, 2, 5 and 10 wt% of sodium dodecyl sulphate (SDS), cetyltrimethyl ammonium bromide (CTAB), polyoxyethylene (40) sorbitan monopalmitate (Tween 40) and polyoxyethylene glycol 40 stearate (PEG 40) were added to the aqueous solution with 50 wt% glycerol concentration (all purchased from Sigma Aldrich, UK). Compressed air was used as the dispersed (gas) phase. The physicochemical characteristic of the surfactants and properties of the different solutions are shown in Tables 1 and 2, respectively.
Table 1 Physico-chemical characteristics of the surfactants utilised in the experiments41
Surfactant Formula Molecular weight/g mol−1 CMC in water/wt%
image file: c4ra15167d-u1.tif Na C12H25SO4 288.4 0.17–0.23
image file: c4ra15167d-u2.tif C19H42BrN 364.5 0.03
image file: c4ra15167d-u3.tif C18H35O2(C2H4O)n H, n = 40 2047 0.01
image file: c4ra15167d-u4.tif C22H42O6(C2H4O)n, n = 20 1277 0.003


Table 2 Physical properties of the solutions used in the experiment at 22 °C (contact angle was measured on an FEP surface)
Aqueous solution Density/mg m−3 Viscosity/mPa s Surface tension/mN m−1 Contact angle/°
Water 0.99 1 72 105
50 wt% glycerol 1.14 5.5 56 100
2 wt% PEG 40, 50 wt% glycerol 1.12 5.6 46 58
5 wt% PEG 40, 50 wt% glycerol 1.12 7.8 44 49
10 wt% PEG 40, 50 wt% glycerol 1.13 12.3 44 43
2 wt% Tween 40, 50 wt% glycerol 1.12 5.1 41 60
5 wt% Tween 40, 50 wt% glycerol 1.12 6 39 54
10 wt% Tween 40, 50 wt% glycerol 1.13 10 39 50
2 wt% SDS, 50 wt% glycerol 1.12 5.6 40 61
5 wt% SDS, 50 wt% glycerol 1.12 7.5 40 59
10 wt% SDS, 50 wt% glycerol 1.08 12.4 37 51
2 wt% CTAB, 50 wt% glycerol 1.10 5.4 38 42
5 wt% CTAB, 50 wt% glycerol 1.04 5.5 37 46
10 wt% CTAB, 50 wt% glycerol 1.02 10 36 52


3.2. Characterization of solutions

Static surface tension and contact angle for each solution were measured with an error of ±2% using a Drop Shape Analysis System, Model DSA100 (Kruss GmbH, Hamburg, Germany) using the drop shape and circle fitting methods, respectively. The density of all the solutions used in the experiments were measured using a DIN ISO 3507-Gay-Lussac type standard density bottle. Viscosity was measured using a Brookfield DV-11 Ultra programmable rheometer (Brookfield Engineering Laboratory Inc., USA) as well as using a U-tube viscometer (BS/E type, VWR, UK). Calibration was carried out with pure water and ethanol. All the measurements, presented in Table 2, were performed at the ambient temperature (22 °C) after calibrating the equipment using distilled water.

3.3. Bubble characterization

Bubbles were collected from the outlet of the device on microscope slides and immediately observed under an optical microscope (Nikon Eclipse ME 600) fitted with a camera (JVC KY-F55B). Bubbles were studied at 5×, 10× and 20× magnifications. For each sample, 100 bubbles were chosen to measure the diameter and stability over a fixed collection area of 1.5 mm2. A Photron Ultima APX high speed camera with a maximum resolution of 1024 × 1024 (17 μ) pixels at up to 2000 fps giving 3 seconds of recording time (Photron Europe Ltd., U.K.) was also used to obtain real time video images of the bubble formation process.

3.4. Experimental setup

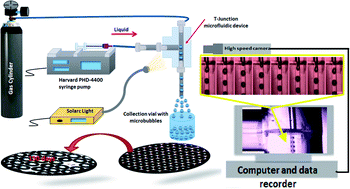
The experimental setup consisted of two Teflon FEP (fluorinated ethylene polypropylene) capillaries inserted perpendicularly into a rigid polydimethylsiloxane (PDMS) block (100 × 100 × 10 mm) as inlet channels for the gas and liquid flows. A third FEP capillary was embedded in the polymer block aligned with the gas inlet channel with a 200 μm distance to create the junction where the two phases meet. The internal diameter for all of the channels was fixed at 200 μm. A schematic of the T-Junction set up is shown in Fig. 1. The top capillary was connected to a gas regulator fitted to a pressurized air tank via 6 mm diameter tubing, where the gas was supplied to the junction at constant pressure Pg. A digital manometer was connected to the tubing to measure the in-line gas pressure. Also a gas regulator was used to vary the pressure supplied to the T-junction. The liquid capillary perpendicular to the capillary supplying air was connected to a 20 ml stainless steel syringe (KD Scientific, Holliston, MA, USA). A Harvard syringe pump PHD-4400 (Harvard Apparatus Ltd, Edenbridge, UK) was used to force liquid through the capillaries at a constant flow rate. The advantages that this setup has over the conventional lithographically manufactured microfluidic chips are: that it can be easily constructed, blocked capillaries can be easily replaced, and microbubbles smaller than the channel width can be produced. The conditions tested in the experiments are shown in Table 3. Each experiment was conducted 10 times to provide an indication of the experimental uncertainty for the measured mean bubble diameter that was calculated to be approximately between 2–5%.
image file: c4ra15167d-f1.tif
Fig. 1 Schematic of the T-Junction microfluidic device setup.
Table 3 Conditions tested in the experiments (at 22 °C)
Experimental conditions Liquid flow rate/ml min−1 Channel diameter/μm Gap between capillaries/μm Gas pressure/kPa Capillary number
2 wt% PEG 40 0.2 200 200 45–95 0.0013
5 wt% PEG 40 0.2 200 200 80–150 0.0019
10 wt% PEG 40 0.2 200 200 140–200 0.0029
2 wt% Tween 40 0.2 200 200 30–120 0.0013
5 wt% Tween 40 0.2 200 200 45–155 0.0016
10 wt% Tween 40 0.2 200 200 70–135 0.0027
10 wt% Tween 40 0.25 200 200 80–140 0.0034
2 wt% SDS 0.2 200 200 35–100 0.0014
5 wt% SDS 0.2 200 200 65–120 0.0019
10 wt% SDS 0.2 200 200 110–190 0.0034
2 wt% CTAB 0.2 200 200 50–100 0.0015
5 wt% CTAB 0.2 200 200 75–125 0.0016
10 wt% CTAB 0.2 200 200 115–195 0.0029


4. Results and discussion

4.1. Effect of surfactant concentration on the properties of the liquid phase

Three types of differently charged surfactants with three different concentrations of 2, 5 and 10 wt% were chosen for this study. PEG 40 and Tween 40 were chosen as nonionic surfactants. The molecular structure of these two surfactants contain polyoxyethylene units that decrease the hydrophobic character of the surfactant, and as a result they appear to adsorb more efficiently onto hydrophobic surfaces than onto hydrophilic ones.28 SDS was selected as the anionic surfactant and CTAB for the cationic category. All surfactants have both hydrophilic and hydrophobic groups. Both nonionic surfactants Tween 40 and PEG 40 have relatively large hydrophilic groups, while CTAB has a long hydrophobic chain.21 All the surfactants selected for this study are water soluble, but for higher concentrations of CTAB and SDS the preparation of the solutions required heating the solutions at 70 °C for approximately 120 s prior to the experiments. From the data in Table 2, it is clear that the concentration and type of the surfactant have an impact on the surface tension and contact angle of the aqueous glycerol solution. The surfactants each lower the surface tension of the aqueous phase to different levels. The interfacial tension of the solutions containing nonionic surfactants Tween 40 and PEG 40 decreased dramatically to 41.6 and 46.3 mN m−1, respectively, at 2 wt% concentration. However, increasing the concentration of these surfactants further to 5 and 10 wt% had a little effect on the surface tension but increased the viscosity of the solutions. This suggests that the concentrations used in this study were higher than the critical micelle concentration (CMC). This trend was also seen with SDS and CTAB, although the surface tension of the solution decreased more with the addition of the latter. As demonstrated in Table 2, the interfacial tension for 2 wt% PEG 40 has the largest value, while the solution with 10 wt% CTAB concentration has the lowest interfacial tension.

In order to find whether the channel walls were hydrophobic or hydrophilic, the static contact angle (θ) of deionized water was measured against the FEP surface and it was shown that θ > 90° indicating that the surface was hydrophobic. As shown in Table 2, the static contact angle for each solution was also measured. For the case of nonionic surfactants, with increasing concentration the contact angle decreased. Increasing the concentration of cationic surfactant CTAB and anionic SDS, however, led to an increase in the contact angle. In polyoxyethylene nonionic surfactants, increasing the number of oxyethylene groups (C2H4O)n reduces the efficiency of adsorption of the surfactant on the surface of most materials, because the effective cross sectional area of the molecule at the interface increases.28 Since the number of oxyethylene groups in Tween 40 is smaller than in PEG 40 (Table 1), the hydrophobic character of the surfactant is decreased, leading to higher adsorption of surfactant molecules on the channel hydrophobic surface and therefore at all concentrations of surfactants the contact angle is lower compared with PEG 40. At a constant 2 wt% concentration, solutions with both nonionic surfactants (Tween 40 and PEG 40) and SDS have similar contact angles which were all higher than for CTAB. The lower contact angle with CTAB results in the reduction of the liquid film thickness at the three phase contact line and therefore formation of bubbles with larger diameter is anticipated for these surfactants. While at 10 wt% concentration, the solution containing PEG 40 has the lowest contact angle, while the other three surfactants produce similar contact angles. At higher concentrations, well above the CMC (5 and 10 wt%), the surface tension of the solution did not significantly change, the viscosity of all solutions on the other hand increased due to the surfactant molecules aggregating and forming micelles in the bulk. Therefore formation of smaller bubbles was expected at concentrations of 5 and 10 wt%.

4.2. Effect of surfactant concentration on bubble size

In order to investigate the effect of surfactant concentration on microbubble size, three concentrations of the solutions with nonionic surfactants PEG 40 and Tween 40 were chosen. The liquid flow rate was kept constant at 200 μl min−1 for all experiments to study the effect of capillary number in conjunction with gas pressure on the given concentration of surfactant in the solution, except for the experiment with 10 wt% Tween 40 where this parameter was increased to 250 μl min−1. As indicated in Fig. 2, bubble formation occurred within a larger range of gas pressures for the highest concentrations for both PEG 40 and Tween 40. In order to produce the same size bubble with diameter of 200 μm (Fig. 2a), larger gas pressure was required for the solution with the highest concentration of PEG 40 (10 wt%). The calculated capillary numbers (μv/σ) shown in Table 3, suggest that with increasing capillary number, a higher gas pressure is required to produce bubbles. For a fixed gas pressure of 100 kPa (Fig. 2b), at which bubble formation occurred for all Tween 40 concentrations, the solution with the lowest concentration generated the largest bubble size. This indicates, as anticipated, that the decrease in the bubble size with increasing capillary number is mainly related to the increase in viscosity of the solution rather than the small variation in the surface tension as a result of the increase in surfactant concentration.
image file: c4ra15167d-f2.tif
Fig. 2 The effect of surfactant concentration on bubble size and gas pressure required for bubble formation for (a) PEG 40 and (b) Tween 40. All of the microbubbles produced with this setup were highly monodisperse with polydispersity index <2%.

4.3. Influence of surfactant type on the bubble formation time

In this part of the study, the time taken from the gas column entering the exit channel and the reduction of the neck until the breakup of the formed bubble as well as the effect of the surfactant type on the formation time were studied. The dynamic contact angle determines the movement of the three phase contact line at the bubble breakup point and therefore influences the shape of the gas–liquid interface as well as the amount of gas entering the mixing channel. Measuring the dynamic contact angle in the microfluidic channel is challenging, but the measured values for the static contact angle can give an indication of the effect that each surfactant has on the wettability of the channel wall surface. In order to study the effect of surfactant type on the formation of microbubbles in the capillary embedded T-Junction device, gas column breakup and bubble formation were observed using a Photron Ultima APX camera recording at 2000 frames per second (fps) over 3 s. The behaviour of the two phase flow was recorded for the solutions containing 2 wt% of the surfactants, with the liquid flow rate kept constant at 200 μl min−1.

The gas pressure of ∼60 kPa chosen for this study was within the range enabling bubble production for all solutions, and therefore the only parameters changed by varying the surfactant type were the capillary number and the contact angle. Once the bubbles were produced, their diameters were measured with an optical microscope. Fig. 3 shows the high speed camera frames illustrating the time evolution of bubble breakup for each surfactant. From the images obtained, it is clear that whilst the operating conditions of the T-Junction setup were kept constant throughout the experiments, the solution containing CTAB produced the largest bubble size (290 μm diameter) and the solution with PEG 40 formed the smallest (170 μm diameter). The images show that bubbles produced with PEG 40 maintained a spherical shape and the time taken for the neck to decrease and finally pinch off was longer (8.5 ms) compared to the other surfactants. The bubble size increased with the other nonionic surfactant Tween 40. It is interesting to notice that for both cases of anionic and cationic surfactants, SDS and CTAB respectively, the bubble size increased and adopted a plug like shape while the pinch off time was reduced. Bubbles were produced at a higher rate of 1 bubble per 2.5 ms for solutions containing CTAB, indicating that for the chosen set of operating parameters (liquid flow rate of 200 μl min−1 and gas pressure of 60 kPa), the number of monodisperse bubbles produced was 1.2 × 10⁵ in every 1 ml of the collected sample. Since the microchannel walls are made from FEP, their surfaces are hydrophobic. The interaction between the solution containing surfactant molecules and the microchannel walls is the key factor that can affect the hydrophilicity of the surface.16 Both nonionic surfactants PEG 40 and Tween 40 have a relatively large hydrophilic group compared to the large hydrophobic groups in SDS and CTAB. Due to the larger hydrophilic group of the nonionic surfactants, the adsorption of the surfactant molecules at the contact line between the three phases increase and therefore the thickness of the liquid film at this point increases, which consequently increases the time required for bubble formation.


image file: c4ra15167d-f3.tif
Fig. 3 High speed camera images of the bubble formation time for 2 wt% concentration of (a) CTAB, (b) SDS, (c) Tween 40 and (d) PEG 40. Scale bar represents 200 μm.

The measured surface tension of 38 mN m−1 for the solution containing CTAB was lower than that of the SDS, PEG 40 and Tween 40 solutions, as listed in Table 2. On the other hand, the positively charged CTAB molecules will have been attracted to the negatively charged microchannel surface and therefore decreased the hydrophilicity of the channel walls. These phenomena will have altered both the dynamic contact angle and wettability of the channel surface and hence influenced the bubble formation process. The dynamic contact angle would have changed the position of the three phase contact line at the bubble breakup point and therefore the shape of the gas–liquid interface as well as the amount of gas entering the mixing channel. Measuring the dynamic contact angle in the microfluidic channel was not feasible in this study, but the measured values for the static contact angle give an indication of the effect that each surfactant has on the wettability of the channel wall surface. A further point to note is that interfacial gradients in surfactant concentration can further influence the flow profile and hence bubble formation and these will also be different for different surfactants.34

4.4. Effect of surfactant type on bubble size

For this study, all surfactants were investigated with concentrations of 2 and 5 wt%. Bubble size was measured for each surfactant and concentration and plots of bubble diameter for the range of gas pressures that bubble formation was possible are presented in Fig. 4. For a given gas pressure at both concentrations, the bubbles produced with the Tween 40 solution were generally the smallest, followed by the solution containing PEG 40. It was shown that for a given gas pressure and surfactant concentration smaller microbubbles were produced at higher capillary numbers for the nonionic surfactants followed by the anionic surfactant SDS, while the cationic surfactant CTAB produced the largest bubbles due to lower capillary numbers. At 2 wt% concentration of Tween 40 and PEG 40, the static contact angles with respect to the channel wall surface were approximately similar (58° and 60°), however bubble size as shown in Fig. 4a was smaller for PEG 40 due to the effect of the lower capillary number of 2 wt% PEG 40 solution. On the other hand, the values of the contact angle for 5 wt% concentration of Tween 40 and PEG 40 are different but smaller bubbles were produced when the capillary number was smaller for Tween 40, as shown in Fig. 4b. In addition, at 5 wt% concentration of PEG 40 and SDS where the capillary numbers were approximately the same, and the viscosity is also the same for both surfactants, PEG 40 produced smaller bubbles. The measured contact angle for PEG 40 (49°) was smaller than for SDS (59°). This indicates that the factor most strongly affecting the bubble formation and size was the wettability of the channel by the surfactant molecules.
image file: c4ra15167d-f4.tif
Fig. 4 The effect of surfactant type on microbubble size for (a) 2 wt% concentration and (b) 5 wt% concentration All bubbles were monodisperse with polydispersity index <2%.

4.5. Stability of microbubbles

The stability of bubbles/foams is governed by the balance between the roles of surface tension, surface activity and adsorption kinetics.35 The shorter the length of the hydrophobic chain of the surfactant molecule, the higher the adsorption rate. Also dynamic interfacial behaviour is an important factor to consider if the transport rate of the surfactant molecules between the bulk liquid and the interface by means of convective flow and diffusion is slower than surface expansion and breakup of bubbles. The diffusion and adsorption timescales for the surfactants used in this study have been shown to be relatively long compared with the bubble formation time, in a static liquid.36 Previous studies37 however have indicated that the flow field within the device is critical to determining the rate of adsorption of surfactant on to the bubbles, particularly where the surfactant concentration is significantly above the CMC as here. The shearing of the liquid in the junction and the presence of micelles will strongly affect the local concentration and behaviour of surfactant molecules at the bubble surface as it expands. Thus measurements of dynamic surface tension e.g. using the maximum bubble pressure method are not directly applicable to the microchannel system considered here. In addition, the microbubbles once formed remain suspended in the liquid phase as they travel to the exit of the device and so the period of time over which surfactant adsorption can occur is significantly longer than the time required for bubble formation.

The more closely packed the surface monolayer at the interface, the more the diffusion of the encapsulated gas into the surrounding is limited and therefore bubbles become more stable.38,39 Microbubble size distribution was measured as a function of time via optical microscopy. 100 randomly selected microbubbles from each sample collected on the glass slides (2 samples for each surfactant) were studied and measured every 5 min for 2 h and additionally every hour to 5 h and consequently 24, 48 and 72 h and 7 to 150 days. For the purpose of comparison, 5 wt% concentration of all surfactants was selected. As shown in Fig. 5, microbubbles produced with SDS were the least stable, and over the course of 30 minutes at the ambient temperature and pressure, the size distribution of the bubbles broadened greatly bubble coalescence observed finally bursting occurred. Microbubbles produced with both nonionic surfactants PEG 40 and Tween 40 were the most stable for all concentrations studied in this. Although, SDS and CTAB solutions had a lower surface tension than the other surfactants, but they both produced the least stable bubbles in this study, with bubbles produced lasting for only 30 and 90 min, for SDS and CTAB, respectively. This could be attributed to electrostatic repulsion between the ions of both cationic and anionic surfactant head groups on the surface of adjacent bubbles or lower surface concentrations and hence higher diffusivity. The most stable bubbles were produced with the solution containing PEG 40, surviving 150 days. This is likely to have been due to steric stabilization by the nonionic surfactant40 at the adjacent bubbles.


image file: c4ra15167d-f5.tif
Fig. 5 Micrographs showing the stability of 5 wt% concentration of (a) PEG 40, (b) Tween 40, (c) SDS and (d) CTAB.

The variation of the mean diameter and standard deviation of bubbles with time for sample of 100 bubbles collected were also studied. As shown in Fig. 6, the mean diameter of bubbles produced with Tween 40 decreased linearly at the same rate for a period of 72 hours from the collection time until they all disappeared. However, for the case of PEG 40, after a certain period of time (7 days) the rate of bubble shrinkage became negligible. The diameter of all bubbles decreased at the same rate, thereby maintaining near monodispersity which would have inhibited Ostwald ripening. It should be noted that during the measurements it was observed that the area where the measurement was taken was found crucial. As shown in Fig. 7, if the sample taken was from the centre of the collection sample, where the bubbles were closely packed, stability was greater. In comparison, the microbubbles in close proximity of the edge were affected by the constant flux of gas from the bubbles to the liquid and to the surrounding air. This was not unexpected since the diffusion of bubbles is influenced by the amount of surfactant molecules adsorbed on the bubble surface as well as the amount of solution around the microbubbles and the corresponding concentrations of gas and surfactant.


image file: c4ra15167d-f6.tif
Fig. 6 Bubble dimensionless diameter stability profile for (a) PEG 40 (b) Tween 40.

image file: c4ra15167d-f7.tif
Fig. 7 Micrographs of microbubbles with 2 wt% Tween 40 surfactant from (a) centre of the collection sample (b) edge of the collected sample at (i) time of collection (ii) 2.5 hours and (iii) 5 hours after collection.

5. Conclusions

In this paper, an experimental study of the effect of the type and concentration of four different surfactants on the formation and stability of microbubbles was conducted. For all surfactant types, significant changes in the bubble formation, size and stability were observed by increasing the concentration of the surfactant. This can be explained by the effect that surfactants have on the dynamics of bubble formation by influencing the wettability of the channel surface, the dynamic adsorption of surfactant molecules on the liquid–solid and liquid–gas interfaces in the microchannels and the physical properties of the liquid phase. Both capillary number and the wetting characteristics of the channel wall surface were found to be key factors in determining the size of microbubbles. The size of bubbles produced by a T-Junction device is known to be dependent on capillary number but it is shown in this study that for the solutions containing different surfactants but same physical properties, at approximately similar capillary numbers, the wetting characteristic of the solution is the key factor in determining the bubble size. It was noted that microbubbles produced with solutions containing the nonionic surfactants (PEG 40 and Tween 40) were generally smaller, with 10 wt% Tween 40 producing the smallest bubble size of ∼50 μm for fixed operating parameters. This is due to the fact that these two surfactants have a larger hydrophilic group and therefore the wettability of the channel wall surface is affected in a different manner. The type of the charge of the surfactant head group may also have influenced the formation of bubbles, however in order to conduct a fair test, further experiments would be needed with surfactants having similar chain lengths but different charges.

Analysis of microbubble stability was also performed and it was found that the solution containing 5 and 10 wt% PEG produced microbubbles that were highly stable, lasting for 150 days (the length of the study) with only a 1.5% change in diameter. On the other hand, the microbubbles produced with SDS were the least stable. Increasing the surfactant concentration did not significantly change the microbubble stability. All the microbubbles produced in this study were highly monodisperse with a polydispersity index <2%.

Acknowledgements

The authors wish to thank the Engineering and Physical Science Research Council, UK for providing the Photron Ultima APX high speed camera for this work. The generous help of Adrian Walker of the Instrument Loan Pool is gratefully acknowledged. The authors would also like to thank Mr Kuanyu Zhang (Biomaterials and Tissue Engineering MSc student in Mechanical Engineering Department at UCL 2012–2013) for his assistance in conducting the experiments.

References

  1. S.-T. Kang and C.-K. Yeh, Chang Gung Med. J., 2012, 35, 125–139 Search PubMed.
  2. E. C. Unger, E. Hersh, M. Vannan, T. O. Matsunaga and M. McCreery, Prog. Cardiovasc. Dis., 2001, 44, 45–54 CrossRef CAS PubMed.
  3. G. M. Campbell and E. Mougeot, Trends Food Sci. Technol., 1999, 10, 283–296 CrossRef CAS.
  4. E. G. Lima, K. M. Durney, S. R. Sirsi, A. B. Nover, G. A. Ateshian, M. A. Borden and C. T. Hung, Acta Biomater., 2012, 8, 4334–4341 CrossRef CAS PubMed.
  5. S. E. Burns, S. Yiacoumi and C. Tsouris, Sep. Purif. Technol., 1997, 11, 221–232 CrossRef CAS.
  6. E. Stride and M. Edirisinghe, Soft Matter, 2008, 4, 2350–2359 RSC.
  7. M. De Menech, P. Garstecki, F. Jousse and H. A. Stone, J. Fluid Mech., 2008, 595, 141–161 Search PubMed.
  8. J. Zhang, A. Alsayed, K. Lin, S. Sanyal, F. Zhang, W.-J. Pao, V. Balagurusamy, P. Heiney and A. Yodh, Appl. Phys. Lett., 2002, 81, 3176–3178 CrossRef CAS PubMed.
  9. K. Ferrara, R. Pollard and M. Borden, Annu. Rev. Biomed. Eng., 2007, 9, 415–447 CrossRef CAS PubMed.
  10. M. Hashimoto, B. Mayers, P. Garstecki and G. M. Whitesides, Small, 2006, 2, 1292–1298 CrossRef CAS PubMed.
  11. P. Jauregi and J. Varley, Biotechnol. Bioeng., 1998, 59, 471–481 CrossRef CAS.
  12. C. A. Conn, K. Ma, G. J. Hirasaki and S. L. Biswal, Lab Chip, 2014, 14, 3968–3977 RSC.
  13. S. Ciriello, S. Barnett and F. Deluise, Sep. Sci. Technol., 1982, 17, 521–534 CrossRef CAS.
  14. J. H. Xu, S. W. Li, G. G. Chen and G. S. Luo, AIChE J., 2006, 52, 2254–2259 CrossRef CAS.
  15. S. Takagi and Y. Matsumoto, Annu. Rev. Fluid Mech., 2011, 43, 615–636 CrossRef.
  16. M. Kukizaki and Y. Baba, Colloids Surf., A, 2008, 326, 129–137 CrossRef CAS PubMed.
  17. C. P. Tostado, J. Xu and G. Luo, Chem. Eng. J., 2011, 171, 1340–1347 CrossRef CAS PubMed.
  18. Q. Xu, M. Nakajima, S. Ichikawa, N. Nakamura, P. Roy, H. Okadome and T. Shiina, J. Colloid Interface Sci., 2009, 332, 208–214 CrossRef CAS PubMed.
  19. C. N. Baroud, F. Gallaire and R. Dangla, Lab Chip, 2010, 10, 2032–2045 RSC.
  20. M. Parhizkar, M. Edirisinghe and E. Stride, Microfluid. Nanofluid., 2013, 14, 797–808 CrossRef CAS.
  21. J. H. Tong, M. Nakajima, H. Nabetani and Y. Kikuchi, J. Surfactants Deterg., 2000, 3, 285–293 CrossRef CAS PubMed.
  22. M. S. Kalekar and S. S. Bhagwat, J. Dispersion Sci. Technol., 2006, 27, 1027–1034 CrossRef CAS.
  23. C. D. Eggleton, T. M. Tsai and K. J. Stebe, Phys. Rev. Lett., 2001, 87, 048302 CrossRef CAS.
  24. L. J. Yang, T. J. Yao and Y. C. Tai, J. Micromech. Microeng., 2004, 14, 220–225 CrossRef.
  25. N. Shao, W. Salman, A. Gavriilidis and P. Angeli, Int. J. Heat Fluid Flow, 2008, 29, 1603–1611 CrossRef CAS PubMed.
  26. R. G. Chaudhuri and S. Paria, J. Colloid Interface Sci., 2009, 337, 555–562 CrossRef CAS PubMed.
  27. J. H. Xu, S. W. Li, J. Tan, Y. J. Wang and G. S. Luo, AIChE J., 2006, 52, 3005–3010 CrossRef CAS.
  28. M. J. Rosen and J. T. Kunjappu, Surfactants and Interfacial Phenomena, John Wiley & Sons, 2012 Search PubMed.
  29. P. S. Epstein and M. S. Plesset, J. Chem. Phys., 1950, 18, 1505–1509 CrossRef CAS PubMed.
  30. D. W. Readey and A. R. Copper Jr, Chem. Eng. Sci., 1966, 21, 917–922 CrossRef CAS.
  31. M. Azmin, G. Mohamedi, M. Edirisinghe and E. Stride, Mater. Sci. Eng., C, 2012, 32, 2654–2658 CrossRef CAS PubMed.
  32. M. A. Borden and M. L. Longo, Langmuir, 2002, 18, 9225–9233 CrossRef CAS.
  33. G. Mohamedi, M. Azmin, I. Pastoriza-Santos, V. Huang, J. Perez-Juste, L. M. Liz-Marzan, M. Edirisinghe and E. Stride, Langmuir, 2012, 28, 13808–13815 CrossRef CAS PubMed.
  34. J. Tong, M. Nakajima, H. Nabetani and Y. Kikuchi, J. Surfactants Deterg., 2000, 3, 285–293 CrossRef CAS PubMed.
  35. D. Beneventi, B. Carre and A. Gandini, Colloids Surf., A, 2001, 189, 65–73 CrossRef CAS.
  36. C.-H. Chang and E. I. Franses, Colloids Surf., A, 1995, 100, 1–45 CrossRef CAS.
  37. K. Wang, Y. Lu, J. Xu and G. Luo, Langmuir, 2009, 25, 2153–2158 CrossRef CAS PubMed.
  38. K. R. Atta, D. Gavril, V. Loukopoulos and G. Karaiskakis, J. Chromatogr. A, 2004, 1023, 287–296 CrossRef CAS PubMed.
  39. E. Stride, Philos. Trans. R. Soc., A, 2008, 366, 2103–2115 CrossRef CAS PubMed.
  40. D. H. Napper, J. Colloid Interface Sci., 1977, 58, 390–407 CrossRef CAS.
  41. A. S. Prakash, J. Excipients Food Chem., 2010, 1, 51–59 Search PubMed.

This journal is © The Royal Society of Chemistry 2015
Click here to see how this site uses Cookies. View our privacy policy here.