Designing of YVO4 supported β-AgI nano-photocatalyst with improved stability

K. Vignesh*a, A. Suganthib, Bong-Ki Minc, M. Rajarajand and Misook Kang*a
aDepartment of Chemistry, College of Science, Yeungnam University, Gyeongsan, Gyeongbuk 712-749, Republic of Korea. E-mail: mskang@ynu.ac.kr; vignesh134@gmail.com; Fax: +82 53 815 5412; Tel: +82 53 810 2363
bDepartment of Chemistry, Thiagarajar College, Madurai 625 009, Tamilnadu, India
cCenter for Research Facilities, Yeungnam University, Gyeongsan, Gyeongbuk 712 749, Republic of Korea
dDepartment of Chemistry, C.P.A. College, Bodinayakanur 625 513, Tamilnadu, India

Received 11th November 2014 , Accepted 25th November 2014

First published on 25th November 2014


Abstract

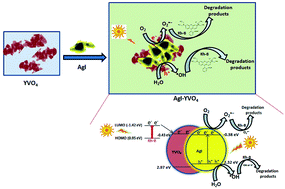
Yttrium ortho vanadate supported β-silver iodide nanoparticles (AgI–YVO4) were designed by a sono-chemical deposition method. The structural, morphological and optical properties of the as-prepared nanoparticles were investigated in detail. Transmission electron microscopy (TEM) results revealed that AgI nano-sheets were attached to YVO4 nano-grains. UV-vis-DRS results indicated that the visible light absorption ability of YVO4 was promoted by AgI modification. The photocatalytic activity was evaluated for the degradation of rhodamine-B (Rh-B) dye under simulated solar light irradiation. The photocatalytic activity of YVO4 was strongly influenced by the concentration of AgI. The photocatalyst of 10% AgI–YVO4 exhibited the best performance (98%) for the degradation of Rh-B. Moreover, the photocatalytic activity was well maintained even after four cycles. The results of this research work would be very useful for the degradation of harmful organic dyes in aqueous environments.


1. Introduction

Semiconductor photocatalysis is one of the most promising methods to degrade organic dyes in aqueous environments because of its high functionality and non-secondary pollution.1,2 Numerous semiconductor materials (TiO2,3 ZnO,4 SnO2,5 etc.) have been studied for the photodegradation of organic pollutants in water. However, most of them can only absorb ultraviolet light, which hinders their practical application under sun light. The recent research is focused on the designing of new and alternative visible light driven nanomaterials to traditional TiO2 photocatalysts.

Metal vanadates such as InVO4,6,7 BiVO4,8,9 Ag3VO4,10 YVO4 (ref. 11) and MnVO4 (ref. 12) have been studied for the photo-degradation of organic pollutants. Yttrium ortho vanadate (YVO4) is a wide band gap semiconductor and gained good response in the recent years for its photocatalytic property.13,14 However, the practical use of YVO4 with sun light should be improved by suitable surface modification techniques. Cai et al.15 studied the photodegradation of Rh-B over YVO4/g-C3N4 composites under visible light irradiation. Mohamed et al.16 examined the photocatalytic activity of silver doped YVO4 nanoparticles under visible light.

Nanomaterials with silver iodide (AgI) have also been used in photocatalysis because of its strong oxidizing capacity to degrade the organic pollutants. Yu et al.17 studied the photocatalytic activity and photoinduced self-stability of pure AgI nanoparticles. They found that pure AgI showed excellent photocatalytic activity for the degradation of methyl orange in the first cycle. After that, the activity of AgI was completely destroyed due to the formation of metallic silver. However, AgI supported photocatalysts were retained their photocatalytic activity after several photoreactions. Hence, it is clearly observed that the immobilization of AgI on a suitable support is required to maintain its photo-stability. In recent years, the photocatalytic activity of AgI supported on various semiconductors (TiO2,18 ZnO,19 SnO2,20 Bi2WO6,21 and Ag3PO4 (ref. 22)) have been reported. These hetero-structures showed remarkable photocatalytic activity with high stability. Dong et al.23 evaluated the visible light assisted photocatalytic activity of AgCl–SmVO4 and AgI–SmVO4 composites. AgI–SmVO4 showed the highest photocatalytic activity than that of AgCl–SmVO4.

The photocatalytic activity of YVO4 supported β-AgI nanoparticles (AgI–YVO4) has not been examined so far. Herein, we report the synthesis, characterization and photocatalytic performance of AgI–YVO4. The photocatalytic activity was measured for the degradation of rhodamine-B (Rh-B) under simulated solar light irradiation. The effect of AgI concentration on the photocatalytic activity of YVO4 was examined in detail. Besides, a possible photo-degradation mechanism was also discussed.

2. Experimental

All the chemicals used were of analytical grade and used as received without further purification.

2.1. Synthesis of YVO4

YVO4 was prepared by the precipitation method as follows: 1 M of ammonium vanadate was prepared in hot double distilled water. After cooling, 1 M of yttrium nitrate in double distilled water was added drop wisely to the vanadate solution. This mixture was stirred at room temperature for 30 min. Then, pH of the mixture was adjusted to basic using ammonium hydroxide and the stirring was continued for 5 h. The formed precipitates were centrifuged, washed with double distilled water, ethanol, dried at 100 °C for 24 h and calcined at 500 °C for 4 h.

2.2. Synthesis of AgI–YVO4

AgI–YVO4 was prepared through a sono-chemical deposition method as follows: YVO4 was taken in double distilled water and sonicated for 1 h. After that, required amount of silver nitrate and potassium iodide were added. The sonication process was continued for 15 min and then the mixture was stirred at room temperature for 24 h. The formed precipitates were centrifuged, washed with double distilled water, ethanol, dried at 100 °C for 24 h. According to this method three different molar ratios of AgI–YVO4 were prepared. The samples were denoted as 2% AgI–YVO4, 5% AgI–YVO4 and 10% AgI–YVO4, respectively. AgI was also prepared by the same procedure without addition of YVO4.

2.3. Characterization

The XRD patterns were recorded using an X-ray diffractometer (MPD, PANalytical) with nickel filtered Cu-Kα radiation. The morphology was observed with the help of a transmission electron microscopy (TEM, TEM; H-7600, Hitachi). The elemental mapping analysis was performed using a high resolution TEM (HR-TEM, Tecnai G2 F20/FEI, U.S.A) operated at 200 kV. The BET surface area was measured by a Micrometrics ASAP 2000 instrument. The optical properties were studied in a UV-visible diffuse reflectance spectroscopy (UV-vis-DRS, SCINCO-NEOSYS-2000) and photoluminescence (PL) spectroscopy (room temperature using a He–Cd laser source at a wavelength of 325 nm). X-ray photoelectron spectroscopy (XPS) measurements were taken in AXIS-NOVA system, equipped with a non-monochromatic Al Ka (1486.6 eV) X-ray source.

2.4. Measurement of photocatalytic activity

The photocatalytic experiments were carried out at the natural pH of Rh-B dye solution. 10 ppm of Rh-B aqueous solution and the required amount of photocatalyst were taken in a Quartz vessel. Before irradiation, the suspension was stirred in dark for 30 min to ensure the adsorption–desorption equilibrium. The simulated solar light irradiation was produced by a 150 W xenon arc lamp (ABET technologies, LS series light source). During light irradiation, samples were withdrawn from the suspension at a defined time interval. Then, the photocatalyst was removed by centrifugation and the residual Rh-B concentration was analyzed with the help of a UV-vis spectrophotometer.

3. Results and discussion

3.1. Characterization

XRD, TEM and XPS. Fig. 1 shows the XRD profiles of YVO4, AgI and AgI–YVO4. The diffraction peaks of YVO4 are indexed well with the tetragonal zircon-type,24 according to the standard JCPDS data (no. 17-0341). The major peaks for AgI are matched well with the standard hexagonal β-phase (JCPDS no. 09-0374).25 The important peak patterns of AgI–YVO4 are similar to that of pure YVO4 and the peaks for AgI are also detected. It is noted that the peak intensities of AgI increase with increasing of its concentration. Moreover at the same time, the peak intensities corresponding to YVO4 gradually decrease, indicating the decrease of crystallinity. No peaks related to Ag metal phase and impurities are detected in the XRD patterns of AgI–YVO4.
image file: c4ra14291h-f1.tif
Fig. 1 XRD profiles of YVO4, AgI and AgI–YVO4.

The TEM images of YVO4, AgI and AgI–YVO4 are displayed in Fig. 2. It is noticed from Fig. 2(a) that YVO4 consists of rice like grain and rod shape particles with size range from 20 nm to 25 nm. AgI is composed sheets like morphology with large number of layers [Fig. 2(b) and (c)], and an average size of 25 nm. For AgI–YVO4 [Fig. 2(d)–(f)], AgI nano sheets are distributed on the surface of YVO4 nano-grains. The YVO4 nano-grains are agglomerated after modification with AgI. The homogeneity and the interaction of AgI on YVO4 increases while the concentration of AgI increases from 2% to 10%.


image file: c4ra14291h-f2.tif
Fig. 2 TEM images of (a) YVO4 (b and c) AgI (d) 2% AgI–YVO4 (e) 5% AgI–YVO4 (f) 10% AgI–YVO4.

The existence and distribution of AgI on the surface of YVO4 were further examined by HR-TEM analysis, and the results are shown in Fig. 3. There are two kinds of components are observed in Fig. 3(b), indicating the presence of AgI and YVO4. HR-TEM elemental mapping results (Fig. 4(c)) also confirm that Ag, I, Y, V and O elements are truly existed in the catalyst.


image file: c4ra14291h-f3.tif
Fig. 3 (a and b) HR TEM images of 10% AgI–YVO4 (c) HR-TEM elemental mapping images of 10% AgI–YVO4.

image file: c4ra14291h-f4.tif
Fig. 4 XPS spectra of 10% AgI–YVO4 sample: (a) survey spectrum, (b) I 3d, (c) Ag 3d, (d) V 2p, (e) Y 3p, and (f) Y 3d.

The composition, atomic state and distribution of elements were analyzed by XPS. Fig. 4 illustrates the XPS of 10% AgI–YVO4. The peaks centered at 368.37 eV and 374.49 eV are assigned to Ag 3d5/2 and Ag 3d3/2, respectively,25 which suggests that Ag is present in the form of Ag+. The peak for Ag0 is not found. The characteristic peaks of I are appeared at 619.99 eV (I 3d5/2) and 631.37 eV (I 3d3/2).25 The O 1s peak is observed with a binding energy value of 529.83 eV. C 1s peak observed at 284.60 eV is attributed to the presence of carbon from the specimen of XPS instrument.26 The peaks located at 517.07 eV and 524.78 eV are ascribed to V 2p3/2 and V 2p1/2, respectively.27 The peaks corresponding to Y 3d5/2, Y 3d3/2, Y 3p3/2 and Y 3p1/2 for YVO4 are detected at 156.82 eV, 158.91 eV, 300.88 eV and 312.75 eV, respectively.4 The above results confirmed that AgI is successfully decorated on the surface of YVO4, which is also in agreement with the XRD data.

BET. The BET surface area was calculated on the basis of the N2 adsorption–desorption isotherms, as shown in Fig. 5. YVO4 and AgI–YVO4 samples have type III isotherms, which are the characteristic of non-porous materials according to the IUPAC classification. These results suggest that the non-porous structure of YVO4 is not affected by AgI modification. The surface area, average pore diameter and total pore volume of YVO4, AgI–YVO4 and AgI are listed in Table 1. The surface area of YVO4, 2% AgI–YVO4, 5% AgI–YVO4, 10% AgI–YVO4 and AgI were found to be 39.56 m2 g−1, 35.50 m2 g−1, 32.84 m2 g−1, 24.03 m2 g−1 and 0.96 m2 g−1, respectively. The surface area of YVO4 is greatly reduced from 39.56 m2 g−1 to 24.03 m2 g−1, when increase the concentration of AgI from 2% to 10%. This is attributed to the interaction between YVO4 and AgI. Lv et al.28 reported that the decrease in surface area was related to the BJH desorption cumulative volume of pores of the prepared samples. The average pore volume of AgI–YVO4 samples are smaller than that of YVO4, indicating the pores of YVO4 are blocked by AgI modification.16
image file: c4ra14291h-f5.tif
Fig. 5 N2 adsorption–desorption isotherms of (a) YVO4 (b) 2% AgI–YVO4 (c) 5% AgI–YVO4 (d) 10% AgI–YVO4.
Table 1 BET surface area, average pore diameter and total pore volume of YVO4, AgI–YVO4 and AgI
S. no. Sample SBET (m2 g−1) Average pore diameter (nm) Total pore volume (cm3 g−1)
1 YVO4 39.56 38.78 0.3835
2 2% AgI–YVO4 35.50 34.13 0.3030
3 5% AgI–YVO4 32.84 46.25 0.3798
4 10% AgI–YVO4 24.03 47.27 0.2841
5 AgI 0.96 −2.67 0


UV-vis-DRS and PL. Fig. 6(a) depicts the UV-vis-DRS of YVO4, AgI and AgI–YVO4. The absorption edges of YVO4 and AgI are located at about 360 nm and 450 nm, respectively. AgI–YVO4 samples have two absorption edges at 360 nm and 450 nm, indicating a combination of absorption property of YVO4 with that of AgI. Moreover, the absorption edge corresponding to YVO4 is red shifted whereas that of AgI is blue shifted. AgI modification improves the visible light response of YVO4. The band gap energy values were deduced from the UV-vis-DRS spectra by applying Tauc approach (A plot of (αhν)1/2 versus hν).29 From Fig. 6(b), the band gap values of YVO4 and AgI are found to be 3.40 eV and 2.75 eV, respectively, which are consistent with the previous reports.11,22
image file: c4ra14291h-f6.tif
Fig. 6 (a) UV-vis DRS of YVO4, AgI and AgI–YVO4 (b) Tauc plots of YVO4 and AgI.

PL spectra result from the transfer, migration and recombination of photo-generated electron–hole pairs in a semiconductor. Hence, PL spectroscopy is an effective tool to understand the separation efficiency of photo-induced carriers. PL spectra of YVO4, AgI and AgI–YVO4 at room temperature are presented in Fig. 7. The observed decrease in the PL intensity of the prepared samples is in the following order: 2% AgI–YVO4 > 5% AgI–YVO4 > YVO4 > 10% AgI–YVO4 > AgI. There are two emission peaks detected in YVO4: a broad peak at 530 nm and one sharp peak at 575 nm. It may results from radiative recombination of photo-generated holes with electrons occupying the oxygen vacancies in a semiconductor.30 It is clearly observed that the PL of intensity of YVO4 increases with increasing of AgI concentration up to 5%, after that the PL intensity decreases. Among the samples prepared, 10% AgI–YVO4 has the lowest PL intensity, suggesting that the electron–hole recombination rate is lowest. Park et al.31 studied the photocatalytic activity of BiOI modified with silver. They also observed that the PL intensity of BiOI increased with respect to increase in silver loading.


image file: c4ra14291h-f7.tif
Fig. 7 PL spectra of YVO4, AgI and AgI–YVO4.

3.2. Photocatalytic activity

The effect of AgI concentration on the photocatalytic activity of YVO4 was studied by the degradation of Rh-B (10 ppm) under simulated solar light irradiation. The concentration of the photocatalyst was fixed at 1.25 g L−1. The time dependent UV-vis spectral changes of Rh-B under different conditions [(a) YVO4, (b) 2% AgI–YVO4, (c) 5% AgI–YVO4, (d) 10% AgI–YVO4, (e) photolysis, (f) dark adsorption & (g) AgI] are shown in Fig. 8. The absorption maximum of Rh-B at 554 nm decreases only to a small extent in the case of YVO4. However, the absorption maximum of Rh-B decreased gradually with a blue shift and almost disappeared after 3 h of irradiation in the presence of 10% AgI–YVO4. The observed blue shift is attributed to de-ethylation of Rh-B. Similar kind of trend was observed by the researchers for the photo-degradation of Rh-B using different catalysts.32–35 The molecular structure of Rh-B with four ethyl groups is shown in the inset of Fig. 8(d). Wu et al.34 explained that Rh-B molecule was de-ethylated in a step wise manner during photo-degradation. The λmax value of tetra ethylated rhodamine (i.e., Rh-B), N,N,N-tri-ethylated rhodamine, N,N-di-ethylated rhodamine, N-ethylated rhodamine, and rhodamine (de-ethylated) are 552 nm, 539 nm, 522 nm, 510 nm and 498 nm, respectively. The color changes of Rh-B (inset of Fig. 8(d), from pink to light red, and yellow) also confirm the formation of de-ethylated intermediates. After the 3 h of irradiation, the pink color solution becomes color less and also the absorption peak at 498 nm is disappeared, indicating the complete degradation of the conjugated structure. The formation of de-ethylated Rh-B intermediates depends on the oxidation ability of photocatalyst.
image file: c4ra14291h-f8.tif
Fig. 8 The temporal UV-vis spectral changes of Rh-B (10 ppm) under different conditions [(a) YVO4, (b) 2% AgI–YVO4, (c) 5% AgI–YVO4, (d) 10% AgI–YVO4, (e) photolysis, (f) dark adsorption & (g) AgI].

The photo-degradation profiles of Rh-B (10 ppm) as a function of irradiation time over different photocatalysts (1.25 g L−1) are presented in Fig. 9. The photocatalytic activity of catalysts is increased in the order of YVO4 < 2% AgI–YVO4 < 5% AgI–YVO4 < 10% AgI–YVO4 < AgI. Only 26% of Rh-B degradation without concomitant changes in absorption peak position is achieved in the presence YVO4. The photodegradation percentage of Rh-B using 2% AgI–YVO4, 5% AgI–YVO4, 10% AgI–YVO4 and AgI are 79%, 95%, 98% and 100%, respectively. To further study the effect of AgI concentration on YVO4, 20% and 40% AgI–YVO4 were prepared and tested for the photocatalytic activity. The results testify that the concentration of AgI plays a key role in the photocatalytic activity of YVO4. The direct photolysis of Rh-B under light irradiation is 36%, suggesting that the dye is degraded very slowly without any shit of absorption maximum (Fig. 8(e)). The adsorption capacity of 10% AgI–YVO4 was also checked for 3 h, only limited amount of Rh-B removal (23%) was achieved. The photocatalysis, photolysis and dark adsorption results of 10% AgI–YVO4 clearly confirm the contribution of light and catalyst in the degradation of Rh-B.


image file: c4ra14291h-f9.tif
Fig. 9 Photocatalytic activities of as-prepared samples (1.25 g L−1) toward the degradation of Rh-B (10 ppm).

The photocatalytic activity of AgI–YVO4 can be explained as follows: According to BET and PL results the photocatalytic activity of YVO4 should be good. However, the photodegradation results revealed that the activity of a semiconductor is not merely attributable to surface area and electron–hole recombination process. Yan et al.36 reported that the photocatalytic activity of a semiconductor was also influenced by crystalline phase, exposed crystalline facets and surface/bulk defects. In most of the cases photocatalytic activity is promoted by surface defects, when compared to others. The separation of electron–hole pairs is enhanced when the photo-generated holes are trapped by surface defects (defect clusters). The trapped holes can easily react with electron donors and hence the photocatalytic activity will be enhanced. Park et al.31 also observed similar kind of inconsistency between PL results and photocatalytic activity. They informed that the improvement in the photocatalytic performance was related to dye sensitization process. The increase in PL intensity of 2% and 5% AgI–YVO4 is ascribed to the presence of more number of oxygen vacancies.30 The oxygen vacancy can act as electron capturing center and enhance the photocatalytic activity.37,38

The conduction band (CB) and valence band (VB) positions of YVO4 and AgI at the point of zero charge were calculated using Butler and Ginley equation:39

 
EVB = XEe + 0.5Eg (1)
 
ECB = EVBEg (2)
where, EVB is the valance band potential, ECB is the conduction band potential, X is the absolute electro negativity of the semiconductor (geometric mean of the absolute electronegativity of the constituent atoms), Ee is the energy of free electrons on hydrogen scale (4.5 eV) and Eg is the band gap energy. The X values of YVO4 and AgI are 5.77 and 5.47. The CB and VB positions of YVO4 are estimated to be −0.43 eV and 2.97 eV, respectively. The CB and VB positions of AgI are found to be −0.38 eV and 2.32 eV, respectively. The LUMO and HOMO positions of Rh-B were reported as −1.42 eV and 0.95 eV, respectively.40 Based on the CB and VB positions and literatures,41–43 a possible schematic diagram of electron–hole transfer process in AgI–YVO4 was proposed. As displayed in Fig. 10, the LUMO of Rh-B is higher than the CB of YVO4 and AgI, suggesting that electrons could easily inject into the CB of YVO4 and AgI from Rh-B*. Under simulated solar light irradiation, the narrow band gap AgI could be easily excited because of its high photosensitivity, indicating electrons and holes are generated in the CB and VB respectively. The electrons in the CB of AgI rapidly transferred to the surface and are scavenged by oxygen, producing super oxide radical (O2˙). The holes present in the VB of AgI directly oxidize the Rh-B molecule or it further reacts with water to form hydroxyl radical (˙OH). As it is well known that both O2˙ and ˙OH have strong oxidization power, which will degrade the conjugated organic dye molecule. Here, YVO4 may act as very good support for AgI, involve in the transfer of electrons to AgI from Rh-B* and it will prevent AgI from photo-deactivation.


image file: c4ra14291h-f10.tif
Fig. 10 The proposed schematic diagram of electron transfer in AgI–YVO4 for the photodegradation of Rh-B under simulated solar light irradiation.

The reusability and stability of a photocatalytst are very important things for its practical application. The catalyst is recovered after each cycle by centrifugation, dried at 80 °C for 24 h and then reused. The results of the recycle photocatalytic tests of 10% AgI–YVO4 and pure AgI are depicted in Fig. 11. As shown in figure, AgI showed 100% photocatalytic activity in the first cycle. However, the activity of pure AgI is destroyed during the recycling experiments. This is ascribed to the formation of metallic silver from the decomposition of pure AgI in photoreaction. The photocatalytic activity of 10% AgI–YVO4 is effectively maintained at 98.3% after the third reuse, suggesting that AgI on YVO4 does not undergo photo-deactivation. It is clearly confirmed that the immobilization of AgI on YVO4 is highly required to maintain its photocatalytic activity. The recycling experiments imply that AgI–YVO4 could effectively use for the degradation of organic pollutants in water.


image file: c4ra14291h-f11.tif
Fig. 11 Recycle photocatalytic performance of AgI and 10% AgI–YVO4 for the degradation of Rh-B.

4. Conclusion

In summary, AgI–YVO4 samples have been successfully designed via sono-chemical deposition method. XRD results indicate that the as-prepared catalysts composed of tetragonal zircon type YVO4 and β-hexagonal phase AgI. BET results revealed that the surface area of AgI–YVO4 is smaller than that of YVO4. The existence of AgI on the surface of YVO4 has been confirmed using XPS and HR-TEM elemental mapping analysis. AgI–YVO4 samples possess good photocatalytic performance for the degradation of Rh-B under simulated solar light irradiation due to their unique morphology and optical property. Moreover, the photocatalyst can be reused for four times without loss of its activity. The stability of AgI–YVO4 is good when compared to pure AgI. The high photocatalytic efficiency and reusability of AgI–YVO4 could make it a potential candidate for the purification of water contaminated with organic dyes.

Acknowledgements

This work was supported by the National Research Foundation of Korea (NRF) grant funded by the Korea government (2012R1A1A3005043), for which the authors are very grateful.

References

  1. A. Primo, A. Corma and H. Garcia, Phys. Chem. Chem. Phys., 2011, 13, 886–910 RSC.
  2. K. Laohhasurayotin and D. Viboonratanasri, Phys. Chem. Chem. Phys., 2013, 15, 9626–9635 RSC.
  3. X. Zheng, D. Li, X. Li, L. Yu, P. Wang, X. Zhang, J. Fang, Y. Shao and Y. Zheng, Phys. Chem. Chem. Phys., 2014, 16, 15299–15306 RSC.
  4. C. Han, M.-Q. Yang, B. Weng and Y.-J. Xu, Phys. Chem. Chem. Phys., 2014, 16, 16891–16903 RSC.
  5. S. Zhang, F. Ren, W. Wu, J. Zhou, X. Xiao, L. Sun, Y. Liu and C. Jiang, Phys. Chem. Chem. Phys., 2013, 15, 8228–8236 RSC.
  6. W. Shi, F. Guo, J. Chen, G. Che and X. Lin, J. Alloys Compd., 2014, 612, 143–148 CrossRef CAS PubMed.
  7. T. H. Noh, D. W. Kim, S. W. Seo, I. S. Cho, D. H. Kim, H. S. Han and K. S. Hong, Mater. Lett., 2012, 72, 98–100 CrossRef CAS PubMed.
  8. B.-X. Lei, L.-L. Zeng, P. Zhang, Z.-F. Sun, W. Sun and X.-X. Zhang, Adv. Powder Technol., 2014, 25, 946–951 CrossRef CAS PubMed.
  9. S. Dong, J. Feng, Y. Li, L. Hu, M. Liu, Y. Wang, Y. Pi, J. Sun and J. Sun, Appl. Catal., B, 2014, 152–153, 413–424 CrossRef CAS PubMed.
  10. X. Hu, C. Hu and J. Qu, Mater. Res. Bull., 2008, 43, 2986–2997 CrossRef CAS PubMed.
  11. R. M. Mohamed, F. A. Harraz and I. A. Mkhalid, J. Alloys Compd., 2012, 532, 55–60 CrossRef CAS PubMed.
  12. L. Z. Pei, Y. K. Xie, Y. Q. Pei, Y. X. Jiang, H. Y. Yu and Z. Y. Cai, Mater. Res. Bull., 2013, 48, 2557–2565 CrossRef CAS PubMed.
  13. X. An, Y. Wang, J. Deng, J. Chen, R. Yu and X. Xing, Inorg. Chem. Commun., 2014, 44, 79–82 CrossRef CAS PubMed.
  14. L. Yang, G. Li, W. Hu, M. Zhao, L. Sun, J. Zheng, T. Yan and L. Li, Eur. J. Inorg. Chem., 2011, 2011, 2211–2220 CrossRef.
  15. J. Cai, Y. He, X. Wang, L. Zhang, L. Dong, H. Lin, L. Zhao, X. Yi, W. Weng and H. Wan, RSC Adv., 2013, 3, 20862–20868 RSC.
  16. R. M. Mohamed and E. S. Aazam, J. Ind. Eng. Chem., 2014, 20, 4377–4381 CrossRef CAS PubMed.
  17. H. Yu, L. Liu, X. Wang, P. Wang, J. Yu and Y. Wang, Dalton Trans., 2012, 10405–10411 RSC.
  18. C. An, W. Jiang, J. Wang, S. Wang, Z. Ma and Y. Li, Dalton Trans., 2013, 8796–8801 RSC.
  19. K. Vignesh, A. Suganthi, M. Rajarajan and S. A. Sara, Powder Technol., 2012, 224, 331–337 CrossRef CAS PubMed.
  20. B. Wen, X.-H. Wang, J. Lu, J.-L. Cao and Z.-S. Wang, Mater. Res. Bull., 2013, 48, 1806–1810 CrossRef CAS PubMed.
  21. B. Chen, Y. Deng, H. Tong and J. Ma, Superlattices Microstruct., 2014, 69, 194–203 CrossRef CAS PubMed.
  22. Z. Chen, W. Wang, Z. Zhang and X. Fang, J. Phys. Chem. C, 2013, 117, 19346–19352 CAS.
  23. L. Dong, Y. He, T. Li, J. Cai, W. Hu, S. Wang, H. Lin, M. Luo, X. Yi, L. Zhao, W. Weng and H. Wan, Appl. Catal., A, 2014, 472, 143–151 CrossRef CAS PubMed.
  24. H. Xu, H. Wang and H. Yan, J. Hazard. Mater., 2007, 144, 82–85 CrossRef CAS PubMed.
  25. S. Feng, H. Xu, L. Liu, Y. Song, H. Li, Y. Xu, J. Xia, S. Yin and J. Yan, Colloids Surf., A, 2012, 410, 23–30 CrossRef CAS PubMed.
  26. F. Xie, X. Mao, C. Fan and Y. Wang, Mater. Sci. Semicond. Process., 2014, 27, 380–389 CrossRef CAS PubMed.
  27. Y.-C. Chen, Y.-C. Wu, D.-Y. Wang and T.-M. Chen, J. Mater. Chem., 2012, 22, 7961–7969 RSC.
  28. Y. Lv, H. Liu, W. Zhang, S. Ran, F. Chi, B. Yang and A. Xia, J. Environ. Chem. Eng., 2013, 1, 526–533 CrossRef CAS PubMed.
  29. K. Vignesh, A. Suganthi, M. Rajarajan and R. Sakthivadivel, Appl. Surf. Sci., 2012, 258, 4592–4600 CrossRef CAS PubMed.
  30. C. Li, R. Hu, T. Zhou, H. Wu, K. Song, X. Liu and R. Wang, Mater. Lett., 2014, 124, 81–84 CrossRef CAS PubMed.
  31. Y. Park, Y. Na, D. Pradhan, B.-K. Min and Y. Sohn, CrystEngComm, 2014, 16, 3155–3167 RSC.
  32. Q. Wang, J. Hui, L. Yang, H. Huang, Y. Cai, S. Yin and Y. Ding, Appl. Surf. Sci., 2014, 289, 224–229 CrossRef CAS PubMed.
  33. Y. Liu, X. Liu, D. Lu, P. Fang, R. Xiong, J. Wei and C. Pan, J. Mol. Catal. A: Chem., 2014, 392, 208–215 CrossRef CAS PubMed.
  34. T. Wu, G. Liu and J. Zhao, J. Phys. Chem. B, 1998, 102, 5845–5851 CrossRef CAS.
  35. L. Lu, L. Kong, Z. Jiang, H. H.-C. Lai, T. Xiao and P. P. Edwards, Catal. Lett., 2012, 142, 771–778 CrossRef CAS.
  36. J. Yan, G. Wu, N. Guan, L. Li, Z. Li and X. Cao, Phys. Chem. Chem. Phys., 2013, 15, 10978–10988 RSC.
  37. A. Mclaren, T. Valdes-Solis, G. Q. Li and S. C. Tsang, J. Am. Chem. Soc., 2009, 131, 12540–12541 CrossRef CAS PubMed.
  38. Y. Liu, Z. H. Kang, Z. H. Chen, I. Shafiq, J. A. Zapien, I. Bello, W. J. Zhang and S. T. Lee, Cryst. Growth Des., 2009, 9, 3222–3227 CAS.
  39. L. Chen, S.-F. Yin, S.-L. Luo, R. Huang, Q. Zhang, T. Hong and P. C. T. Au, Ind. Eng. Chem. Res., 2012, 51, 6760–6768 CrossRef CAS.
  40. O. F. Lopes, E. C. Paris and C. Ribeiro, Appl. Catal., B, 2014, 144, 800–808 CrossRef CAS PubMed.
  41. R. Liu, P. Hu and S. Chen, Appl. Surf. Sci., 2012, 258, 9805–9809 CrossRef CAS PubMed.
  42. X. Zheng, D. Li, X. Li, L. Yu, P. Wang, X. Zhang, J. Fang, Y. Shao and Y. Zheng, Phys. Chem. Chem. Phys., 2014, 16, 15299–15306 RSC.
  43. H. Li, J. Liu, W. Hou, N. Du, R. Zhang and X. Tao, Appl. Catal., B, 2014, 160–161, 89–97 CrossRef CAS PubMed.

This journal is © The Royal Society of Chemistry 2015