Growth pathways of silver nanoplates in kinetically controlled synthesis: bimodal versus unimodal growth

Mun Ho Kim*a, Dong Ki Yoonb and Sang Hyuk Im*c
aDepartment of Polymer Engineering, Pukyong National University, 365 Sinseon-ro, Nam-Gu, Busan 608-739, Republic of Korea. E-mail: munho@pknu.ac.kr; Fax: +82-51-629-6459; Tel: +82-51-629-6429
bGraduate School of Nanoscience and Technology, Center for Nature-inspired Technology in KAIST Institute for the NanoCentury, KAIST, Daejeon, 305-701, Republic of Korea
cDepartment of Chemical Engineering, Kyung Hee University, 1732 Deogyeong-daero, Giheung-gu, Yongin-si, Gyeonggi 446-701, Republic of Korea. E-mail: imromy@khu.ac.kr; Fax: +82-31-204-8114; Tel: +82-31-204-5274

Received 21st October 2014 , Accepted 21st January 2015

First published on 22nd January 2015


Abstract

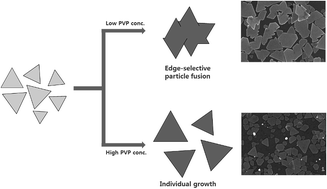
Silver nanoplates were synthesized by reducing silver nitrate (AgNO3) with poly(vinyl pyrrolidone) (PVP) in N,N-dimethylformamide (DMF). In the synthesis, the hydroxyl end groups of the PVP served as a mild reductant in the kinetically controlled synthesis, and DMF played a critical role as a reaction medium (solvent) for the formation and growth of the nanoplates. In the present study, the growth of the nanoplates proceeded along different pathways, as evidenced by variations in the shape evolution, depending on the PVP to AgNO3 weight ratio. When the concentration of PVP is below a certain value, a large number of small nanoplates with different sizes were initially formed and then fused together along their lateral planes, leading to the formation of a secondary large nanoplate (bimodal particle growth). When the PVP concentration became higher and the surface capping was enhanced, the small nanoplates continued to grow individually without fusing (unimodal particle growth). This study not only advanced our understanding of the role played by PVP in the kinetically controlled synthetic reaction but also allows us to produce Ag nanoplates with a high aspect ratio in a single step.

Introduction

Recently two-dimensional (2D) conducting nanosheets such as graphenes have been of great interest because they can be applied to bendable or stretchable electrodes for displays, and barrier films.1 However, the 2D metal nanostructures including silver (Ag) nanoplates have not been considered as promising materials for these applications. To reduce the percolation threshold for conductivity and enhance the barrier property, Ag nanoplates with a high aspect ratio are preferred. Although several different routes to the synthesis of Ag nanoplates have been developed, including photo-induced transformation and chemical reduction of Ag+ in the presence or absence of seeds, most Ag nanoplates prepared from single-step synthetic routes based on solution-phase methods generally provide lateral sizes of less than 500 nm.2–4 Successive deposition procedures based on seed-mediated growth have shown success as alternative approaches in an effort to obtain Ag nanoplates with lateral sizes exceeding 1 μm.5 However, multistep deposition processes require long process times and continuous effort relative to the single-step reduction approaches. The single-step production of Ag nanoplates with a high aspect ratio in a high yield remains a significant challenge.

A breakthrough in producing Ag nanoplates with a high aspect ratio has been demonstrated by other groups: small nanoplates can be connected to one another to form a secondary large plate through an edge-selective particle fusion mechanism. Mirkin and coworkers reported the bimodal particle growth of Ag nanoplates, in which small nanoplates were joined together through an edge-selective particle fusion process controlled by photon excitation. This process led to the formation of a large secondary nanoplate.6 Recently, Kim and coworkers reported the two-dimensional (2D) oriented attachment-based growth of Ag nanoplates based on a polyol process.7 However, the growth of Ag nanoplates via a particle fusion process has not been reported in kinetically controlled synthetic reaction using PVP as a reducing agent and stabilizer.

Here, we describe the development of a new and facile synthetic method, from which the growth pathway of Ag nanoplates could be changed depending on the concentration of PVP serving as both a reducing agent and a stabilizer. When the concentration of PVP is below a certain value, the new method enabled the formation of Ag nanoplates with lateral sizes exceeding 1 μm and thickness values of approximately 30 nm. In this conditions, the nanoplates grew via a particle fusion process, and the shapes and structures of the nanoplates are very unique. At a high PVP concentration, most of the Ag nanoplates continued to grow individually by retaining their shape. Here, we describe a detailed study of the structural and morphological changes displayed during the growth of Ag nanoplates. This work advances in the quantitative analysis of the role played by PVP in the kinetically controlled syntheses and provides a new route to the synthesis of Ag nanoplates with a high aspect ratio via particle fusion process.

Experimental section

Chemicals and materials

Silver nitrate (AgNO3, 209[thin space (1/6-em)]139, 100 g) and PVP (Mw ≈ 10, 29, 55 kDa) were purchased from Aldrich (USA) and were used as received without further purification. N,N-Dimethylformamide (DMF, 227[thin space (1/6-em)]056, 1 L), which was used in all reactions was purchased from Aldrich (USA). The deionized (DI) water (AH365-4, 4 L) used in the reaction was a product of SK Chemicals (Republic of Korea).

Synthesis of Ag nanoplates

In a typical synthesis, 1.870 g PVP (Mw ≈ 29 kDa) was dissolved in 8 mL DMF in a 20 mL vial (a liquid scintillation vial with a polyethylene liner and a white cap, Research Product International Corp.). Three milliliters of the DMF solution containing AgNO3 (188 mM) were rapidly added to the vial using a glass pipette. In a typical synthesis, the PVP-to-AgNO3 weight ratio in the total reaction mixture was fixed at 19.5. After the vial had been capped, the reaction continued with heating at 100 °C in air with magnetic stirring for 24 h. The size and shape changes displayed by the particles during the reaction were observed by conducting a series of reactions under identical conditions and stopping each reaction at a distinct point in time. The reduction rate was adjusted in another series of reactions by adding different amounts of 29 kDa PVP, to provide a PVP-to-AgNO3 w/w ratio that ranged from 2.5 to 39.0, or by varying the molecular weight of the PVP. The final product was collected by centrifugation and was washed with DI water three times to remove most of the DMF and PVP. During the washing process, the suspension was centrifuged at 14[thin space (1/6-em)]000 rpm for 10 min. Finally, the precipitate was re-dispersed in DI water for use in subsequent characterization studies.

Instrumentation

The SEM (or TEM) sample was prepared by placing a drop of the final product (suspended in DI water) on a silicon wafer (or carbon-coated copper grid), and then drying the sample in a fume hood. The sample was then transferred to a gravity-fed flow cell and washed for 1 h with DI water to remove the remaining PVP. Finally, the sample was dried and stored in a vacuum. SEM images were recorded using a field-emission scanning electron microscope (Sirion, FEI) operated at an accelerating voltage of 10 kV. TEM and high-resolution TEM images were obtained using a Phillips Tecnai G220 microscope operated at 200 kV and a Philips Tecnai F30 microscope operated at 300 kV. AFM images were collected on a Seiko SPA-400 with an SPI-3800 probe station. X-ray diffraction (XRD) was recorded using a Philips 1820 diffractometer.

Results and discussion

PVP is nontoxic, highly chemically stable, and displays excellent solubility in a variety of polar solvents.8 PVP has been widely used in the synthesis of metal nanostructures as a steric stabilizer or capping agent to prevent agglomeration. PVP also acts as an ideal reducing agent, thanks to its weak reducing power, thereby enabling kinetic control over both the nucleation and growth steps.9 The slow reduction of AgNO3 by the hydroxyl end groups of PVP is instrumental to the formation of Ag nanoplates. Here, we demonstrate that the reduction kinetics of AgNO3 by the hydroxyl end group of PVP and the growth of nanoplates in DMF can be tuned in a variety of ways to yield Ag nanoplates with a different growth pathway.

DMF is a standard organic solvent used in a variety of process, including the preparation of metal colloids, due to the wide range of temperatures over which DMF is a liquid, its good chemical and thermal stability, its high polarity and its ability to solvate a variety of solutes.10 Previous publications have reported that the formation of {111} facets in Ag nanoparticles is favored in DMF in the presence of PVP, which indicates that these conditions can favor the formation of plate structures with a large {111} surface coverage.11 DMF can also act as a reducing agent for silver salts under suitable conditions. Liz-Marzan and coworkers reported the synthesis of Ag nanoplates using DMF as both a reaction medium and a reducing agent.12 In their report, silver atoms could be obtained by reducing Ag+ with DMF in the presence of water via the following reaction:

 
HCONMe2 + 2Ag+ + H2O → 2Ag0 + Me2NCOOH + 2H+ (1)

The presence of water is indispensable to this reaction, as the water molecules promoted the reduction of Ag+ ions. The role of DMF as a reaction medium in the kinetically controlled synthesis, using PVP as a reducing agent, was examined by withholding the addition of water. The reaction was also performed in a capped vial to completely exclude the possibility that water from the air could contaminate the reaction mixture.

The process by which the Ag nanostructures grew in DMF medium was monitored by characterizing the evolution of the nanostructure shapes at various points in time as the reaction proceeded. PVP has an average molecular weight of 29 kDa, and its weight ratio relative to AgNO3 was kept at 19.5. The synthesis of the Ag nanostructures was conducted at 100 °C. In the synthesis of Ag nanostructures, the reaction can be readily followed based on the distinctive color changes that accompanied each stage in the reaction process.13 Injection of the AgNO3 solution into the PVP solution yielded a yellow solution, indicating the formation of silver nanoparticles. Heating at 100 °C induced a series of color changes, from brownish-yellow, to brown, and blue over the course of 1 h. The solution then passed through a series of color changes that included blue, dark blue, and blue-gray over a period of 24 h. Fig. 1A and B show SEM and TEM images of the nanoparticles obtained after a 1 h reaction time. Most of the nanoparticles had plate structures with triangular and circular shapes. Multiply twinned parties were not observed, indicating that the nanoplates formed during the stage of nucleation, rather than through an evolutionary path from other shapes during the growth process. At this stage, the lateral sizes of most nanoplates were below 200 nm. Fig. 1C and D show SEM and TEM images of nanoparticles obtained after a 3 h reaction time. The sample contained large triangular nanoplates and small circular nanoplates.


image file: c4ra12818d-f1.tif
Fig. 1 TEM and SEM images of products sampled at different stages of a reaction: (A) and (B) t = 1 h, and (C) and (D) t = 3 h PVP (29 kDa) to AgNO3 w/w ratio was 19.5. The synthesis was performed at 100 °C.

Fig. 2 shows TEM and SEM images of Ag nanoplates sampled at different reaction times over a 6 h reaction period. As the reaction proceeded, small plates below a certain size disappeared whereas the large plates grew larger, reminiscent of an Ostwald ripening growth process. It should be noted that the nanoplates structures obtained after a reaction time of 6 h were unique in that they were asymmetric and irregular in shape, displaying a variety of edges and corners in a single nanoplate. The lateral dimensions of the nanoplates continued to increase with the reaction time up to a reaction time of 24 h. A considerable fraction of the nanoplates displayed a lateral size exceeding 1 μm. The vertical dimensions of the nanoplates as determined from the TEM contrast image, did not increase significantly over the reaction time. AFM was used to determine the thickness of the nanoplates after a reaction time of 24 h. Fig. S1 shows AFM image of nanoplates immobilized on a silicon wafer and the height profile along the line. The thickness of the nanoplates was found to be approximately 30 nm.


image file: c4ra12818d-f2.tif
Fig. 2 TEM and SEM images of products sampled at different stages of a reaction: (A) and (B) t = 6 h, (C) and (D) t = 12 h, and (E) and (F) t = 24 h. The PVP (29 kDa) to AgNO3 w/w ratio was 19.5. The synthesis was performed at 100 °C.

The X-ray diffraction (XRD) pattern recorded from the sample shown in Fig. 2E is also displayed in Fig. S2. In the pattern, only a peak at 38.2°, corresponding to the {111} plane, dominantly appeared in the spectrum. The intensities of peaks at 44.3, 64.4, and 77.3°, corresponding {200}, {220}, and {311} planes, are very low. The intensity ratio of the {111} to {200} diffraction peaks is much higher (about 45) than that of the bulk (about 2; JCPDS file no. 04-783).14 Ag nanoplate surfaces presented {111} facets at the top and bottom surfaces, and each nanoplate edge consisted of a {111} facet and a {100} facet, each with a different size.15 The abnormal intensity ratio indicates that the top and bottom faces tend to be preferentially oriented parallel to the surface of the supporting substrate because of high anisotropic features. The intensity ratios of the {111} to {200} diffraction peaks of Ag nanoplates increase with the reaction time as the aspect ratios of Ag nanoplates increase, as shown in Fig. S3.

The unusual nanoplate shapes and structures were further characterized using high-resolution TEM (HRTEM) imaging, with images collected perpendicular to the flat faces of several nanoplates. The HRTEM images and the corresponding fast Fourier transform (FFT) patterns are shown in Fig. S4. The six bright spots with 6-fold rotational symmetry also suggest that the particles were single crystalline and that the top and bottom faces were enclosed by the {111} planes. The patterns collected from several nanoplates were nearly identical. These results clearly showed that the nanoplates grew into a thin single-crystal without the introduction of twin defects, suggesting that the crystal structure did not change significantly during the growth process.

The nanoplates were asymmetric and irregular in shape, although they were large, thin, and uniform in thickness. These properties were unlikely to have arisen from a conventional nucleation and growth process involving Ostwald ripening.16 We propose the operation of two main Ag nanoplate formation mechanisms to yield the irregular shapes. Initially, a large number of small nanoplates with different sizes were formed under kinetic control. Small nanoplates then fused together along their lateral planes, leading to the formation of a secondary large nanoplate, as illustrated schematically in Fig. 3. The morphological evolution shown in Fig. 1 and 2 supports such a particle fusion process. Plot of the average size of the Ag nanoplates as a function of the reaction time in the formation of a large plate is shown in Fig. S5.


image file: c4ra12818d-f3.tif
Fig. 3 Schematic illustration of the formation of a large Ag nanoplate via the edge-selective particle fusion process.

The general ordering of the surface energies of the different facets of an fcc metal structure is: γ{111} < γ{100} < γ{110}.17 Cuboctahedra and MTPs formed from face-centered cubic (fcc) noble metals have low free energies because they are enclosed by a mixture of both {111} and {100} facets (cuboctahedra) or {111} facets (MTPs). In addition, they have nearly spherical profiles and small surface areas. Ag nanoplates display {111} facets at their top and bottom surfaces that have relatively low surface energy. However, the total free energy of a nanoplate is much higher than the corresponding energy of a cuboctahedra and multiply twinned particle because both the surface area and lattice strain energy caused by defects are large. The formation of nanoplates is not, therefore, thermodynamically favorable. Considerably slower reduction reactions yielded extremely low concentrations of Ag atoms, and the seeds bearing stacking faults could nucleate and then grow into nanoplates. This synthesis is often thought of as a kinetically controlled process. Most plate structures produced by single-step procedures are obtained by driving the reaction under kinetically controlled conditions. In such cases, the lateral growth tends to cease at a certain point, preventing the formation of large Ag nanoplates. To our knowledge, most Ag nanoplates prepared from single-step synthetic routes based on solution-phase methods generally provide lateral sizes of less than 500 nm.

When the growth of Ag nanoplates via a kinetically controlled process ceases, the nanoplates grows into more thermodynamically favored shape. As explained above, the Ag nanoplate surfaces presented {111} facets at the top and bottom surfaces. The edges of the nanoplates were bounded by a combination of {111} and {100} facets with surface energies that exceeded the surface energy of the top and bottom {111} facets. Therefore, small nanoplates could be connected into a large thin nanoplate along the lateral planes in order to reduce the surface energies of the entire system. These fusion connections provide a low surface energy by eliminating the high-energy facets; hence, this process is expected to be thermodynamically favorable.

The nanoplate growth mechanism via an edge-selective particle fusion process was further supported by examining the morphologies of the large Ag nanoplates. Fig. 4A and B show that lines were present on the top and bottom surfaces of most of the large nanoplates. These lines were expected to result from the imperfect fusion of small nanoplates. A single Ag nanoplate exhibited an overlapping structure, as shown in Fig. 4C. Fig. 4D shows an incomplete connecting line in a single nanoplate. The formation of these particles cannot be explained based on conventional nucleation and growth processes involving Ostwald ripening, suggesting that the morphologies of these large nanoplates provide evidence in support of an edge-selective particle fusion.


image file: c4ra12818d-f4.tif
Fig. 4 Typical (A) TEM and (B–D) SEM images of Ag nanoplates with morphologies that support the edge-selective particle fusion mechanism.

It should be noted that the nanoplate yield (the percentage of plates in the products) from this system was nearly 100%. Fig. 5A shows a low-magnification TEM image of a sample after a 24 h reaction time. The image indicates that most of the obtained nanostructures had plate structures. Fig. 5B shows a TEM image of a product obtained from DI water, which was used as the solvent in place of DMF, holding all other experimental conditions constant, as reported in Fig. 2E. Although the sample consisted of triangular nanoplates and quasi-spherical nanoparticles, the nanoplate yield was quite low. This result suggested that DMF played a vital role in the formation of Ag nanoplates. The quasi-spherical nanoparticles grown in water displayed inhomogeneous contrast across each particle in the TEM image, indicating the nanoparticles were multiply twinned structures. The water-based synthesis exhibited rapid color changes, transitioning from a yellow mixture to a greenish-grey color within 1 h. These observations indicated that the reduction rate was fast. A high fraction of the Ag atoms generated at a rapid rate apparently formed the thermodynamically favored shapes: multiply twinned particles. On the other hand, the DMF-based system displayed relatively slow color changes, suggesting that the reduction rate was quite slow in the DMF solution. The nucleation and growth of the Ag nanoplates then proceeded under kinetic control, and the most of the synthesized nanostructures assumed a plate structure.


image file: c4ra12818d-f5.tif
Fig. 5 (A) Low-magnification TEM image of the Ag nanoplates shown in Fig. 2E. (B) Low-magnification TEM image of a sample obtained under the conditions used to prepare the nanoplates shown in Fig. 2E, except that DI water was used as the reaction solvent in place of DMF.

The effects of DMF on the reduction kinetics of Ag+ were examined by adding a small amount of water to the reaction mixture to activate the reducing power of DMF. In the presence of water, silver atoms could also be reduced by DMF through the reaction (1). The reaction mixture displayed rapid color changes, indicating that the reduction rate had been increased. Fig. 6 shows a TEM image of a product obtained from the DMF/water reaction medium (with a DI water-to-DMF weight ratio of 0.091), holding all other experimental conditions constant, as reported in Fig. 1D. The product obtained from these reaction conditions consisted of only quasi-spherical nanoparticles with multiply twinned structures. DMF can reduce Ag+ ions, even at room temperature, and the reduction rate is greatly increased at high temperatures. Because DMF can rapidly reduce Ag+ ion at 100 °C (the reaction temperature of this synthesis), Ag nanoplates could not be obtained due to the high reduction rate. This result indicated that DMF acted as a reaction medium under conditions in which water was excluded from the reaction medium, and DFM was not significantly involved in the reduction of Ag+.


image file: c4ra12818d-f6.tif
Fig. 6 TEM image of Ag nanostructures obtained from a reaction medium containing a small amount of water (weight ratio water of DMF = 0.091). PVP (29 kDa) to AgNO3 w/w ratio was 19.5. The synthesis was performed at 100 °C over a period of 24 h.

The particle fusion process may compete with the surface capping reaction with the stabilizer. High concentrations of stabilizer would be expected to favor selective capping and prevent particle fusion process.18 This hypothesis was tested by conducting a series of syntheses reactions in which the weight ratio of PVP to AgNO3 was varied. A PVP-to-AgNO3 weight ratio of 39.0, in which the concentration of PVP was doubled, yielded relatively small nanoplates, as shown in Fig. 7A and B. The shapes of the resulting nanoparticles were quite regular compared to the shapes observed in Fig. 2, and most particles were triangular or truncated triangular in shape with sharp edges and corners. These results indicated that most of the Ag nanoplates continued to grow individually by retaining their shape. The thicknesses of these Ag nanoplates were measured using AFM, which indicated that most of the Ag nanoplates were 25–28 nm thick (see Fig. S6). The main products also contained a few small multiply twinned nanoparticles because the reaction rate increased when the PVP amount doubled. Reducing the weight ratio of PVP to AgNO3 to 2.5 by decreasing the concentration of PVP to 1/8 yielded long nanoplates with irregular shapes (Fig. 7C and D). The lateral sizes of these nanoplates exceeded 1 μm. In this case, the PVP capping effects were weak, and the small nanoplates fused to form long Ag nanoplates. Taken together, these results show that the Ag nanoplates continued to grow individually without fusing at high concentrations of PVP (a PVP-to-AgNO3 weight ratio exceeding 39.0).


image file: c4ra12818d-f7.tif
Fig. 7 (A) SEM and (B) TEM images of the Ag nanoplates. PVP (29 kDa) to AgNO3 w/w ratio was 39.0. The synthesis was performed at 100 °C over a period of 24 h. (C) SEM and (D) TEM images of the Ag nanoplates. PVP (29 kDa) to AgNO3 w/w ratio was 2.5. The synthesis was performed at 100 °C over a period of 24 h.

The new method has several advantages over previously reported procedures. To be applied to the bendable or stretchable electrodes for displays, and barrier films, Ag nanoplates with a high aspect ratio are preferred to reduce the percolation threshold for conductivity and enhance the barrier. The present method enabled the formation of Ag nanoplates with lateral sizes exceeding 1 μm and thickness values of approximately 30 nm. The reaction procedure is quite simple because it is a single-step synthetic route based on solution-phase method, without including multistep deposition process and seed-mediated growth.

In addition, the reaction yield of the Ag nanoplates (defined as the percentage of plate-like particles in the products) was very high. The synthetic results were reproducible, yielding Ag nanoplates in bulk quantities. Since it is based on the single-step synthetic routes, it does not need any special equipment. Since the nanoplates grew via a particle fusion process, the shapes and structures of the nanoplates are very unique. It is quite notable that the nanoplate growth proceeded along distinct pathways, characterized by distinct shape evolution properties, depending on the weight ratio of PVP to AgNO3. The table comparing the present method with previously reported procedures for producing Ag nanoplates is shown in Table S1.

Conclusions

Ag nanoplates were synthesized by reducing AgNO3 using PVP in DMF. In DMF, the PVP reduced Ag salt at a slow rate so that the nanoparticle growth process was kinetically controlled, leading to the formation of nanoplates with high reaction yields. During the reaction, a large number of small nanoplates with different sizes were formed under kinetic control and small nanoplates then fused together along their lateral planes. The fusion process led to the formation of irregularly shaped Ag nanoplates with lateral sizes exceeding 1 μm. When the PVP concentration became higher and the surface capping was enhanced, the small nanoplates continued to grow individually without fusing because of high surface capping by PVP. This work advances in the quantitative analysis of the role played by PVP in the kinetically controlled syntheses and provides a new route to the synthesis of Ag nanoplates with a high aspect ratio via particle fusion process.

Acknowledgements

This work was supported by a Research Grant of Pukyong National University (2014 year).

References

  1. (a) K. S. Kim, U. Zho, H. Jang, S. Y. Lee, J. M. Kim, K. S. Kim, J. H. Ahn, P. Kim, J. Y. Choi and B. H. Hong, Nature, 2009, 457, 706 CrossRef CAS PubMed; (b) X. Huang, Z. Zeng, Z. Fan, J. Liu and H. Zhang, Adv. Mater., 2012, 24, 5979 CrossRef CAS PubMed; (c) Y.-H. Yang, L. Bolling, M. A. Priolo and J. C. Grunlan, Adv. Mater., 2013, 25, 503 CrossRef CAS PubMed; (d) Y. Zhao, Y. Xie, Y. Y. Hui, L. Tang, W. Jie, Y. Jiang, L. Xu, S. P. Lau and Y. Chai, J. Mater. Chem. C, 2013, 1, 4956 RSC.
  2. (a) R. Jin, Y. Cao, C. A. Mirkin, K. L. Kelly, G. C. Schatz and J. G. Zheng, Science, 2001, 294, 1901 CrossRef CAS PubMed; (b) Y. Sun, M. Mayers and Y. Xia, Nano Lett., 2003, 3, 675 CrossRef CAS; (c) Q. Zhang, J. Goebl, Z. Lu and Y. Yin, J. Am. Chem. Soc., 2011, 133, 18931 CrossRef CAS PubMed; (d) L. P. Jiang, S. Xu, X. M. Zhu, J. R. Zhang, J. J. Zhu and H. Y. Chen, Inorg. Chem., 2004, 43, 5877 CrossRef CAS PubMed.
  3. (a) S. Chen and D. L. Carroll, Nano Lett., 2002, 2, 1003 CrossRef CAS; (b) M. Maillard, S. Giorgio and M.-P. Pileni, Adv. Mater., 2002, 14, 1084 CrossRef CAS; (c) J. Zhag, M. R. Langille and C. A. Mirkin, J. Am. Chem. Soc., 2010, 132, 12502 CrossRef PubMed; (d) Y. Xiong, A. R. Siekkinen, J. Wang, Y. Yin, M. J. Kim and Y. Xia, J. Mater. Chem., 2007, 17, 2600 RSC.
  4. (a) D. Aherne, D. M. Ledwith, M. Gara and J. M. Kelly, Adv. Funct. Mater., 2008, 18, 2005 CrossRef CAS; (b) J. E. Millston, S. H. Hurst, G. S. Metraux, J. I. Cutler and C. A. Mirkin, Small, 2009, 5, 646 CrossRef PubMed; (c) Q. Zhang, Y. Yang, J. Li, R. Iurilli, S. Xie and D. Qin, ACS Appl. Mater. Interfaces, 2013, 5, 6333 CrossRef CAS PubMed; (d) Y. Yang, X. L. Zhong, Q. Zhang, L. G. Blackstad, Z. Fu, Z. Y. Li and D. Qin, Small, 2014, 10, 1430 CrossRef CAS PubMed; (e) L. Huang, Y. Zhai, S. Dong and J. Wang, J. Colloid Interface Sci., 2009, 331, 384 CrossRef CAS PubMed.
  5. (a) J. Zeng, X. Xia, M. Rycenga, P. Henneghan, Q. Li and Y. Xia, Angew. Chem., Int. Ed., 2011, 50, 244 CrossRef CAS PubMed; (b) Q. Zhang, Y. Hu, S. Guo, J. Goebl and Y. Yin, Nano Lett., 2010, 10, 5037 CrossRef CAS PubMed.
  6. (a) R. Jin, Y. C. Cao, E. Hao, G. S. Metraux, G. C. Schatz and C. A. Mirkin, Nature, 2003, 425, 487 CrossRef CAS PubMed; (b) C. Xue and C. A. Mirkin, Angew. Chem., Int. Ed., 2007, 46, 2036 CrossRef CAS PubMed.
  7. Z. Liu, H. Zhou, Y. S. Lim, J. H. Song, L. Piao and S. H. Kim, Langmuir, 2012, 28, 9244 CrossRef CAS PubMed.
  8. L. A. Meure, B. Warwick, F. Dehghani, H. L. Regtop and N. R. Foster, Ind. Eng. Chem. Res., 2004, 43, 1103 CrossRef CAS.
  9. (a) I. Washio, Y. Xiong, Y. Yin and Y. Xia, Adv. Mater., 2006, 18, 1745 CrossRef CAS; (b) Y. Yiong, I. Washio, J. Chen, H. Cai, Z.-Y. Li and Y. Xia, Langmuir, 2006, 22, 8563 CrossRef PubMed; (c) B. Lim, P. H. C. Camargo and Y. Xia, Langmuir, 2008, 24, 10437 CrossRef CAS PubMed; (d) G.-H. Lim, I. Han, T. Yu and B. Lim, Chem. Phys. Lett., 2013, 568–569, 135 CrossRef CAS PubMed; (e) M. H. Kim, J. J. Lee, J. B. Lee and K. Y. Choi, CrystEngComm, 2013, 15, 4660 RSC; (f) M. H. Kim, J. J. Lee, J. B. Lee, K. Y. Choi and D. J. Byun, J. Mater. Chem. C, 2014, 2, 6165 RSC.
  10. (a) M. A. R. Meier, M. Filali, J. F. Gohy and U. S. Shubert, J. Mater. Chem., 2006, 16, 3001 RSC; (b) J. Sharma, S. Mahima, B. A. Kakade, R. Pasricha, A. B. Mandale and K. Vijayamohanan, J. Phys. Chem. B, 2004, 108, 13280 CrossRef CAS; (c) K. Osakada, A. Taniguchi, E. Kubota, S. Dev, K. Tanaka, K. Kubota and T. Yamamoto, Chem. Mater., 1992, 4, 562 CrossRef CAS.
  11. (a) M. Tsuji, R. Matsuo, P. Jiang, N. Miyamae, D. Ueyama, M. Nishio, S. Hikio, H. Kumagae, K. S. N. Kamarudin and X.-L. Tang, Cryst. Growth Des., 2008, 8, 2528 CrossRef CAS; (b) M. Tsuji, Y. Maeda, S. Hikino, H. Kumagae, M. Matsunaga, X.-L. Tang, R. Matsuo, M. Ogino and P. Jiang, Cryst. Growth Des., 2009, 9, 4700 CrossRef CAS; (c) W. Niu and G. Xu, Nano Today, 2011, 6, 265 CrossRef CAS PubMed.
  12. (a) I. Pastoriza-Santos and L. M. Liz-Marzan, Langmuir, 1999, 15, 948 CrossRef CAS; (b) I. Pastoriza-Santos and L. M. Liz-Marzan, Nano Lett., 2002, 2, 903 CrossRef CAS; (c) I. Pastoriza-Santos and L. M. Liz-Marzan, J. Mater. Chem., 2008, 18, 1724 RSC; (d) I. Pastoriza-Santos and L. M. Liz-Marzan, Adv. Funct. Mater., 2009, 19, 679 CrossRef CAS.
  13. (a) B. Wiley, T. Herricks, Y. Sun and Y. Xia, Nano Lett., 2004, 4, 1733 CrossRef CAS; (b) B. Wiley, S. H. Im, Z.-Y. Li, J. McLellan, A. Siekkinen and Y. Xia, J. Phys. Chem. B, 2006, 110, 15666 CrossRef CAS PubMed.
  14. (a) G. Liu, W. Cai, L. Kong, G. Duan and F. Lu, J. Mater. Chem., 2010, 20, 767 RSC; (b) X. Jiang, Q. Zeng and A. Yu, Nanotechnology, 2006, 17, 4929 CrossRef CAS.
  15. (a) C. Lofton and W. Sigmund, Adv. Funct. Mater., 2005, 15, 1197 CrossRef CAS; (b) Y. Xiong, I. Washoi, J. Chen, M. Sadilek and Y. Xia, Angew. Chem., Int. Ed., 2007, 46, 4917 CrossRef CAS PubMed.
  16. (a) J. Zhang, F. Huang and Z. Lin, Nanoscale, 2010, 2, 18 RSC; (b) C. J. Dalmaschio, C. Ribeiro and E. R. Leite, Nanoscale, 2010, 2, 2336 RSC.
  17. L. Lu, A. Kobayashi, K. Tawa and Y. Ozaki, Chem. Mater., 2006, 18, 4894 CrossRef CAS.
  18. (a) J. M. Petroski, Z. L. Wang, T. C. Green and M. A. El-Sayed, J. Phys. Chem. B, 1998, 102, 3316 CrossRef CAS; (b) K. W. Choi, D. Y. Kim, X. L. Zhong, Z. Y. Li, S. H. Im and O. O. Park, CrystEngComm, 2013, 15, 252 RSC.

Footnote

Electronic supplementary information (ESI) available: AFM images of Ag nanoplates, XRD-patterns of Ag nanoplates, high-resolution TEM images of Ag nanoplates, and a table comparing the present method with previously reported procedures. See DOI: 10.1039/c4ra12818d

This journal is © The Royal Society of Chemistry 2015
Click here to see how this site uses Cookies. View our privacy policy here.