Comprehensive chemical secretory measurement of single cells trapped in a micro-droplet array with mass spectrometry

Hideaki Fujita ab, Tsuyoshi Esaki c, Tsutomu Masujima c, Akitsu Hotta de, Soo Hyeon Kim f, Hiroyuki Noji f and Tomonobu M. Watanabe *abeg
aImmunology Frontier Research Center, Osaka University, 1-3 Yamadaoka, Suita-shi, OSAKA, Japan
bLaboratory for Comprehensive Bioimaging, Quantitative Biology Center, RIKEN, 6-2-3 Furuedai, Suita-shi, OSAKA, Japan. E-mail: tomowatanabe@riken.jp; Fax: +81-6-6849-4425; Tel: +81-6-6849-4426
cLaboratory for single cell mass spectrometry, Quantitative Biology Center, RIKEN, 6-2-3 Furuedai, Suita-shi, OSAKA, Japan
dCentar for iPS Cell Research and Application, Kyoto University, 53 Kawahara-cho, Shogoin, Sakyo-ku, Kyoto, Japan
ePRESTO, Japan Science and Technology Agency, 4-1-8 Honcho Kawaguchi, Saitama, Japan
fDepartment of Applied Chemistry, School of Engineering, The University of Tokyo, 7-3-1 Hongo, Bunkyo-ku, Tokyo 113-8654, Japan
gGraduate School of Frontier Bioscience, Osaka University, 1-3 Yamadaoka, Suita, Osaka 565-0871, Japan

Received 9th October 2014 , Accepted 29th January 2015

First published on 30th January 2015


Abstract

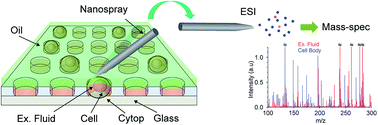
Secretomics, the comprehensive study of cell releasates, offers a non-invasive approach to understanding cell heterogeneity. We here propose single cell small molecule secretomics using micro-droplet arrays and mass spectrometry as a new repertoire of omics technologies. The present method revealed the heterogeneity of secreted small molecules from individual single cells without the use of any invasive processes.


“Omics”, such as genomics, proteomics, and metabolomics, have provided a comprehensive image of the function, structure and dynamics of biological elements.1 The majority of omics technologies focus on the cells' interior.1,2 However, more recently, strong interest has grown in secretomics, which examines the materials secreted by a cell, tissue, or organism, such as cytokines, chemokines, and growth factors.3–5 Because releasates are necessary for long-range signaling between cells, for example, in immune responses,6,7 secretomics is expected to become a powerful tool for not only basic sciences but also medical application such as drug discovery.3–5 However, because the releasates rapidly diffuse in the culture medium, their concentration becomes very sparse and difficult to detect. Ingenuities to capture the releasates, such as using trichloroacetic acid precipitation3 or antibody microarrays,8 can resolve this problem but can only analyze limited types of releasates. As a result, current secretomics are restricted to peptides and do not effectively consider other key molecules such as metabolites.

As technologies for omics, including secretomics, are now directing towards single cell sensitivity, better understanding of the heterogeneity observed between cell states is being achieved.9,10 We previously succeeded in comprehensively measuring metabolites from a single living cell and an organelle in the cell using electrospray ionization (ESI) mass spectrometry by developing nanospray technology, which is now called single cell mass spectrometry.11,12 Here we describe a simple and rapid method for performing single cell secretomics.

The isolation of a single cell in a micro-well/droplet prevents the diffusion of the releasates.13,14 For our aim, the micro-well that capsules the cell must be opened, but at the same time an open chamber cannot isolate individual cells. To solve this dilemma, we applied the micro-droplet array device, which is composed of a hydrophilic substrate and hydrophobic layer.15 Several micro-devices utilizing droplet-array in mass spectroscopy has been developed previously,16,17 but the device capable of analyzing releasates from a single cell has not been reported to date. Micro-wells with a diameter of 10–40 µm were arranged as an array on the hydrophobic layer so that the hydrophilic glass layer was exposed at the bottom of the well (ESI Fig. S1a). Setting the diameter of the micro-well a little larger than the target cell avoids the trapping of two or more cells when the medium, which includes the cells, is loaded onto the device (ESI Fig. S1a). Covering the device with an oil layer perfectly isolated the individual cells within micro-droplets (Fig. 1a and b and ESI S1a). The releasates from these cells, other than lipophilic substances, are trapped in the small interspaces between the cell and micro-well which do not diffuse out due to the oil. The extracellular fluid in the small interspace was collected with a metal-coated glass capillary micro-needle without any damage to the cell, and the collected sample was applied to a mass spectrometer (Fig. 1c). To assess the cytotoxicity of the oil, NIH3T3 cells were exposed to the oil for 2–4 h. No significant change in cell morphology nor viability was observed (ESI Fig. S2).


image file: c4ra12021c-f1.tif
Fig. 1 Single cell metabolic secretomics by micro-well array and mass spectrometry. (a) Schematic illustration of the experimental setup (upper) and geometry of the micro-well array obtained with a laser microscope (lower). (b) Photograph of the micro-well array trapping individual cells. (c) Phase contrast image of a PC12 cell inside a micro-droplet and the glass micro-needle used for sample collection. (d) Fluorescent confocal image of micro-droplets in micro-wells of 10 µm (left), 15 µm (middle) and 20 µm (right) without (upper) and with (lower) a 10 µm bead. (e) Estimated volume of a micro-droplet without (red) and with (blue) a 10 µm bead. (f) Typical mass spectrum from the buffer surrounding a cell (red) and single cell body (blue). (g) Detected peak corresponding to m/z = 184.0966 in the extracellular fluid of a PC12 cell identified as epinephrine. (h) Amount of tyrosine, dopa, dopamine and epinephrine released from single undifferentiated (red and blue) and differentiated PC12 cell (yellow and green) with (blue and green) and without (red and yellow) KCl. The intensities were normalized to tyrosine labeled with a stable isotope (14N) added in the ionization solution.

Before trapping the actual cells, we confirmed the shape of the micro-droplets with 10 µm polystyrene beads and fluorescent dyes (Fig. 1d). One droplet covered the whole bead to form a dome-like shape even when the diameter of the bead was larger than the depth of the micro-well. The volume of the droplet depended on the diameter of the micro-well. Fig. 1e shows the volume to be ∼300 femto liter with a 10 µm bead on a 10 µm micro-well. The interspace between the cell and the micro-well, which was a few microns in width, was too narrow to enable collection of its solution with a current glass capillary. Collection in such tiny volumes requires nanospray technology.11,12

We individually trapped PC12 pheochromocytoma cells18 in micro-wells of 20 µm in diameter and 5 µm in depth (Fig. 1b), collected the solutions from both the inside and outside of the cells with a nanospray tip (Fig. 1c), added ionization solvent that was 80% methanol containing 0.1% formic acid into the needle, and applied the collected solution to an LTQ-Orbitrap mass spectrometer by ESI. The mass spectra of the cytosol and the extracellular fluid could be respectively obtained without killing the cell (Fig. 1f). There were large peaks in the mass spectrum derived from the medium composition. However, meaningful data came from the smaller peaks that were absent in the micro-droplets that lacked cells. Approximately 4700 peaks were detected from the extracellular fluid (Fig. 1f, red), including 154 possible candidates as metabolites by KEGG (Kyoto Encyclopedia of Genes and Genomes) database matching (ESI Table S1). More peaks were detected from the cell body (Fig. 1f, blue). To prove these peaks were derived from cell secretions, we successfully detected the secretion of epinephrine from a PC12 cell that was differentiated into a nerve cell by nerve growth factor (NGF) induction (Fig. 1g). Moreover, we confirmed the secretions of not only epinephrine but also dopa and dopamine from the differentiated PC12 cell by KCl induced depolarization (Fig. 1h). Thus, the combination of the micro-droplet device and nanospray technology enabled comprehensive measurement of small molecule releasates at the single cell level.

We did the same procedure using 10 µm diameter micro-wells with smaller cells, T-cells and B-cells, whose sizes were ∼6 µm (Fig. 2a and b and ESI S3). Approximately 1400 peaks including 332 possible metabolites were detected in the T-cell releasate (ESI Table S2). Some of these peaks increased with time (Fig. 2c), and the concentration of the substrate depended on the diameter of the micro-well (Fig. 2d), indicating that the substances were secreted from a single cell. Most of the cells trapped in micro-well were alive for 30 min, however, cell death was observed when cells were trapped for more than 1 h, possibly from lack of oxygen and nutrition (ESI Fig. S4). The candidate molecules at peaks 139.074 (Fig. 2c) and 229.216 (Fig. 2d) were hexanoic acid and tetradecanoic acid, respectively, which are compounds found in the lipid membrane, being not conflicting with the recent finding that the T-cell releases the synaptic vesicle.19 Thus, we could measure the small molecule releasates in a time-dependent manner, and the sensitivity depended on the ratio of the diameters of the cell and the micro-well.


image file: c4ra12021c-f2.tif
Fig. 2 Single cell metabolic secretomics of T-cells and B-Cells. (a and b) Typical examples of mass spectra of releasates from 3 T-cells (a) and B-cells (b), respectively. (c) The detected peak corresponding to m/z = 139.074, which possibly represents hexanoic acid, 30 min (orange) and 1 hour (red) after the cell was trapped inside the micro-droplet. The yellow line shows a sample collected without any cells. (d) Concentration of substance corresponding to m/z = 229.216, which possibly represents tetradecanoic acid, 1 hour after cells were trapped with micro-wells of different diameters. (e) Two dimensional visualization of DAPC results against T-cells (purple), B-cells (blue), and micro-wells without cells (black). (f) Examples of mass spectrum from two T-cells indicated by ‘1’ (red) and ‘2’ (blue) in (e).

The ‘single cell’ sensitivity is now desired for the investigation of heterogeneity in omics technologies. We were also able to investigate secretory heterogeneity in T-cells and B-cells (Fig. 2a and b and ESI S5). The comprehensive data is generally used to discriminate cell state/type with the combination with principal component analysis.20 We applied discriminant analysis of principal components (DAPC) for the mass spectra of the T-cells and B-cells and found that the same cell type is clustered in the same region of the score plot with a certain degree of distribution (Fig. 2e). When two T-cells were compared (Fig. 2f(1) and (2)), we found significant differences in the substances they secreted, even though the two cells were of the same type and from the same mouse. This result clearly shows that cell heterogeneity is represented in the cellular small molecule releasate, and our protocol is well suited for studying the variance between individual cells. Although current omics technologies can also detect heterogeneity,9,10 our method distinguishes itself by being non-invasive, since the sampling was made from outside of the cell.

Thus, we established single cell secretomics by combining micro-droplets technology and single cell mass spectrometry. Other attempts have also been made for single cell secretomics. Matrix-assisted laser desorption ionization (MALDI) mass spectroscopy has achieved high-sensitivity for the detection of secreted peptides from a single cell in a nano-liter solution, though the throughput was quite low because of the cumbersome procedure.21 Though combining MALDI mass spectrometry with microfluidic technology successfully detected peptides secreted from a single cell, the number of measured cells was limited because of the structure of the device.22 Moreover, ours is the only method to have reported heterogeneity in the releasates. In this study, we utilized off-line method for proof of our concept, but combining with other method to enable on-line screening will increase the usability of our system.23

Perhaps most appealing point about our method is that it is non-invasive. Currently, we are applying our method to examine reprogrammed induced-pluripotent stem cells (full-iPS cells) and partially reprogrammed stem cells (partial iPS cells)24 to determine differences based on secretion patterns at the single cell level (ESI Fig. S6). Though there is seemingly no difference among the spectra of the two cell types, critical differences were seen in small peaks, i.e., at 185.1193 m/z (Fig. S6a, orange area and S6b). A DAPC score plot made the difference clearer (Fig. S6c). While further experiments are needed to understand the relationship between the secreted small molecules and the pluripotent states, this result indicates that the present method is applicable for their discrimination non-invasively.

Conclusions

Single cell secretomics that combines the micro-droplet array and nanospray technology offers great promise as non-invasive single cellular omics technology.

Acknowledgements

We are grateful to Peter Karagiannis (QBiC) and Tomoyuki Yamaguchi (iFReC, Osaka Univ.) for critical reading of the manuscript, and Kazuki Matsuda for technical assistance. This work was supported by JSPS KAKENHI no. 24570191 (H.F.) and Japan Science and Technology Agency (JST) PRESTO program (T.W. and A.H.).

Notes and references

  1. R. P. Horgan and L. C. Kenny, ‘Omic’ technologies: genomics, transcriptomics, proteomics and metabolomics, The Obstetrician & Gynaecologist, 2011, 13, 189–195 Search PubMed.
  2. C. Russell, A. Rahman and A. R. Mohammed, Application of genomics, proteomics and metabolomics in drug discovery, development and clinic, Ther. Delivery, 2013, 4(3), 395–413 CrossRef CAS PubMed.
  3. M. Makridakis and A. Vlahou, Secretome proteomics for discovery of cancer biomarkers, J. Proteomics, 2010, 73(12), 2291–2305 CrossRef CAS PubMed.
  4. J. H. Yoon, et al., Secretomics for skeletal muscle cells: a discovery of novel regulators?, Adv. Biol. Regul., 2012, 52(2), 340–350 CrossRef CAS PubMed.
  5. M. Stastna and J. E. Van Eyk, Secreted proteins as a fundamental source for biomarker discovery, Proteomics, 2012, 12(4–5), 722–735 CrossRef CAS PubMed.
  6. L. C. Borish and J. W. Steinke, 2. Cytokines and chemokines, J. Allergy Clin. Immunol., 2003, 111(suppl. 2), S460–S475 CrossRef CAS.
  7. K. Franciszkiewicz, A. Boissonnas, M. Boutet, C. Combadiere and F. Mami-Chouaib, Role of chemokines and chemokine receptors in shaping the effector phase of the antitumor immune response, Cancer Res., 2012, 72(24), 6325–6332 CrossRef CAS PubMed.
  8. S. A. Mustafa, J. D. Hoheisel and M. S. Alhamdani, Secretome profiling with antibody microarrays, Mol. BioSyst., 2011, 7(6), 1795–1801 RSC.
  9. D. Wang and S. Bodovitz, Single cell analysis: the new frontier in ‘omics’, Trends Biotechnol., 2010, 28(6), 281–290 CrossRef CAS PubMed.
  10. F. S. Fritzsch, C. Dusny, O. Frick and A. Schmid, Single-cell analysis in biotechnology, systems biology, and biocatalysis, Annu. Rev. Chem. Biomol. Eng., 2012, 3, 129–155 CrossRef CAS PubMed.
  11. H. Mizuno, N. Tsuyama, T. Harada and T. Masujima, Live single-cell video-mass spectrometry for cellular and subcellular molecular detection and cell classification, J. Mass Spectrom., 2008, 43(12), 1692–1700 CrossRef CAS PubMed.
  12. T. Masujima, Live single-cell mass spectrometry, Anal. Sci., 2009, 25(8), 953–960 CrossRef CAS.
  13. A. Jin, et al., A rapid and efficient single-cell manipulation method for screening antigen-specific antibody-secreting cells from human peripheral blood, Nat. Med., 2009, 15(9), 1088–1092 CrossRef CAS PubMed.
  14. M. Najah, et al., Droplet-based microfluidics platform for ultra-high-throughput bioprospecting of cellulolytic microorganisms, Chem. Biol., 2014, 21(12), 1722–1732 CrossRef CAS PubMed.
  15. S. H. Kim, et al., Large-scale femtoliter droplet array for digital counting of single biomolecules, Lab Chip, 2012, 12(23), 4986–4991 RSC.
  16. N. Gasilova, Q. Yu, L. Qiao and H. H. Girault, On-chip spyhole mass spectrometry for droplet-based microfluidics, Angew. Chem., Int. Ed. Engl., 2014, 53(17), 4408–4412 CrossRef CAS PubMed.
  17. S. K. Kuster, et al., Interfacing droplet microfluidics with matrix-assisted laser desorption/ionization mass spectrometry: label-free content analysis of single droplets, Anal. Chem., 2013, 85(3), 1285–1289 CrossRef CAS PubMed.
  18. L. A. Greene and A. S. Tischler, Establishment of a noradrenergic clonal line of rat adrenal pheochromocytoma cells which respond to nerve growth factor, Proc. Natl. Acad. Sci. U. S. A., 1976, 73(7), 2424–2428 CrossRef CAS.
  19. K. Choudhuri, et al., Polarized release of T-cell-receptor-enriched microvesicles at the immunological synapse, Nature, 2014, 507(7490), 118–123 CrossRef CAS PubMed.
  20. L. N. Gastinel, Principal Component Analysis in the Era of “Omics” Data, in Principal Component Analysis – Multidisciplinary Applications, ed. Parinya Sanguansat, InTech, 2012, pp. 21–42 Search PubMed.
  21. R. M. Whittal, B. O. Keller and L. Li, Nanoliter chemistry combined with mass spectrometry for peptide mapping of proteins from single mammalian cell lysates, Anal. Chem., 1998, 70(24), 5344–5347 CrossRef CAS.
  22. K. Jo, et al., Mass spectrometric imaging of peptide release from neuronal cells within microfluidic devices, Lab Chip, 2007, 7(11), 1454–1460 RSC.
  23. Y. Su, Y. Zhu and Q. Fang, A multifunctional microfluidic droplet-array chip for analysis by electrospray ionization mass spectrometry, Lab Chip, 2013, 13(10), 1876–1882 RSC.
  24. A. Hotta, et al., Isolation of human iPS cells using EOS lentiviral vectors to select for pluripotency, Nat. Methods, 2009, 6(5), 370–376 CrossRef CAS PubMed.

Footnote

Electronic supplementary information (ESI) available. See DOI: 10.1039/c4ra12021c

This journal is © The Royal Society of Chemistry 2015
Click here to see how this site uses Cookies. View our privacy policy here.