UV-patternable nanocomposite containing CdSe and PbS quantum dots as miniaturized luminescent chemo-sensors†
Pedro J. Rodríguez-Cantó*ab,
Rafael Abarguesa,
Henry Gordillob,
Isaac Suárezb,
Vladimir Chirvonyb,
Sandra Alberta and
Juan Martínez-Pastorb
aIntenanomat S.L., C/Catedrático José Beltrán 2, 46980 Paterna, Spain. E-mail: pedro.j.rodriguez@uv.es
bInstituto de Ciencia de los Materiales, Universidad de Valencia, P.O. Box 22085, 46071 Valencia, Spain
First published on 23rd January 2015
Abstract
In this study, a novel multifunctional hybrid polymer-based luminescent material, particularly formulated for photolithography, was developed, fabricated and tested as a miniaturized chemosensor. This nanocomposites were formulated with either luminescent CdSe (for the visible) or PbS (for the near-IR) colloidal QDs embedded in a polyisoprene-based photoresist (PIP). We checked the sensing capability of the nanocomposite by exposing 1 cm2 CdSe nanocomposite patterns to vapours of some analyte solutions such as 2-mercaptoethanol (MET) and ethylenediamine (EDA). The transduction mechanism of the sensor is based on changes of the QD photoluminescence (PL) when molecules are adsorbed on the QD surface. Because the polymer used suffered from swelling during the developmental step of the sensor fabrication, the diffusion of the analytes through the matrix was rather high. As a result, the sensor response to the analyte–QD interactions was considerably short and sensitive. We observed shorter sensor response times for MET than EDA. Moreover, we found a limit of detection of MET and EDA of 0.1 pg and 15 ng, respectively. The linear detection range for MET and EDA was determined to be over an analyte concentration of 6 and 5 orders of magnitude, respectively. We also tested the PbS-based nanocomposite response to MET and EDA and found very different responses. Although EDA quenched the PbS PL, exposure to MET molecules resulted in a 6.5-fold enhancement of the PL. The mechanisms of the observed effects are discussed in detail.
Introduction
The role of nanoscience in analytical science has been greatly established for the development of (bio)chemical sensors with enhanced performance. The design of low-cost, easy-to-fabricate and portable analytical devices with a low limit of detection (LOD), good selectivity, high sensitivity and short response time are in high demand.1–3 Part of that has been made possible by the use of nanomaterials. In particular, (bio)chemical sensors based on fluorescent quantum dots (QDs) have attracted intense interest because of their excellent optical and electronic properties compared to the routinely employed fluorescent organic dyes.4,5 These properties include size-tunable light emission over a wide range of energies, high photoluminescence quantum yield (PL QY), narrow emission line width, and good solution processability.6 In addition, the physicochemical stability of QDs, their extremely large surface area, as well as the possibility of functionalizating their surface by conjugation with appropriate molecules makes them very attractive nanomaterials for ultrasensitive sensors with the possibility of multiplex (bio)chemical detection.7The transduction mechanism of QD-based sensors is based on the changes of the PL QY by the physicochemical interactions occurring at the QD surface. Because the PL of QDs is strongly affected by surface defects that can affect the recombination of electrons and holes, analyte binding on the QD may lead to either the quenching or enhancement of the PL.5,8
A challenging step towards the development of QD-based (bio)chemical sensors is to efficiently transfer colloidal QDs to solid-state support structures, preserving as far as possible all their optical properties.9,10 In this context, some approaches to solid-state QD sensors have been recently reported. The most common approach to a QD sensor consists of depositing colloidal QDs from solution onto a substrate to form a film by different desposition techniques (dropcasting, spin-coating or doctor blading). Bakar et al. developed a sensor based on ZnCdSe fabricated by dropcasting for sensing pesticide molecules.11 It was observed that the PL intensity of the films was quenched by the presence of the pesticide molecules adsorbed on the QD surface. Other authors used a similar approach to develop PL temperature sensors with high sensitivities and resolution.12,13 Nevertheless, all these sensors based on QD-solids often exhibit very soft films with poor mechanical properties and low stability in hot or oxygenated environments leading to the formation of trap states, QD oxidation, and the subsequent deterioration of the QD lattice.
To overcome these drawbacks, a very promising approach towards QD-based sensors with high sensitivity, high stability as well as low cost consists of embedding the luminescent QDs into polymeric matrices to form a nanocomposite. This type of hybrid material has drawn significant attention from researchers over the last decade.14,15 Here, the incorporation of QDs into a host polymer matrix resulted in the design of novel nanocomposite materials with a combination of the properties of the constituent materials and even new ones.16 Moreover, the fact that the QD surface could be optimally modified by appropriate ligands allows it to obtain the optimal dispersion of the QDs inside the polymeric matrix, which is one of the key points to achieve high transparency and high luminescence efficiency required for this type of QD-based material.17 Polymers are ideal host materials for device fabrication because they show a very broad range of properties such as flexibility, lightweight, low cost and can be processed as a thin film. One of the major trends in the area of (bio)chemical sensors is directed towards their miniaturization.18 This is a critical aspect to obtain higher sensitivity, lower limit of detection, and faster binding rates19 and helps to develop lab-on-chip systems. The use of polymeric host matrices having lithographic capability provides the possibility of device fabrication and miniaturization by means of conventional patterning techniques such as electron beam lithography or photolithography.16,20,21
Some approaches to (bio)chemical sensors based on QD-based nanocomposites have been recently published. For instance, Potyrailo and co-workers investigated the response of different-size CdSe QDs incorporated in a variety of polymer matrices to vapours of several organic solvents with different polarity.22 In addition, other authors have also proposed the use of CdSe QDs with different surface functional groups embedded in polymethylmethacrylate (PMMA)23 to sense volatile compounds such as amines,24 aromatic hydrocarbons,25,26 or ethanol27 as a proof of concept. However, the potential patterning capability of these QD-based nanocomposite sensors has not been explored yet, which is the first step towards miniaturization and device fabrication. Only some QD-nanocomposite approaches show the possibility of miniaturization by conventional and large scale patterning methods;28,29 however, to the best of our knowledge, the application of such QD-based patterns for sensing has not been reported previously.
In this work, we have developed a novel multifunctional hybrid polymer-based luminescent material particularly formulated for photolithography and tested it as a miniaturized chemosensor. This nanocomposite was formulated with either luminescent CdSe (for the visible) or PbS (for the near-IR) colloidal QDs embedded in a polyisoprene-based photoresist (PIP). The resulting nanocomposite combined the extraordinary optical properties of the QDs with the lithographic characteristics of the resist matrix. Both the optical properties of QDs and the lithographic performance of the photoresist were preserved after the incorporation of QDs into the photoresist. We checked the sensing capability of this QD–PIP nanocomposite using 1 cm2 square patterns as a disposable gas sensor by monitoring the PL intensity upon exposure to 2-mercaptoethanol (MET) and ethylenediamine (EDA) using two types of QDs: CdSe and PbS. The transduction mechanism of the sensor is based on the changes of the QD photoluminescence (PL) when molecules are adsorbed onto the QD surface. The CdSe–PIP pattern sensor showed a decay of PL when exposed to different amounts of MET and EDA in vapour and found LOD values around 10−3 ng L−1 and 125 ng L−1, respectively. From the calibration curve, we determined that the binding affinity of MET to CdSe–PIP is around four orders of magnitude higher than that of EDA. We also observed a linear sensing behaviour within a broad concentration range, which allows us to use CdSe–PIP as quantitative sensor for MET and EDA.
Furthermore, the PbS–PIP nanocomposite showed different sensor responses depending on the target analyte, whereas the exposure of PbS–PIP sensor to EDA led to the quenching of the QD PL, and exposure to MET molecules resulted in a 6.5-fold enhancement of the PL intensity. The different responses of CdSe and PbS QDs to MET can be explained by the difference in the energy of these QDs valence band top with respect to the redox level of the thiol molecule.
In conclusion, these results demonstrate that a completely disposable sensing platform technology can be developed using this novel QD–PIP luminescent nanocomposite, which may also form the basis for the development of miniaturized chemo-sensors, which may be of interest for several fields such as the food industry, environmental monitoring, and health.
Experimental
Materials and apparatus
A commercially available negative bisazide–cyclized polyisoprene photoresist, o-xylene, 2-mercaptoethanol (MET) and ethylenediamine (EDA) were purchased from Aldrich and used without further purification. Cadmium oxide powder (CdO), lead oxide powder (PbO), trioctylphosphine (TOP), bis(trimethylsilylsulfide) (TMS), selenium powder, octadecene (ODE), oleic acid (OA), anhydrous toluene, acetone and methanol were also purchased from Sigma-Aldrich.Synthesis of CdSe QDs
Highly luminescent CdSe QDs were synthesized by a conventional synthesis route based on a hot injection method.30 Briefly, a mixture of CdO (5 mmol), oleic acid (30 mmol), and ODE was heated and distilled in vacuum at 120 °C for 30 minutes. Subsequently, this mixture was heated up to 250 °C for the complete dissolution of precursors under N2. Then, the transparent solution of Se (3.2 mmol) and TOP (16 mmol) was injected swiftly at 250 °C and reacted for 5 min. Finally, the QDs were purified by several successive precipitation and redispersion steps with a mixture of acetone and methanol and redispersed in o-xylene with a concentration of 20 mg mL−1.Synthesis of PbS QDs
For the synthesis of PbS colloidal QDs, the lead precursor was prepared by pumping the mixture of PbO (4 mmol) and oleic acid (63 mmol) in ODE in vacuum at 120 °C for 30 minutes to remove water. The stock solution of the sulfur precursor was prepared by mixing TMS (1 mmol) in ODE (10 mL) and injecting rapidly into the reaction flask containing the lead precursor at 160 °C. The resulting PbS QDs were purified by three successive precipitation and redispersion steps using acetone and toluene, respectively. Finally, the QDs were dispersed in o-xylene with a concentration of 20 mg mL−1.QD–PIP nanocomposite preparation and device fabrication
Nanocomposites were prepared by the dispersion of the oleate-capped QDs in the photoresist, both dissolved in o-xylene. We formulated different nanocomposite solutions by varying the amounts of both QD and photoresist and adding the corresponding volume of solvent to obtain the same thickness. The resulting nanocomposite solution was mixed under stirring for 15 min to obtain a homogeneous dispersion. Prior to the fabrication process, the BK7 glasses used as substrates were rinsed with isopropanol and baked at 120 °C for 20 min. Then, the films were prepared by spin-coating the nanocomposite solution on the substrate at 2000 rpm for 30 s. In order to achieve good adhesion of the nanocomposite to the substrate, the films were soft-baked at 82 °C for 20 min to remove the residual solvent and volatile components. The resulting films were about 1 μm thick. The samples were then exposed to UV light at 200 mW cm−2 for 5 s in a Süss Microtec MJB4 mask aligner using a photomask consisting of features with different shapes and sizes. Afterwards, the development of the structures was performed by spraying the developer onto the samples for 10–20 s followed by rinsing several times with isopropyl alcohol and drying with compressed air. Finally, a hard-bake at 120 °C for 10 min was carried out to remove residual solvents and to enhance the chemical stability of the layer.Characterization techniques
Optical absorbance spectra of the nanocomposite films containing CdSe QDs were recorded at room temperature using an ultraviolet-visible Perkin-Elmer Lambda 20 spectrophotometer. In the case of PbS QDs, the absorbance spectra of both the colloidal solution as well as the nanocomposite films were measured with the aid of an IR Ocean Optics spectrometer. Photoluminescence spectra were obtained at room temperature and under air upon the excitation of samples with a CW GaN laser (404 nm) or DSPP diode laser (533 nm). In both cases, the excitation power was fixed to be around 15 kW cm−2. The quantum yield of PL for CdSe QDs was determined using an integrated sphere (Hamamatsu model C9920-0). Transmission electron microscopy (TEM) studies of the QDs were carried out at an accelerating voltage of 100 kV using a JEOL 1010 microscope.Analyte sensing protocol
The sensing capability of the QD–PIP nanocomposites was evaluated using 1 cm2 square patterns. These patterns were exposed to the vapours of 9 mL of different aqueous solution concentrations of MET and EDA in a closed 130 mL vessel in a thermostatic bath at 25 °C. Each spectrum was registered for different times once the liquid–vapour equilibrium was restored after closing the vessel. We used a positioning system that enables the measurement in the same position of the nanocomposite pattern. Thus, accurate and representative values of PL intensity could be obtained.Results and discussion
Optical properties of the QD–PIP nanocomposite
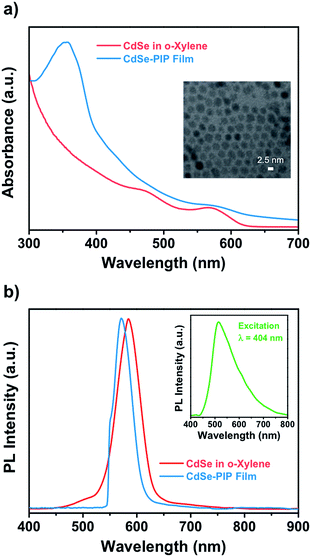
This work aims at the development of a novel QD–polymer hybrid material that combines the extraordinary optical properties of the QDs with the lithographic characteristics of the chosen host matrix. After proper formulation of the nanocomposite, we first examined the optical absorption and emission properties of the QD colloidal solution, the photoresist, and the nanocomposite thin film. The optical properties of QDs strongly depend on both their size and composition. Fig. 1 shows absorption spectra of colloidal CdSe QDs in o-xylene and in the nanocomposite. The absorption peak at 572 nm observed for the colloidal suspension corresponds to the lowest energy exciton state of the CdSe QDs, whereas a second exciton state is observed around 475 nm. The absorbance of the colloidal CdSe QDs increases continuously to shorter wavelengths and is negligible beyond 630 nm. The average size of the CdSe QDs, determined by transmission electron microscopy, was about 2.5 nm (Fig. S3, ESI†). This experimental value is in good agreement with that determined on the basis of the energy of the CdSe exciton with use of well-known empirical formulas.31,32When CdSe QDs are embedded into the photoresist, the exciton peak appears at the same wavelength as it does in solution (the CdSe QD peak is visible in the composite absorption spectrum as a weak shoulder because the QDs concentration in the polymer was considerably lower than in the solution). This indicates that the diameter and size distribution of CdSe QDs remained unchanged during the entire fabrication process. The nanocomposite absorption band centered at 355 nm belongs to the bisazide photoactive compound of the negative photoresist (Fig. S1, ESI†). Typically, the polyisoprene-based photoresist formulation consisted of a 9.7 wt% of cyclized polyisoprene and 0.3 wt% of bisazide photoactive compound in o-xylene. Upon exposure to light, the photosensitive molecules strongly absorb the UV (320–380 nm) light and undergo several photoreactions to crosslink the polymer chain.
Fig. 1b shows the emission spectra of the colloidal CdSe QDs in o-xylene solution and in the nanocomposite thin film measured upon excitation at 532 nm to avoid the excitation of the photoresist. The emission of the photoresist was also measured upon excitation at 404 nm and is shown in the inset in Fig. 1b as a very broad emission with a maximum at around 515 nm (Fig. S2, ESI†). The emission band of colloidal CdSe in solution has a maximum around 586 nm with a 43 nm FWHM. The PL QY was 30%. The narrow FWHM of the fluorescence spectra and the reasonably high QY achieved indicate the absence of surface traps due to a good passivation of the QD surface by means of oleate ligands. This is an important point because surface defects on QDs usually result in a significant decrease in their fluorescence QY. When QDs were embedded into the photoresist, the emission was blue shifted to 570 nm with a FWHM of 41 nm. The blue shift is most probably a result of the decrease of refractive index effective value in the QDs environment due to the porous character of the polymer matrix. Therefore, the emission spectrum of the nanocomposite has a shape similar to the QDs spectrum obtained in solution indicating that the QDs embedded into the resist matrix were well dispersed without aggregation.
To demonstrate the wide capabilities of the nanocomposite, the photoresist was also formulated with near-infrared luminescent QDs from the IV to VI groups, PbS. Because these QDs are also capped with oleate, they show good solubility in o-xylene and can be easily dispersed into the photoresist. Fig. 2a shows the TEM image (inset) and optical properties of colloidal PbS QDs used for fabrication of the PbS–PIP nanocomposite. From the TEM images we observe spherical PbS QDs with a mean diameter of 3.2 nm (Fig. S4, ESI†). Colloidal PbS QDs in o-xylene showed a well-defined excitonic peak in absorption centred at 960 nm and an emission band with a maximum at 1050 nm (Fig. 3b). For the PbS-based nanocomposite, the excitonic peak maximum was also located at 960 nm, whereas the PL band maximum was at 1000 nm. The characterization of the absorption of the PbS QDs in the nanocomposite could not be clearly recorded because of the low QD concentration in the PIP matrix and the low sensitivity of the InGaAs photodetector used in the setup.
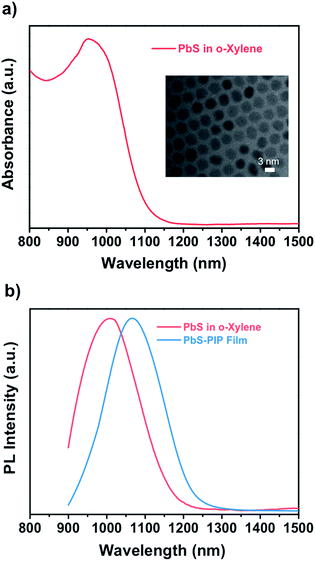 | ||
| Fig. 2 (a) Absorbance of PbS QDs in o-xylene. Inset: TEM image of PbS QDs with an average size of 3.2 nm. (b) Emission of PbS QDs in o-xylene and in the nanocomposite film upon excitation at 532 nm. | ||
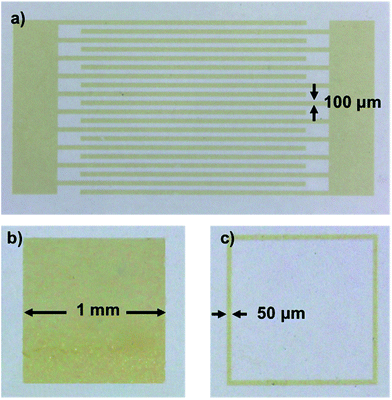 | ||
| Fig. 3 Optical microscope pictures of different CdSe–PIP nanocomposite structures on glass patterned by UV lithography: (a) interdigitates, (b) solid square, and (c) framework. | ||
Lithographic properties of the QD–PIP nanocomposite – sensor fabrication
The design of novel multicomponent materials that combine the unique optical properties of semiconducting nanoparticles with those provided by the polymer matrix is of significant importance for the development of photonic nanostructures and more complex devices. In this sense, the successful miniaturization and application of this type of nanocomposites critically depends on their capability of being patterned by means of lithographic or other printing techniques.33 In this work, bisazide–cyclized polyisoprene photoresist has been chosen as host matrix because it is a commercially available negative-tone resist formulated for UV lithography. Compared to their positive counterparts, negative resists have higher sensitivity, better adhesion to substrates and are normally used for the fabrication of patterns above 1 μm. Moreover, this type of negative tone photoresists suffers from swelling caused by the use of solvent-based developers such as xylene or anisole. The lateral swelling results in a type of proximity effect, which can give rise to image distortions, and vertical swelling does not affect the image accuracy and may significantly facilitate the diffusion of the analytes through the matrix. As a result, the time of sensing response to analyte–QDs interactions could be considerably reduced.The fabrication of a chemo-sensor based on this novel nanocomposite has been carried out by conventional UV lithography. The lithographic properties of the bisazide–cyclized polyisoprene photoresist are based on the crosslinking of cyclized poly(cis)isoprene by means of a bisazide-based photo active crosslinker. Upon exposure to 300–400 nm UV light, the bisazide sensitizers decompose into nitrogen and highly reactive chemical intermediates, called nitrenes. These nitrenes do react actively with the cyclized polyisoprene to mainly form an aziridine ring. As a result, the polymer chains crosslink and three-dimensional structures are generated because the exposed areas are insoluble in the developer. The cyclized polymer has a high glass transition temperature, good structural properties, higher density and is formulated with o-xylene as a solvent.
Once the colloidal QDs are dispersed in o-xylene and mixed with the photoresist solution in o-xylene under mechanical stirring, the solution was then spin-coated onto a glass substrate at 2000 rpm for 30 s. In order to remove residual solvent and volatile components and to improve the adhesion, a bake at 82 °C for 20 minutes was carried out to form a 1 μm-thick film. The resulting nanocomposite film was then exposed to UV light at 200 mW cm−2 for 5 s using a test mask containing different patterns. For the development of the unexposed areas, the developer was sprayed on the coated substrate for 10–20 s followed by rinsing several times with isopropanol alcohol and blowing with air to dry the film. Finally, a hard-bake at 120 °C for 10 min was required to remove residual solvents and to enhance the chemical stability of the layer. The concentration of QDs into the nanocomposite was the key parameter to optimize for a successful formulation of the photoresist for two different reasons. First, the lithographic performance of the photoresist may be eventually affected by the presence of QDs, particularly at high concentrations. For instance, because QDs absorb strongly in the UV, a high QD concentration could disturb the UV absorption and photoreactions carried out by the photoactive compound (PAC) upon exposure, which would consequently affect the crosslinking degree of polymer chains. Second, the PL efficiency of QDs embedded into resist were strongly affected by the concentration of QDs in the nanocomposite. For a high concentration of QDs, a large part of emitted photons are reabsorbed by the same QDs, decreasing significantly the PL signal.32 This is of special importance for sensing, where a precise quantification of the emission intensity change in response to analyte bindings on the QDs is required. Therefore, the nanocomposite must be properly formulated to preserve as much as possible the lithographic properties of the photoresist and minimize the reabsorption of the luminescence. We formulated different nanocomposites with different QD wt% and the same thickness and recorded the corresponding PL spectra (Fig. S5, ESI†). According to the criteria aforementioned, the optimum nanocomposite formulation was found to be 0.3 wt% CdSe QD and 5.0 wt% bisazide–cyclized PIP in o-xylene, which corresponds to a final nanocomposite composition of 6 wt% CdSe QD and 94 wt% bis azide–cyclized PIP. For this formulation, the ratio of PL intensity to QD wt% reached its maximum value indicating that minimal reabsorption of the luminescence took place (Fig. S6, ESI†).
Fig. 3 shows several patterns of the CdSe–PIP nanocomposite fabricated on glass. We patterned various microstructures (interdigitates, solid squares and frameworks) with different feature sizes from 50 μm to 1 mm to test the lithographic performance of the nanocomposites. As can be observed, this formulation allowed an accurate nanocomposite patterning while preserving the intense PL of QDs. The resulting nanocomposite photoresist showed the same lithographic properties as the commercially available photoresist. PbS-based nanocomposite photoresists were also formulated with the same QD composition and rendered an excellent lithographic performance as in the case of the CdSe-based nanocomposite.
Sensing in the visible range
In this work, we test CdSe and PbS–PIP nanocomposite patterns fabricated by UV-lithography as a suitable platform for miniaturized chemosensors. Because the luminescence of QDs is very sensitive to any change on their surface, eventual chemical or physical interactions between the target analyte and the QD surface may result in noticeable changes in the fluorescence emission parameters such as the peak wavelength, intensity, and/or bandwidth. The QDs used in these studies were capped with oleate because this ligand can be easily exchanged by other molecules or analytes and it allows for a good dispersion of QDs in o-xylene. Based on this fact, we expected that capping exchange of oleate with thiol or amine molecules may induce either the quenching or enhancement of the excitonic emission of the QDs embedded in the polymer matrix.The evaluation of the sensing capability of this nanocomposite was performed by exposing the nanocomposite patterns to vapours from aqueous solutions of two different volatile analytes, 2-mercaptoethanol (MET) and ethylenediamine (EDA), in a closed vessel of 130 mL in a thermostatic bath at 25 °C. A given concentration of analyte was in the vapour phase depending on the vapour pressure of the corresponding analyte once the liquid–vapour equilibrium was reached. This concentration can be estimated by the Raoult's Law assuming that analyte–H2O behaves as an ideal solution.
Both thiols and diamines are well-known chelating ligands for coordination to heavy metals through S and N atoms, respectively, via their lone pairs of electrons.34 By exposing the nanocomposite patterns to the analyte vapours, the molecules can diffuse within the PIP-based matrix until they are adsorbed onto the QD surface exchanging the oleate ligands. It is well known that bisazide–cyclized PIP photoresists suffer from swelling when they are exposed to organic solvents such as o-xylene during the development. Even though this effect may limit the resolution of the final patterns, it may significantly improve the diffusion of the analyte molecules through the matrix. As a result, analyte molecules easily reached even the QDs located at the bottom of the patterns, thus improving the sensitivity and time response of the sensor. The sensing studies were carried out with 1 cm-side square patterns of CdSe–PIP because this size allowed for the use of a conventional optical setup to record the PL spectra.
Fig. 4 shows the PL response of the nanocomposite for different exposure time to the vapours of a 10−4 M solution of MET and EDA. As one can see, the interaction of the thiol and EDA molecules with the CdSe QD surface led to a significant change in the intensity and FWHM of the QD emission. In the case of MET (Fig. 4a), within the first 10 minutes, PL intensity had already decreased to around 50%. Sensor response saturation was achieved after ca. 26 min of exposure showing a PL intensity around 9%. In the case of exposure to EDA vapours (Fig. 4b), we observed a slower quenching of the PL intensity in comparison to MET. Within the first 120 min, the sensor PL decreased to 50% and saturated after ca. 190 min. From Raoult's law, the mass concentration of MET and EDA in the vapour phase from a 10−4 M solution is 5.8 and 58 ng L−1, respectively.
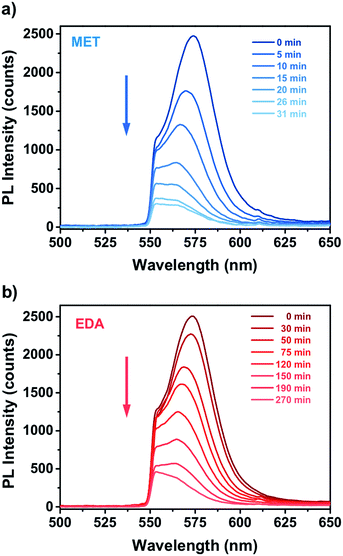 | ||
| Fig. 4 Real time PL response of miniaturized CdSe–PIP sensor upon exposure to the vapour of an aqueous 10−4 M solution of (a) MET and (b) EDA. | ||
The mechanism of PL quenching of QDs is related to the well-known hole-accepting properties of thiols, which can be demonstrated by the low oxidation potential of these molecules. However, although the PL quenching effect can be well described within the dynamic quenching model and can be well predicted on the basis of the thiol oxidation potential and luminescent molecule HOMO energy when thiols interact with small photoexcited luminescent molecules, interactions of thiols with excited QDs is more difficult for a priory predictions of the interaction results. This is because thiol molecules have to be adsorbed on the nanocrystal surface before quenching an exciton localized inside a nanocrystal.35–37 Such an adsorption results in the formation of deep surface states within a band gap of a semiconductor nanocrystal and determines the static type of PL quenching.37,38 Although the energetic position of such surface states is related to the thiol redox potential, it is not equal to the thiol redox potential due to complex interactions between the counterparts of the QD–thiol complex. Therefore, the energy diagrams explaining QD PL quenching by hole acceptor molecules such as thiols are usually tentative.
As an example, we show such a diagram in Fig. 5. The data for the diagram are taken from ref. 35. Indeed, the oxidation potential of MET is higher in energy than the position of the electronic valence band top for CdSe QDs that is the prerequisite for the formation of PL quenching deep surface states, after MET adsorption.
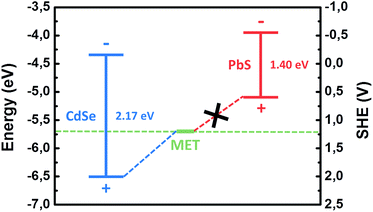 | ||
| Fig. 5 Positions of valence and conduction band-edges of CdSe and PbS QDs with respect to vacuum and SHE in a comparison with the redox potential of MET (adapted from ref. 35). | ||
It is worth noting here that the studies about the influence of EDA and related amines on the PL of CdSe and other QDs is contradictory. A slight PL intensity enhancement was observed for CdSe QDs in water under very low EDA concentrations (2 × 10⁻⁶ M) that was followed by PL quenching under higher EDA concentrations.39 The PL intensity increase was observed for a CdTe QDs water solution under the addition of EDA in mM concentrations.40 Similar features were also found for QD PL quenching by other amines. For example, there are some interesting experiments on the CdSe PL response to n-butylamine (n-BA) depending on the analyte concentrations, whereas the PL intensity enhancement (saturation) is observed when the n-BA concentration increase up to 1 mM,41 and a strong PL quenching is found for n-BA concentrations between 1 and 40 mM.42 What is important here is that the n-BA induced quenching effect cannot be explained by a photoinduced charge transfer reaction, namely, by a hole transfer from excited CdSe QDs to n-BA, because the oxidation potential of n-BA (>1.9 V vs. NHE) is too high to provide electron transfer to the valence band edge of the CdSe QD (around 1.5 V). Therefore, the mechanism(s) of QDs PL quenching by amines under conditions when the concentration of the latter is higher than it is necessary for passivation of the QD surface may be different from photoinduced hole acceptance by amines. There is an opinion in the studies that a universal reason is available for QD PL quenching by electron-donating molecules such as amines. The reason is the appearance of new local sites on a QD surface at the points of coordination of these molecules, which may act as deep traps. Thus, the PL is statically quenched that manifests itself as a PL amplitude decrease without shortening PL lifetime.43,44
Fig. 6 shows the dependence of the CdSe nanocomposite PL intensity upon vapour exposure of EDA, MET and water as well as empirical exponential fitting curves, which describe the diffusion of both target analytes (eqn (1)):
PL = PL∞ + A![[thin space (1/6-em)]](https://www.rsc.org/images/entities/char_2009.gif) exp(−kt) exp(−kt)
| (1) |
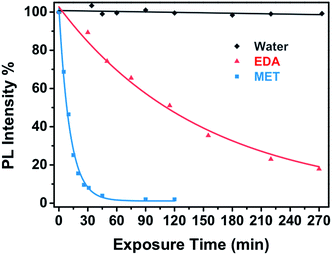 | ||
| Fig. 6 Real time response of a miniaturized CdSe–PIP sensor upon the exposure to a 10−4 M aqueous solution of MET and EDA (and the corresponding fitting curves) and water. | ||
The interaction between the analyte molecules and the CdSe QDs embedded in the polymer matrix is a strongly time-depending phenomenon, which was determined by the analyte mass transport and the subsequent chemical interaction time.45 As aforementioned, this type of polymer matrix suffers from swelling during the development, which causes an enlargement of the inner free volume of the photoresist film. This effect is partially reversible and may facilitate the diffusion of the vapour molecules through the matrix to the QD surface. Therefore, the diffusion of the analytes into the nanocomposite film takes place efficiently, allowing the ligand exchange on the QD surface.
This kinetic constant depends on the affinity reaction between the analyte and the CdSe QD and also on the mass concentration of analyte in the vapour phase. The analyte binding rate constant of MET to CdSe is one order of magnitude higher than that of EDA to CdSe despite the concentration of EDA being also one order of magnitude higher. This is expected because thiol molecules possess a higher affinity to the Cd(II) present on the surface of the QD in comparison to amines. As a result, capping exchange with thiols takes place faster and the PL quenching reaches the maximum value at shorter exposure times and even with lower analyte concentrations.
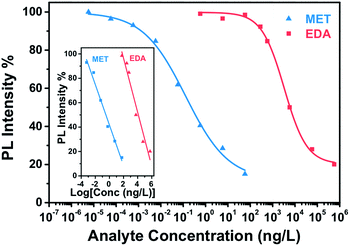
Fig. 7 presents the calibration curve of the sensor for a exposure time of 15 min, that is the sensor response to different analyte amounts of MET and EDA in the vapour phase. In Fig. S7 and S8 (ESI†) the corresponding calibration curves for longer exposure times such as 30 and 60 min are also shown. Calibration curves for analyte binding assays are generally characterized by a sigmoidal relationship between the sensor response and the analyte concentration. The four-parameter logistic (4PL) function was used for fitting the concentration response curves, because it is recognized as the reference standard for immunoassays such as ELISAs or dose–response curves.46 The equation describing the 4 PL function is as follows:47
 | (2) |
As can be observed in Fig. 7, the CdSe–PIP sensor exhibited a limit of detection (LOD) value to MET and EDA around 10−3 ng L−1 and 125 ng L−1, respectively, which is equivalent to an analyte mass of 0.1 pg and 15 ng. In addition, in the Tables S1 and S2 (ESI†) we show that the LOD of the sensor towards MET and EDA improved for longer exposures times. The number of CdSe QDs in a 1 cm2 sensor pattern with a film thickness of 1000 nm is estimated to be around 1014 QDs, assuming a 6 wt% of CdSe, a QD size of 2.5 nm and a cyclized PIP density of 0.99 g cm−3. From the LOD values found for MET and EDA, we estimate that the minimum sensor response was achieved for a ratio of analyte to CdSe QD of around 10−3 and 1.4, respectively. These ratios and therefore the LOD would be easily reduced by just decreasing the size and the film thickness of the sensor for a given exposure time. Evidently at the LOD, the analyte binding occurs on the most superficial QDs where the analyte–CdSe ratio is locally much higher. The maximum sensor response was achieved for MET and EDA at concentrations around 100 and 106 ng L−1 and an estimated analyte–QD ratio of 1 and 104, respectively.
The linear detection range for MET and EDA was determined to be over an analyte concentration of six and five orders of magnitude, respectively (inset of Fig. 7). The sensitivity for MET and EDA was determined to be 16.6% and 22.2% from the slope of the linear regression of the calibration curve shown in the inset of Fig. 8. The sensitivity is defined as the sensor response per logarithmic unit of analyte concentration. From the calibration curve, we can also determine the binding affinity (KA), which is the equilibrium binding constant and measures the tendency of the analyte to bind reversibly to the sensor. Under the assumption of a linear relationship between sensor occupancy and response, binding affinity is equal to the inverse of C1/2.48,49 Thus, we found that a C1/2 = 0.13 ± 0.03 ng L−1 and KA = (7.75 ± 1.80) ng L−1 for MET and. C1/2 = 3294 ± 375 ng L−1 and KA = (3.03 ± 0.38) × 10−4 ng L−1 for EDA. The higher the value of KA, the higher affinity between the sensor and analyte, and then, less analyte is required to achieve 50% occupancy of the sensor's binding sites. As expected, CdSe–PIP sensor showed considerably more affinity to MET than EDA.
Sensing in the IR range
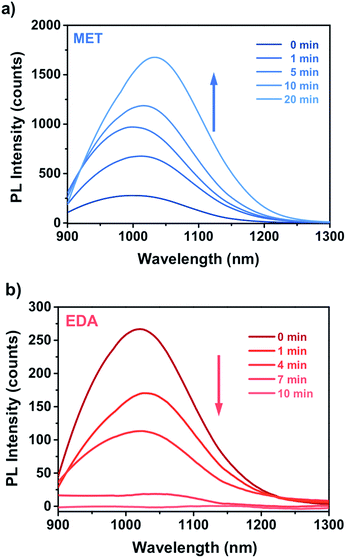
Fig. 8a and b shows the time dependence of the PbS–PIP sensor response to MET and EDA. The sensor composition was 6 wt% PbS QD and 94 wt% bis azide–cyclized PIP. We observed different sensor responses depending on the target analyte.In the case of EDA sensing (Fig. 8b), the PL intensity decreased with the exposure time. Here, the emission intensity dropped completely after 10 min indicating that the capping exchange by EDA molecules on the surface was complete. However, binding of MET molecules to the PbS surface (Fig. 8a) affected the luminescence properties in a remarkably different way from that observed for CdSe QDs. Here, the attachment of MET molecules on the PbS QD surface resulted in a 6.5-fold enhancement of the PL intensity of the PbS QDs.
Fig. 9 shows the evolution of the PL intensity of a PbS–PIP pattern for different exposure times to vapour of pure EDA, MET and water. Binding of MET and EDA molecules at the QD surface needs a determined incubation time to occur. Experimental data can be fitted to eqn (1). From this fit we found kMET = 2.0 ms−1 for sensing of MET vapour, and kEDT = 4.8 ms−1. We observed that the PbS–PIP sensor response to water vapour was negligible.
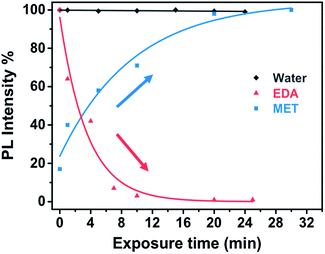 | ||
| Fig. 9 Real time response of PbS–PIP miniaturized sensor upon the exposure to MET, EDA and water (and the corresponding fitting curves). | ||
A possible explanation for the different response of CdSe and PbS QDs to MET could be found in the energetic position of the top of the valence band. The lower energetic position of the valence band for CdSe results in trapping of the photogenerated holes on the thiol molecule, thus quenching the luminescence, as aforementioned. For PbS, the fact that the valence band is located at higher energies with respect to the redox level of the thiol molecule makes the hole trapping energetically unfavorable (Fig. 5). As a result, QY of PbS significantly increased due to the improvement of the quality of the QD surface passivation by thiols.
Conclusions
In this work we have developed a patternable nanocomposite sensor based on luminescent CdSe (for the visible spectral range) and PbS (for the IR spectral range) QDs and a bisazide–cyclized polyisoprene photoresist (PIP) as the host matrix. This QD–PIP nanocomposite combined the extraordinary optical properties of the QDs with the lithographic characteristics of the resist matrix. Both the optical properties of QDs and the lithographic performance of the photoresist were preserved after their incorporation of QDs into the photoresist. As a result, we accurately patterned different types of microstructures. The sensing capability of this QD–PIP nanocomposite was evaluated using 1 cm2 square patterns as a disposable gas sensor for the detection of MET and EDA.We showed chemosensing response of CdSe–PIP patterns against MET and EDA in vapour and found LOD values around 10−3 and 125 ng L−1, respectively, which is equivalent to an analyte mass of 0.1 pg and 15 ng. From the calibration curves, we determined that the binding affinity of MET to CdSe–PIP was around four orders of magnitude higher than that of EDA. We also observed a linear sensing behaviour within a broad concentration range, which allowed us to use CdSe–PIP as a quantitative sensor for MET and EDA.
On the order hand, PbS–PIP nanocomposite shows different sensor responses depending on the target analyte, whereas exposure of the PbS-based nanocomposite to EDA led to quenching of the QD PL, and exposure to MET molecules resulted in an 6.5-fold enhancement of the PL intensity. The different response of CdSe and PbS QDs to MET can be explained by the differences in the energy of these QDs valence bands top with respect to the redox level of the thiol molecule.
This work confirms that luminescent QD–PIP nanocomposite can form the basis of a fully disposable sensing platform technology to perform chemo-sensing of interest for several fields such as food industry, environmental monitoring and health because QD–PIP sensors can be fabricated and miniaturized with fast and large-scale fabrication process on different substrates.
Acknowledgements
This work was supported through the Spanish MCINN, Generalitat Valenciana and EU-NAVOLCHI Grants Nos. TEC2011-29120-C05-01, PROMETEOII/2014/059 and 288869, respectively.Notes and references
- F. S. Ligler, Anal. Chem., 2009, 81, 519 CrossRef CAS PubMed.
- X. D. Fan, I. M. White, S. I. Shopova, H. Y. Zhu, J. D. Suter and Y. Z. Sun, Anal. Chim. Acta, 2008, 620, 8 CrossRef CAS PubMed.
- M. R. Plata, A. M. Contento and A. Ríos, Sensors, 2010, 10, 2511 CrossRef CAS PubMed.
- U. Resch-Genger, M. Grabolle, S. Cavaliere-Jaricot, R. Nitschke and T. Nann, Nat. Methods, 2008, 5, 763 CrossRef CAS PubMed.
- Y. Zhang and T. H. Wang, Theranostics, 2012, 2(7), 631 CrossRef CAS PubMed.
- Nanocrystal Quantum Dots, ed. V. I. Klimov, CRC Press, Boca Raton, FL, 2nd edn, 2010 Search PubMed.
- M. F. Frasco and N. Chaniotakis, Sensors, 2009, 9, 7266 CrossRef CAS PubMed.
- C. J. Murphy, Anal. Chem., 2002, 74, 520A CrossRef CAS.
- H. Gordillo, I. Suárez, R. Abargues, P. Rodríguez-Cantó, S. Albert and J. P. Martínez-Pastor, J. Nanomater., 2012, 2012, 9 Search PubMed.
- V. M. Menon, S. Husaini, N. Okoye and N. V. Vallapil, J. Nanophotonics, 2009, 3(1), 031608 CrossRef PubMed.
- N. A. Bakar, M. M. Salleh, A. A. Umar and M. Yahaya, Adv. Nat. Sci.: Nanosci. Nanotechnol., 2011, 2, 025011 CrossRef.
- R. Liang, R. Tian, W. Shi, Z. Liu, D. Yan, M. Wie, D. G. Evans and X. Duan, Chem. Commun., 2013, 49, 969 RSC.
- H. Wang, A. Yang and C. Sui, Optoelectronics Letters, 2013, 9(6), 421 CrossRef.
- S. Li, M. M. Lin, M. S. Toprak, D. K. Kim and M. Muhammed, Nano Rev., 2010, 1, 5214 Search PubMed.
- A. C. Balazs, T. Emrick and T. P. Russell, Science, 2006, 314(5802), 1107 CrossRef CAS PubMed.
- R. Abargues, J. Marqués-Hueso, J. Canet-Ferrer, E. Pedrueza, J. L. Valdés, E. Jiménez and J. P. Martínez-Pastor, Nanotechnology, 2008, 19, 355308 CrossRef CAS PubMed.
- C. Ingrosso, A. M. Panniello, R. Comparelli, M. L. Curri and M. Striccoli, Materials, 2010, 3, 1316 CrossRef CAS PubMed.
- R. Abargues, P. J. Rodriguez-Canto, S. Albert, I. Suarez and J. P. Martínez-Pastor, J. Mater. Chem. C, 2014, 2, 908 RSC.
- A. B. Dahlin, Sensors, 2012, 12, 3018 CrossRef PubMed.
- J. Marqués-Hueso, R. Abargues, J. L. Valdés and J. P. Martínez-Pastor, J. Mater. Chem., 2010, 20, 7436 RSC.
- J. Marqués-Hueso, R. Abargues, J. Canet-Ferrer, S. Agouram, J. L. Valdés and J. P. Martínez-Pastor, Langmuir, 2010, 26, 2825 CrossRef PubMed.
- R. A. Potyrailo, A. M. Leach and C. M. Surman, ACS Comb. Sci., 2012, 14(3), 170 CrossRef CAS PubMed.
- A. Bueno, I. Suarez, R. Abargues, S. Sales and J. Martínez-Pastor, IEEE Sens. J., 2012, 12(10), 3069 CrossRef CAS.
- A. Y. Nazzal, L. Qu, X. Peng and M. Xiao, Nano Lett., 2003, 3(6), 819 CrossRef CAS.
- Z. Zhao, M. Arrandalea, O. V. Vassiltsovab, M. A. Petrukhinab and M. A. Carpentera, Sens. Actuators, B, 2009, 141(1), 26 CrossRef CAS PubMed.
- O. V. Vassiltsovab, Z. Zhao, M. A. Petrukhinab and M. A. Carpenter, Sens. Actuators, B, 2007, 123, 522 CrossRef PubMed.
- W. Knoben, P. Offermans, S. H. Brongersma and M. Crego-Calama, Sens. Actuators, B, 2010, 148, 307 CrossRef CAS PubMed.
- C. Ingrosso, V. Fakhfouri, M. Striccoli, A. Agostiano, A. Voigt, G. Gruetzner, M. L. Curri and J. Brugger, Adv. Funct. Mater., 2007, 17, 2009 CrossRef CAS.
- L. Pang, K. Tetz, Y. Shen, C. Chen and Y. Fainman, J. Vac. Sci. Technol., B: Microelectron. Nanometer Struct.–Process., Meas., Phenom., 2005, 23(6), 2413 CrossRef CAS.
- W. W. Yu and X. Peng, Angew. Chem., Int. Ed., 2002, 41, 2368–2371 CrossRef CAS.
- W. W. Yu, L. Qu, W. Guo and X. Peng, Chem. Mater., 2003, 15(14), 2854 CrossRef CAS.
- I. Suárez, H. Gordillo, R. Abargues, S. Albert and J. Martínez-Pastor, Nanotechnology, 2011, 22, 435202 CrossRef PubMed.
- C. Ingrosso, A. M. Panniello, R. Comparelli, M. L. Curri and M. Striccoli, Materials, 2010, 3, 1316 CrossRef CAS PubMed.
- R. A. Sperling and W. J. Parak, Philos. Trans. R. Soc., A, 2010, 368, 1333 CrossRef CAS PubMed.
- S. F. Wuister, C. M. Donega and A. Meijerink, J. Phys. Chem. B, 2004, 108, 17393 CrossRef CAS.
- M. Georgin, L. Carlini, S. E. Bradforth and J. L. Nadeau, Phys. Chem. Chem. Phys., 2013, 15, 10418 RSC.
- V. V. Breus, C. D. Heyes and G. U. Nienhaus, J. Phys. Chem. C, 2007, 111, 18589 CAS.
- Z. J. Jiang, V. Leppert and D. F. Kelley, J. Phys. Chem. C, 2009, 113, 19161 CAS.
- J. G. Liang, S. S. Zhang, X. P. Ai, X. H. Ji and Z. K. He, Spectrochim. Acta, Part A, 2005, 61, 2974–2978 CrossRef PubMed.
- A. Mandal and N. Tamai, Chem. Phys. Lett., 2011, 507, 248 CrossRef CAS PubMed.
- S. N. Sharma, Z. S. Pillai and P. Kamat, J. Phys. Chem. B, 2003, 107, 1088 CrossRef.
- C. Landes, C. Burda, M. Braun and M. A. El-Sayed, J. Phys. Chem. B, 2001, 105, 2981 CrossRef CAS.
- C. Landes, M. Braun and M. A. El-Sayed, J. Phys. Chem. B, 2001, 105, 10554 CrossRef CAS.
- E. Zenkevich, T. Blaudeck, M. Heidernätsch and C. Von Borczyskowski, Theor. Exp. Chem., 2009, 45, 23 CrossRef CAS.
- R. Abargues, P. J. Rodriguez-Canto, S. Albert, I. Suarez and J. P. Martínez-Pastor, J. Mater. Chem. C, 2014, 2, 908 RSC.
- J. W. A. Findlay, W. C. Smith, J. W. Lee, G. D. Nordblom, I. Das, B. S. DeSilva, M. N. Khan and R. R. Bowsher, J. Pharm. Biomed. Anal., 2000, 21, 1249–1273 CrossRef CAS.
- M. A. O'Connell, B. A. Belanger and P. D. Haaland, Chemom. Intell. Lab. Syst., 1993, 20, 97–114 CrossRef.
- L. S. Jung, J. S. Shumaker-Parry, C. T. Campbell, S. S. Yee and M. H. J. Gelb, J. Am. Chem. Soc., 2000, 122, 4177–4184 CrossRef CAS.
- T. Kenakin, Trends Pharmacol. Sci., 2004, 25, 186–192 CrossRef CAS PubMed.
Footnote |
| † Electronic supplementary information (ESI) available. See DOI: 10.1039/c4ra02812k |
| This journal is © The Royal Society of Chemistry 2015 |

