
Chiroptical sensing of oligonucleotides with a cyclic octapyrrole†
Machiko
Ie
,
Jun-ichiro
Setsune
,
Kazuo
Eda
and
Akihiko
Tsuda
*
Department of Chemistry, Graduate School of Science, Kobe University, 1-1 Rokkodai-cho, Nada-ku, Kobe 657-8501, Japan. E-mail: tsuda@harbor.kobe-u.ac.jp
First published on 28th November 2014
Abstract
A cyclic octapyrrole 8P bearing alkyl and phenyl substituents shows chiroptical responses upon complexation with oligonucleotides in water. It specifically provides a strong CD response with an oligonucleotide that has high thymine content.
Introduction
Dye host molecules, composed of porphyrin and its derivatives that absorb UV and visible light with large absorption coefficients, become chiroptical sensors for asymmetric species.1–8 In most cases, the host molecule accommodates the asymmetric guest molecule to give a circular dichroism (CD) response. Cyclic oligopyrroles and their metal complexes9 having helical conformations show induced CD through noncovalent interactions with the asymmetric guest in the UV–visible region.10,11 These studies found that their helical conformations, whose enantiomers interconvert dynamically into each other at room temperature, are biased toward one of the enantiomers through chiral molecular recognition. In those studies, the cyclic hosts recognized the chiral structures of the smaller guest molecules through multi-point interactions in their inner cavities or metal centers. However, no example has been reported of the chiroptical sensing of larger asymmetric molecules and molecular assemblies with the cyclic oligopyrroles as guest chiroptical sensors. In this study we have found that a cyclic octapyrrole 8P, bearing hydrophobic alkyl and phenyl substituents at meso and pyrrole-β positions (Fig. 1a), shows a chiroptical response upon complexation with an oligonucleotide in water. 8P specifically shows a strong CD response with oligonucleotides high in thymine content (Fig. 1b). | ||
| Fig. 1 (a) Dynamic inversions between left- and right-handed helical enantiomers of 8P. (b) Nucleotides and oligonucleotides used in this study. | ||
Results and discussion
One of the authors had previously reported syntheses of 8P having a chiral figure-eight loop structure, and its metal complexation.11 Enantioselective inductions of helical chirality were achieved by the chiral molecular recognition of asymmetric compounds such as mandelic acid and 1-(1-phenyl)ethylamine. In this study, we have successfully demonstrated X-ray crystallographic analysis of free-base 8P (Fig. 2). It shows that the cyclic octapyrrole framework adopts the chiral figure-eight loop structure, and is also surrounded by the alkyl and phenyl substituent groups with a molecular diameter of 0.8–1.6 nm. 2,2′-Bipyrrole units with s-trans conformations cross at the center of the cavity. The side view shows a rhombic cavity enclosed by four panels of the planar dipyrrin unit. | ||
| Fig. 2 X-ray crystal structure of 8P: (a) whole view, where hydrogen atoms are omitted for clarity, (b) top and side views, where hydrogen atoms and all substituent groups are omitted for clarity. | ||
8P is insoluble in water, but its HCl salt (8P·HCl) is slightly soluble in water. The electronic absorption spectrum of 8P·HCl, whose sample solution was prepared by 1000-fold dilution of a methanol solution of 8P·HCl with water, showed a broad absorption band in the range of 400–800 nm with λmax at 546 nm, originating from the large π-conjugations over the pyrrole components (Fig. 3, black curve). Since the 1H NMR spectrum of 8P·HCl in D2O is notably broadened, 8P·HCl molecules most likely aggregate in the water solution. Dynamic light scattering (DLS) measurement of the sample solution with a concentration of 1.8 × 10⁻⁵ M actually showed the presence of the aggregates with an average diameter of 42.7 nm (Fig. S1†).
 | ||
| Fig. 3 Absorption and CD spectra of 8P·HCl in the presence and absence of nucleotides (dAMP, dTMP, dCMP, or dGMP) or oligonucleotides (dA12, dT12, dC12, or dG12) at 10 °C in a 10 mM acetate buffer solution at pH 4.0. [8P·HCl] = 1.8 × 10⁻⁵ M, [nucleotide] = 9.0 × 10⁻⁵ M, [oligonucleotide] = 1.4 × 10⁻⁵ or 3.6 × 10⁻⁵ M. | ||
It is known that 8P shows chiroptical responses originating from induction of the helical structure to one of the enantiomers upon complexation with optically active acids such as mandelic acid and tartaric acid in CH2Cl2.11 Even in the water solution, 8P·HCl provided the induced CD spectra in the visible region upon mixing with excess amounts of (R)- and (S)-mandelic acid (Fig. S2†). With an expectation that 8P·HCl also complexes with nucleotide monomers (dAMP, dTMP, dCMP, and dGMP) through electrostatic and/or hydrophobic interactions,12 we then demonstrated spectroscopic measurements of 8P·HCl upon mixing with the nucleotide in an acetic acid buffer solution with pH 4.0 at 20 °C. In the electronic absorption spectroscopy, λmax of 8P·HCl at 546 nm in the lower energy absorption band was blue-shifted to 542–543 nm with increasing absorbance upon addition of 5 equiv. of dAMP, dTMP, dCMP, or dGMP to the solution (Fig. 3, black broken curves). These observed spectral changes indicate the complexation of 8P·HCl with the nucleotide through possible anion-exchanges. However, no notable CD inductions were observed in any of the cases.
In sharp contrast to the cases with nucleotide monomers, when 8P·HCl was mixed with 0.8 equiv. (10 equiv. for monomer unit) of the homooligonucleotide 12 mer of dA12, dT12, dC12, or dG12, the lowest energy absorption band was significantly red-shifted to λmax = 570–630 nm with a shoulder around 700 nm (Fig. 3, red curves and Fig. S3†). The observed spectral changes indicate that the homooligonucleotides form complexes with 8P·HCl through essentially different interactions from that with the nucleotide monomers. In these sample solutions, surprisingly, induced CD spectra appeared only in the cases with dA12 and dT12. The mixture of 8P·HCl and dA12 showed negative CD signals at 787 and 477 nm, and positive ones at 617 and 405 nm. The almost same CD spectral profile was also observed in the mixture of 8P·HCl and dT12 under the same conditions. The electronic transitions along the long axes of the π-conjugated bisdipyrrin chromophores are responsible for the absorption band around 700 nm. The CD exciton chirality method for the observed CD signals with negative to positive signs (a negative couplet) corresponding to this absorption band suggest a dominant formation of the M,M helical conformation.13 This characterization is also supported by the calculated CD profile of the metal complex of 8P reported previously.11 The homooligonucleotides and their assemblies are known to adopt right-handed helical conformations in crystal structures.14,15 Since the twist direction of the homooligonucleotides agrees with that for the long molecular axis of (M,M)-8P, the directional hydrophobic interaction between the multi-base and substituent groups may bring about the higher stability of the complex.
The plot of the CD spectral intensity change of 8P·HCl at 400 nm by varying the concentrations of the added dA12 shows that the spectral intensity increases until it reaches a plateau at 1![[thin space (1/6-em)]](https://www.rsc.org/images/entities/char_2009.gif) :1 ratio, with no further effect at higher concentrations of dA12 (Fig. 4a, black circles). This result indicates a 1:1 complexation of 8P·HCl and dA12. However, the observed profile with dT12 shows stepwise increases of the CD intensity with the first and the second plateaus around 1:1 and 1:2 ratios, respectively (Fig. 4a, red circles). The observed CD intensity with the 1:2 mixture is approximately three times larger than that observed in the 1:1 mixture. The absorption spectrum of the 1:2 mixture shows a sharp absorption band with increasing absorbance at λmax = 617 nm, and is also markedly different from that observed in the 1:1 mixture (Fig. 3b, blue and red curves, respectively). These characteristic spectral changes indicate stepwise formations of the 1:1 and 1:2 complexes of 8P·HCl and dT12.
:1 ratio, with no further effect at higher concentrations of dA12 (Fig. 4a, black circles). This result indicates a 1:1 complexation of 8P·HCl and dA12. However, the observed profile with dT12 shows stepwise increases of the CD intensity with the first and the second plateaus around 1:1 and 1:2 ratios, respectively (Fig. 4a, red circles). The observed CD intensity with the 1:2 mixture is approximately three times larger than that observed in the 1:1 mixture. The absorption spectrum of the 1:2 mixture shows a sharp absorption band with increasing absorbance at λmax = 617 nm, and is also markedly different from that observed in the 1:1 mixture (Fig. 3b, blue and red curves, respectively). These characteristic spectral changes indicate stepwise formations of the 1:1 and 1:2 complexes of 8P·HCl and dT12.
 | ||
| Fig. 4 Plots of observed CD intensities of mixtures of 8P·HCl (1.8 × 10⁻⁵ M) and oligonucleotides at 10 °C by varying (a) concentration of dA12 and dT12, (b) ratio of adenine (A) and thymine (T) in the oligonucleotide 12 mer (2 equiv.), and (c) number of nucleotide units in dTn (n = 1, 3, 4, 6, 12, and 24) with the concentration of the nucleotide unit at 43.0 × 10⁻⁵ M (2 equiv. in dT12). Base sequences of the oligonucleotide in (b): AATAATAATAAT, TTATTATTATTA, ATTTTTTTTTTA, and TTTTTTATTTTT for n = 4, 8, 10, and 11, respectively. | ||
To clarify the molecular interactions between 8P·HCl and dT12, we then performed 1H NMR spectroscopy of their mixture solution. When 8P·HCl was mixed with 2 equiv. of dT12 in D2O, no notable shifts of signals corresponding to the deoxyribose components were observed in dT12, but downfield shifts (Δδ = ∼0.03 ppm) of the signals were observed in the thymine nucleobase component (Fig. 5). The host molecules, when complexed with porphyrin derivatives having a large aromatic macrocyclic ring, generally show upfield shifts of the peaks owing to the ring current effects of the porphyrin. The observed downfield shifts of the peaks of dT12, when complexed with 8P·HCl may, thus, originate from the non-conjugated macrocyclic structure of 8P carrying HCl that generally brings about the downfield shifts of the interacting molecules. The observed characteristic peak shifts indicate that dT12 envelops 8P·HCl in water solutions through hydrophobic interactions (Fig. 6). Here, the thymine component, having a hydrophobic methyl group without an amino group, in dT12 may allow its directed supramolecular complexation with 8P·HCl, having hydrophobic substituent groups, to cause the helical induction. In support of this hypothesis, the stronger induced CD appeared upon mixing of 8P·HCl with a heterooligonucleotide dTnA12–n having higher thymine content (Fig. 4b). The CD intensity nonlinearly increases on increasing the hydrophobic thymine component in the oligonucleotide 12 mer. Furthermore, the CD intensity shows a length dependence of the oligonucleotide. The CD intensity increases as the number of the nucleotide components of dTn increases, and a plot of the intensity with respect to the number of thymine components (n) shows a sigmoidal profile (Fig. 4c). The CD response appears over dT4, increases with increasing numbers of oligonucleotide units, and reaches a plateau around dT12. The result can be readily understood by a CPK model study, showing that dT12 can accommodate 8P·HCl in its pseudo hydrophobic cavity to form a size-favorable complex as observed in foldamers (Fig. S4†).6 At higher concentrations of dT12, it can be expected that 8P·HCl is more efficiently isolated from water by two molecules of dT12 through 1:2 complexation (Fig. 6b).
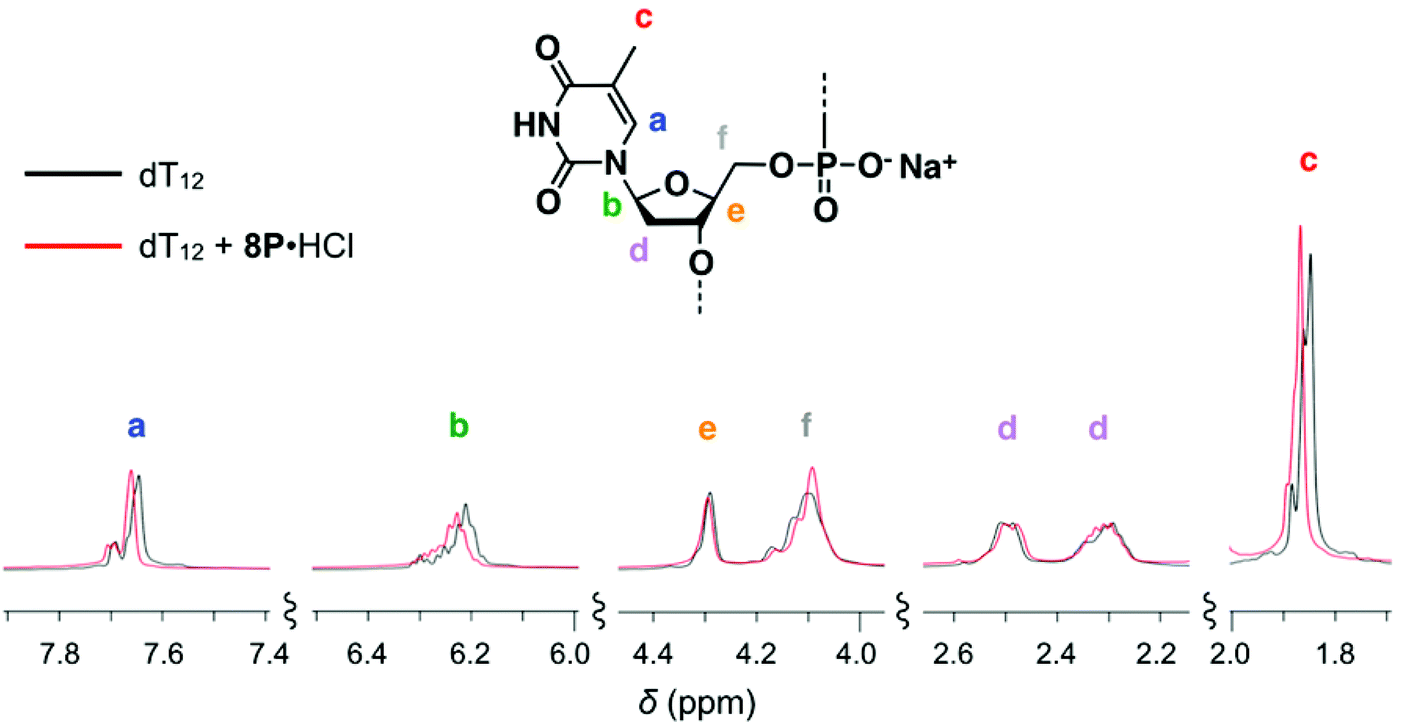 | ||
| Fig. 5 Changes in the 1H NMR spectrum of dT12 upon mixing with 0.5 equiv. amount of 8P·HCl at 10 °C in D2O containing 10 mM CD3CO2D. [8P·HCl] = 1.5 × 10⁻³ M, [dT12] = 3.0 × 10⁻³ M. | ||
 | ||
| Fig. 6 Possible associations of 8P and dT12 in (a) 1:1 and (b) 1:2 complexation. | ||
Conclusion
In this study we have found that a cyclic octapyrrole 8P having a figure-eight loop structure is capable of sensing chiroptically the molecular chirality of oligonucleotides, and gives a strong CD response to oligonucleotides high in thymine content. With the advantage of 8P at sensing molecular chirality by its basic inner cavity or hydrophobic outer substituents, the chiroptical sensing of natural biomolecules such as DNA and proteins will lead to fascinating future projects.Experimental section
Materials
Most reagents and solvents were used as received from commercial sources without further purification. (R)- and (S)-Mandelic acids (>99%) were purchased from Aldrich. 2′-Deoxyadenosine-, 2′-deoxycytidine-, and 2′-deoxyguanosine-5′-monophosphate disodiumsalts (dAMP, dCMP, and dGMP, respectively) were purchased from MP Biomedicals. 2′-Deoxythymidine-5′-monophosphate disodiumsalt (dTMP) was purchased from Nacalai Tesque. Oligonucleotides were purchased from Hokkaido System Science Co., Ltd. 8P was synthesized according to the method described in the literature.11 Recrystallization from benzene/acetonitrile gave crystals for X-ray crystallographic analysis. Crystal data: C86H92N8·C6H6, Mr = 1315.79, orthorhombic, space group Pnn2, a = 15.865(4), b = 16.430(4), c = 14.961(4) Å, a = 90, b = 90, g = 90°, V = 3899.7(17) Å3, Z = 2, ρcalcd = 1.120 M g−3, μ(MoKα) = 0.065 mm−1, T = 173(2) K, crystal size: 0.40 × 0.20 × 0.15 mm. A total of 18780 unique reflections were collected (1.78 < 2θ < 25.50) by using graphite-monochromated MoKα radiation. The structure was solved by direct methods by using the SHELX97 package.16 The positions of all non-hydrogen atoms were refined anisotropically (533 parameters). All hydrogen atoms were placed at ideal positions and included in the refinement. R1 = 0.0433, wR2 = 0.1132 for 6562 reflections with I > 2.00σ(I); R1 = 0.0511, wR2 = 0.1077 for all data; GOF (on F2) = 1.034. CCDC 1027733 contains the supplementary crystallographic data for this paper.
Preparation of 8P·HCl salt
A CH2Cl2 solution of 8P was stirred upon mixing with a small amount of conc. HCl (aq.). The sample solution was evaporated to dryness under reduced pressure to leave 8P·nHCl (n = 1–4) as a dark purple powdery solid.Measurements
CD spectra were recorded on a JASCO J-820 spectropolarimeter equipped with a JASCO PTC-423L temperature/stirring controller. Electronic absorption spectra were recorded using a JASCO type V-670 UV/VIS/NIR spectrometer equipped with a JASCO type ETC-717 temperature/stirring controller. Prior to spectral measurements, sample water solutions ([8P·HCl] = 1.8 × 10⁻⁵ M) were prepared by diluting a methanol solution of 8P·HCl ([8P·HCl] = 1.8 × 10⁻² M) with a water solution containing oligonucleotides, and allowed to stand in the dark at 10 °C for 6 h under stirring. 1H NMR spectra were recorded on a Bruker AVANCE 500 spectrometer (500 MHz). Chemical shifts (δ in ppm) were reported with respect to trimethylsilyl propanoic acid (TMSP) as the internal standard. Dynamic light scattering (DLS) measurements were performed using an Otsuka model ELS-Z2 instrument. X-ray diffraction data were collected on a Bruker APEX II Ultra CCD diffractometer using MoKα radiation (λ = 0.71073 Å) at 298 K.Acknowledgements
The present study was sponsored by Grants-in-Aid for Scientific Research (B) (no. 25286017) and Challenging Exploratory Research (no. 26620066) from the Ministry of Education, Science, Sports, and Culture, Japan.References
- X. Huang, B. H. Rickman, B. Borhan, N. Berova and K. Nakanishi, J. Am. Chem. Soc., 1998, 120, 6185–6186 CrossRef CAS.
- (a) V. V. Borovkov, J. M. Lintuluoto, M. Fujiki and Y. Inoue, J. Am. Chem. Soc., 2000, 122, 4403–4407 CrossRef CAS; (b) G. A. Hembury, V. V. Borovkov and Y. Inoue, Chem. Rev., 2008, 108, 1–73 CrossRef CAS PubMed; (c) G. Fukuhara and Y. Inoue, Chem. – Eur. J., 2010, 16, 7859–7864 CrossRef CAS PubMed.
- (a) R. J. Fiel, J. C. Howard, E. H. Mark and N. Datta Gupta, Nucleic Acids Res., 1979, 6, 3093–3118 CrossRef CAS PubMed; (b) J. K. Choi, A. Reeda and M. Balaz, Dalton Trans., 2014, 43, 563–567 RSC; (c) R. Pasternack, Chirality, 2003, 15, 329–332 CrossRef CAS PubMed.
- (a) D. P. Iwaniuk and C. Wolf, Org. Lett., 2011, 13, 2602–2605 CrossRef CAS PubMed; (b) D. P. Iwaniuk and C. Wolf, Chem. Commun., 2012, 48, 11226–11228 RSC; (c) K. W. Bentley, Y. G. Nam, J. M. Murphy and C. Wolf, J. Am. Chem. Soc., 2013, 135, 18052–18055 CrossRef CAS PubMed.
- R. Katoono, H. Kawai, K. Fujiwara and T. Suzuki, J. Am. Chem. Soc., 2009, 131, 16896–16904 CrossRef CAS PubMed.
- (a) R. B. Prince, S. A. Barnes and J. S. Moore, J. Am. Chem. Soc., 2000, 122, 2758–2762 CrossRef CAS; (b) J.-m. Suk, V. R. Naidu, X. Liu, M. S. Lah and K.-S. Jeong, J. Am. Chem. Soc., 2011, 133, 13938–13941 CrossRef CAS PubMed.
- (a) Y. Furusho, T. Kimura, Y. Mizuno and T. Aida, J. Am. Chem. Soc., 1997, 119, 5267–5268 CrossRef CAS; (b) Y. Mizuno, T. Aida and K. Yamaguchi, J. Am. Chem. Soc., 2000, 122, 5278–5285 CrossRef CAS; (c) W.-S. Li, D.-L. Jiang, Y. Suna and T. Aida, J. Am. Chem. Soc., 2005, 127, 7700–7702 CrossRef CAS PubMed.
- (a) J. Aimi, K. Oya, A. Tsuda and T. Aida, Angew. Chem., Int. Ed., 2007, 46, 2031–2035 CrossRef CAS PubMed; (b) A. Tsuda, Bull. Chem. Soc. Jpn., 2009, 82, 11–28 CrossRef CAS.
- (a) E. Vogel, M. Michels, L. Zander, J. Lex, N. S. Tuzun and K. N. Houk, Angew. Chem., Int. Ed., 2003, 42, 2857–2862 CrossRef CAS PubMed; (b) Y. Tanaka, W. Hoshino, S. Shimizu, K. Youfu, N. Aratani, N. Maruyama, S. Fujita and A. Osuka, J. Am. Chem. Soc., 2004, 126, 3046–3047 CrossRef CAS PubMed; (c) S. Shimizu, Y. Tanaka, K. Youfu and A. Osuka, Angew. Chem., Int. Ed., 2005, 44, 3726–3729 CrossRef CAS PubMed; (d) Y. Tanaka, S. Saito, S. Mori, N. Aratani, H. Shinokubo, N. Shibata, Y. Higuchi, Z. S. Yoon, K. S. Kim, S. B. Noh, J. K. Park, D. Kim and A. Osuka, Angew. Chem., Int. Ed., 2008, 47, 681–684 CrossRef CAS PubMed; (e) J. Setsune, M. Mori, T. Okawa, S. Maeda and J. M. Lintuluoto, J. Organomet. Chem., 2007, 692, 166–174 CrossRef CAS PubMed; (f) M. Mori and J. Setsune, Chem. Lett., 2007, 36, 244–245 CrossRef CAS.
- (a) A. Werner, M. Michels, L. Zander, J. Lex and E. Vogel, Angew. Chem., Int. Ed., 1999, 38, 3650–3653 CrossRef CAS; (b) J. M. Lintuluoto, K. Nakayama and J. Setsune, Chem. Commun., 2006, 3492–3494 RSC.
- J.-i. Setsune, A. Tsukajima, N. Okazaki, J. M. Lintuluoto and M. Lintuluoto, Angew. Chem., Int. Ed., 2009, 48, 771–775 CrossRef CAS PubMed.
- (a) Y. H. Kim, A. Tishbee and E. Gil-Av, Science, 1981, 213, 1379–1381 CAS; (b) R. Moreno-Corral and K. O. Lara, Supramol. Chem., 2008, 20, 427–435 CrossRef CAS; (c) I. Sigal-Batikoff, O. Konovalov, A. Singh and A. Berman, Langmuir, 2010, 26, 16424–16433 CrossRef PubMed; (d) M. Zhang and B.-C. Ye, Anal. Chem., 2011, 83, 1504–1509 CrossRef CAS PubMed.
- (a) N. Harada, Y. Takuma and H. Uda, J. Am. Chem. Soc., 1976, 98, 5408–5409 CrossRef CAS; (b) N. Harada and K. Nakanishi, Acc. Chem. Res., 1972, 5, 257–263 CrossRef CAS.
- A. Rich, D. R. Davis, F. H. C. Criok and J. D. Watson, J. Mol. Biol., 1961, 3, 71–86 CrossRef CAS.
- N. Camerman and J. K. Fawcett, J. Mol. Biol., 1976, 107, 601–621 CrossRef CAS.
- G. M. Sheldrick, SHELXTL 5.10 for Windows NT: Structure Determination Software Programs, Bruker Analytical X-ray Systems, Inc., Madison, WI, 1997 Search PubMed.
Footnote |
| † Electronic supplementary information (ESI) available. CCDC 1027733. For ESI and crystallographic data in CIF or other electronic format see DOI: 10.1039/c4qo00268g |
| This journal is © the Partner Organisations 2015 |