 Open Access Article
Creative Commons Attribution 3.0 Unported Licence
Synthesis and evaluation of a boronate-tagged 1,8-naphthalimide probe for fluoride recognition†
Su-Ying
Xu
a,
Xiaolong
Sun
a,
Haobo
Ge
a,
Rory L.
Arrowsmith
a,
John S.
Fossey
b,
Sofia I.
Pascu
*a,
Yun-Bao
Jiang
*c and
Tony D.
James
*a
aDepartment of Chemistry, University of Bath, Bath BA2 7AY, UK. E-mail: t.d.james@bath.ac.uk; s.pascu@bath.ac.uk
bSchool of Chemistry, University of Birmingham, Edgbaston, Birmingham, West Midlands B15 2TT, UK
cDepartment of Chemistry, College of Chemistry and Chemical Engineering, and the MOE Key Laboratory of Analytical Sciences, Xiamen University, Xiamen 361005, China. E-mail: ybjiang@xmu.edu.cn
First published on 4th December 2014
Abstract
A biocompatible fluoride receptor has been developed where the interaction between the boronic acid ester and amine (NH) results in fluoride ion selectivity and enhanced fluorescence quenching.
Introduction
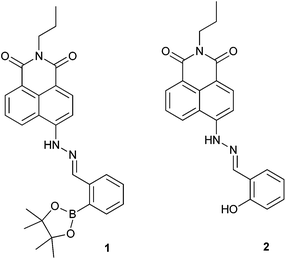
Anion recognition is one of the most challenging problems for analytical chemists due to the complexity of their geometries, small charge to radius ratios and heavy solvation.1–3 Synthetic molecular strategies for anion detection require a flexible design and matching of binding site geometries to specific anions. Several reviews summarise the development of anion chemosensors.2,4–6 Fluoride recognition has attracted substantial interest not only because of its unique properties but also its importance in our daily life. In particular, fluoride salts can be used as phosphatases inhibitors, because they mimic the structure of the phosphate group and therefore act as transition state analogues.7 Also, while low levels of fluoride anion can be used for oral hygiene,8,9 an excess of fluoride results in fluorosis.10 Many fluoride chemosensors have been developed based on the hydrogen bonding interaction between fluoride and the –NH groups of (thio)ureas,11–15 amides,16,17 and pyrrole moieties.18,19 While, the strong Lewis base character of fluoride can be used in sensing through coordination with Lewis acidic boron atoms.20–27 Recently, several chemodosimeters for fluoride anions have been developed exploiting the strong affinity of silicon with fluoride.28–30 While many receptors have been used independently, very few examples exist where receptors motifs have been used cooperatively. Gabbai et al. has incorporated an amide moiety with triarylboranes. Where, the hydrogen-bond donor groups assist fluoride binding at the boron centre, leading to a significant increase in the stability constant of the corresponding fluoride complex.31 Yoon and co-workers has combined an imidazole group with a boronic ester to create a (C–H)+⋯F− ionic hydrogen-bond and boron-fluoride regime. They found that only a receptor with an ortho-boron and imidazolium exhibited enhanced fluoride binding.324-Amino-1,8-naphthalimide derivatives are often used in the design of synthetic molecular probes, due to their versatility and easy functionalization especially in the –NH position. There have been a number of boronic acid or ester – modified naphthalimide derivatives reported,33–38 however, to the best of our knowledge they have mostly focused on the detection of monosaccharides. Herein, we prepared a boronate-tagged 1,8-naphthalimide derivative 1 and reference probe 2 containing a phenolic OH (Fig. 1) for cooperative fluoride recognition. We also explored the potentials of using probe 1 for cellular imaging applications.
Results and discussion
Synthesis and optical behaviour
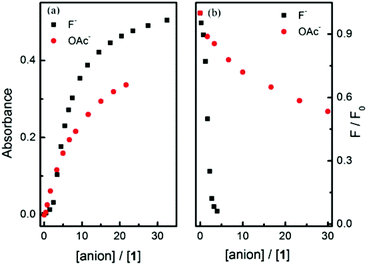
Boronic ester 1 and phenol 2 were prepared following published methods.39 The anions fluoride and acetate were titrated with probes 1 and 2 (Fig. 2 and S1–S3†). Probe 1 has an intense absorption peak at 448 nm in dry acetonitrile (MeCN), and displays solvent dependant properties, showing a bathochromic shift along with decreasing solvent polarity (Fig. S4†). Upon addition of F−, two new absorption bands appeared at 386 nm and 590 nm, respectively, along with a decrease of absorbance at 448 nm (Fig. 2). Probe 2 has an intense absorption at 442 nm and addition of fluoride induced a new absorption peak at 575 nm and a decrease of fluorescent emission at 520 nm. The observed changes indicate that anion bindings with both 1 and 2 result in strong hydrogen bonding with acetate and eventual deprotonation by fluoride of the 4-amino moiety.40–42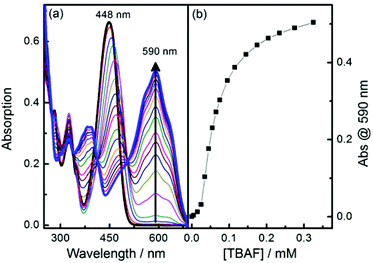 | ||
| Fig. 2 (a) Absorption spectra changes of probe 1 along with addition of fluoride anion in MeCN; (b) Plot of absorption at 590 nm versus concentration of TBAF [1] = 10 μM. | ||
The binding mode for fluoride and probe 1 is complicated due to the presence of multiple binding sites. Job plot analysis indicates a 5![[thin space (1/6-em)]](https://www.rsc.org/images/entities/char_2009.gif) :
:![[thin space (1/6-em)]](https://www.rsc.org/images/entities/char_2009.gif) 1 binding mode (Fig. S5†), consistent with three fluorides binding with the boron and two with the amine hydrogen. The most relevant binding constants were evaluated using a modified Hill equation.43 For fluoride, the binding constant K has a value as (1.6 ± 0.03) × 104 M−1 with R2 > 0.995 (Fig. S6†). The Hill coefficient n has a value of 2, indicating cooperative binding. For acetate Job plot analysis indicates a 1
1 binding mode (Fig. S5†), consistent with three fluorides binding with the boron and two with the amine hydrogen. The most relevant binding constants were evaluated using a modified Hill equation.43 For fluoride, the binding constant K has a value as (1.6 ± 0.03) × 104 M−1 with R2 > 0.995 (Fig. S6†). The Hill coefficient n has a value of 2, indicating cooperative binding. For acetate Job plot analysis indicates a 1![[thin space (1/6-em)]](https://www.rsc.org/images/entities/char_2009.gif) :
:![[thin space (1/6-em)]](https://www.rsc.org/images/entities/char_2009.gif) 1 binding mode (Fig. S7†), while the binding constant based on Hill analysis is 7158 ± 424 M−1 with R2 > 0.998. The Hill coefficient n value is 1, suggesting an independent binding event (Fig. S8†).
1 binding mode (Fig. S7†), while the binding constant based on Hill analysis is 7158 ± 424 M−1 with R2 > 0.998. The Hill coefficient n value is 1, suggesting an independent binding event (Fig. S8†).
Probe 2 is more sensitive to fluoride. 3 eq. of fluoride produces a plateau in the absorption spectra, while probe 1 requires 13 eq. of fluoride to reach a plateau (Fig. S9†). Job plot analysis indicates a 4![[thin space (1/6-em)]](https://www.rsc.org/images/entities/char_2009.gif) :
:![[thin space (1/6-em)]](https://www.rsc.org/images/entities/char_2009.gif) 1 binding mode (Fig. S10†), while the binding constant based on Hill analysis is (4.3 ± 0.19) × 104 M−1 with R2 as 0.992 (Fig. S11†). The Hill coefficient n has a value of 2 indicating cooperative binding. Upon addition of acetate to probe 2, an absorption peak at 575 nm was observed, similar to that seen with fluoride. Probe 2 displayed similar sensitivity toward acetate (Fig. S12†). Job plot analysis (Fig. S13†) indicates a 2
1 binding mode (Fig. S10†), while the binding constant based on Hill analysis is (4.3 ± 0.19) × 104 M−1 with R2 as 0.992 (Fig. S11†). The Hill coefficient n has a value of 2 indicating cooperative binding. Upon addition of acetate to probe 2, an absorption peak at 575 nm was observed, similar to that seen with fluoride. Probe 2 displayed similar sensitivity toward acetate (Fig. S12†). Job plot analysis (Fig. S13†) indicates a 2![[thin space (1/6-em)]](https://www.rsc.org/images/entities/char_2009.gif) :
:![[thin space (1/6-em)]](https://www.rsc.org/images/entities/char_2009.gif) 1 binding mode. Binding constants were obtained using the Hill equation giving a binding constant K of (7.7 ± 0.25) × 104 M−1 (R2 = 0.994) (Fig. S14†) The Hill coefficient n has a value of 2, indicating cooperative binding.
1 binding mode. Binding constants were obtained using the Hill equation giving a binding constant K of (7.7 ± 0.25) × 104 M−1 (R2 = 0.994) (Fig. S14†) The Hill coefficient n has a value of 2, indicating cooperative binding.
From these observations we can propose a binding mechanism for fluoride and acetate with probes 1 and 2 (Scheme 1). As expected the reference system probe 2 was not selective for fluoride over acetate.
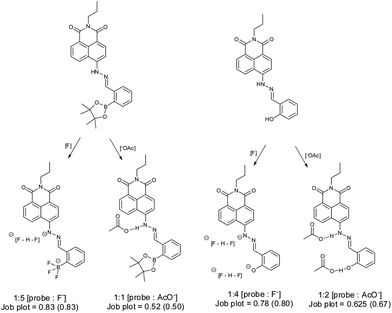 | ||
| Scheme 1 Proposed binding modes for probes 1 and 2 with fluoride and acetate anion in MeCN. Stoichiometry of binding and Job plot analysis: observed value and (theoretical) value. | ||
Amongst the other anions investigated with probe 1 other than F− and OAc−, only H2PO4− produced a moderate response (Fig. 3 and Fig. S15†). Interestingly, F− produces different spectral changes to the other anions. The original peak at 448 nm shifts to 470 nm and a new peak at 590 nm increases when 5 equiv. of F− were added and none of the other anions induce such a red-shift. This shift from 448 nm to 470 nm is ascribed to coordination between fluoride and the boron atom. Interestingly the different anions produce different colour changes, a bright yellow solution of probe 1 changes colour to mauve on addition of F−, blue grey with OAc− and tan with H2PO4− anions as shown in Fig. 4.
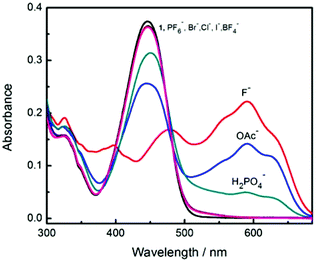 | ||
| Fig. 3 Comparison of absorption spectra after addition of 5 equivalents of different anions in MeCN. [1] = 12 μM. | ||
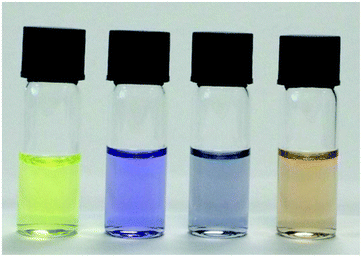 | ||
| Fig. 4 Colour changes of probe 1 after treatment with different anions. Samples show, from left to right: 12 uM probe 1, 13 equiv. of each anions or the anions F−, OAc−, H2PO4− respectively. | ||
Next, fluorescence titration experiments for probe 1 were carried out with fluoride and acetate (Fig. 5 and S16†), both of which indicate a decreased fluorescence upon addition of fluoride. Again, a red-shift of the maximum emission of probe 1 at higher concentrations of fluoride anion was observed.
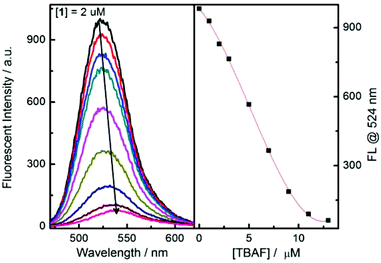 | ||
| Fig. 5 Fluorescence spectra changes of probe 1 upon addition of TBAF in MeCN. λex = 450 nm, [1] = 2 μM. | ||
A significantly better selectivity between fluoride and acetate was observed in the fluorescence experiments (Fig. 6(b)). This may be a synergistic effect between the boronate anion and amine anion i.e. these two anions are better at quenching the fluorescence of the naphthalimide than the amine anion alone. (Scheme 1).
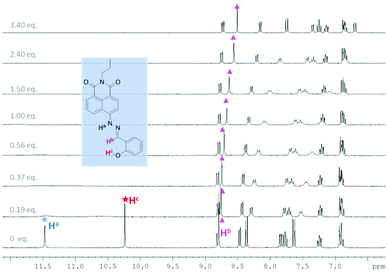
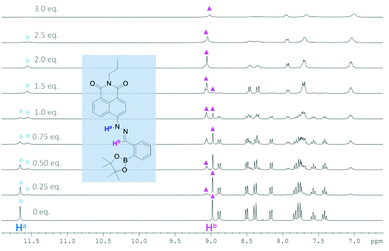
In order to probe further the species proposed in Scheme 1, 1H NMR spectroscopic analysis was carried out in DMSO-d6, using 20 mM of probe 1 and 10.7 mM of probe 2 at 25 °C (Fig. 7, 8 and Tables S17 and S18†). For probe 2, as soon as TBAF is added the initial amine NH proton (Ha) at 11.50 ppm and the phenol OH proton (Hc) at 10.25 ppm disappear (probably due to becoming very broad). However, for probe 1 upon the addition of TBAF, in addition to the initial amine NH proton's chemical shift (Ha) at 11.66 ppm, a new peak appears at 11.54 ppm, indicating the formation of two species. Similarly for the imine protons (Hb), the initial peak at 8.98 ppm decreased and a new peak at 9.06 ppm appeared. After addition of one equivalent of fluoride, the original NH peak (Ha) reduced its intensity and was broadened. When the concentration of fluoride was further increased up to three equivalents with respect to probe 1, this signal disappeared. Meanwhile, the original peak of the imine proton (Hb) at 8.98 ppm also disappeared leaving a peak at 9.06 ppm. The NMR titration results for probe 1 and 2 suggest that there are two different binding events for fluoride with probe 1. We propose that both the boron atom and NH fragment can interact with the fluoride anion. From the results with probe 2 the amine NH proton is simply removed (through hydrogen bonding/deprotonation), but for probe 1 on addition of fluoride two species initially coexist, which are the free boron and the fluoride bound boron systems. Adding more fluoride to probe 1 results in an increase in the amount of fluoride bound boron. While, the overall intensity of the NH proton slowly decreases until it disappears when 3.0 equivalents of fluoride are added, which is the hydrogen bonding/deprotonation of the amine NH proton with fluoride (Scheme 1).
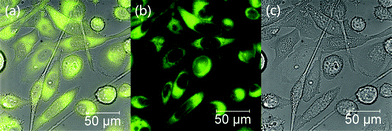
We then probed the biocompatibility and the potential of probe 1 for cellular imaging applications, taking advantage of its strong fluorescence emission signal. PC-3 cells were cultured and treated with 1 following a previously published procedure.37 Our experiments indicate that probe 1 is membrane permeable and the nuclei appear to remain intact, as shown in Fig. 9. The fluorescence emission of this compound in vitro appears to be rather strong, since a final concentration of only 2 μM of probe 1 was needed to be incubated with the cells for bright images to be obtained. Previously, in our hands, the use of at least 20 μM of similar naphthalimide probes was required in typical cellular imaging experiments and under similar conditions.37
Conclusions
A colorimetric and fluorescent fluoride probe was developed based on a boron-modified 1,8-naphthalimide derivative. The coordination motif between the fluoride and the boron centre, coupled with hydrogen bonding and eventual deprotonation of the –NH fragment, account for the enhanced selectivity toward F− ions. Preliminary experiments to evaluate probe 1 in cellular imaging applications indicate that probe 1 may be considered a viable system for the bioimaging of prostate cancer cells. We are currently interested in developing these types of 4-amino-1,8-naphthalimide derivatives as intracellular sensors for a variety of substrates and explore their applications towards multimodal optical imaging coupled with PET (Positron Emission Tomography) using rapid 18F labelling in polar environments. While probe 1 shows some promising relevant properties for this, its current specificity for prostate cancer cells is suboptimal: therefore, we are currently developing related systems with improved selectivity for such biological targets.Experimental
Synthesis and characterisation of probe 1
0.287 g (1.06 mmol) Naphthalimidehydrazine dissolved in MeOH/DMF and 0.252 g (1.08 mmol) boronate ester aldehyde was added, stirring at room temperature for 12 hours. Solid was precipitated out after pouring mixture into ice-water. The crude product were first tried to purify by recrystallisation then with flash column chromatography to afford probe 1 (0.04 g) with a yield of 8%. m.p. 240 °C;1H NMR (300 MHz, (CD3)2SO) 11.67 (s, NH, 1H), 8.98 (s, 1H), 8.49 (d, J = 7.2 Hz, 1H), 8.37 (d, J = 8.5 Hz, 1H), 8.15 (d, J = 7.8 Hz, 1H), 7.78 (m, 3H), 7.57 (t, J = 7.4 Hz, 1H), 7.41 (t, J = 7.3 Hz, 1H), 3.98 (d, J = 7.3 Hz, 2H), 1.63 (m, 2H), 1.36 (s, 12H), 0.93 (t, J = 7.4 Hz, 3H); 13C NMR (75.5 MHz, (CD3)2SO) 164.0, 163.4, 147.0, 144.9, 140.3, 136.0, 133.8, 131.5, 131.3, 129.5, 129.2, 128.8, 125.6, 125.3, 122.3, 119.1, 111.5, 107.7, 84.3, 25.0, 21.3, 11.8; ESI Mass [M + H+] C28H30B1N3O4 Calculated 484.2363, found 484.2343.Synthesis and characterisation of probe 2
0.135 g (0.50 mmol) Naphthalimidehydrazine together with salicylaldehyde (0.073 g, 0.6 mmol) were refluxed in ethanol (30 ml) for 5 h. Then the mixture was cooled and recrystallized from ethanol to afford probe 2 in the yield of 75% (0.14 g). m. p. 254 °C; 1H NMR(300 MHz, (CD3)2SO) 11.47 (s, 1H), 10.24 (s, 1H), 8.81 (ds, J = 8.6 Hz, 2H), 8.47 (d, J = 6.6 Hz, 1H), 8.37 (d, J = 8.5 Hz, 1H), 7.80 (m, 2H), 7.64 (d, J = 8.5 Hz, 1H), 7.25 (m, 1H), 6.91 (m, 2H), 3.98 (t, J = 7.4 Hz, 2H), 1.62 (m, 2H), 0.90 (t, J = 7.4 Hz, 3H); 13C NMR (75.5 MHz, (CD3)2SO 164.1, 163.3, 156.6, 146.7, 142.4, 134.0, 131.2, 129.5, 128.6, 126.8, 125.3, 122.3, 120.9, 119.9, 119.0, 116.5, 111.1, 106.8, 41.2, 21.3, 11.8; ESI-Mass: [M + H+] C22H20N3O3+ Calculated 374.1499, found 374.1518; Elemental Analysis (%): Calc. C: 70.7, H: 5.13, N: 11.2; found C: 70.1. H: 5.15, N: 11.1.Cells culture and epifluorescence microscopy
Prostate cancer (PC-3) cells were grown as monolayers in T75 tissue culture flasks, and cultured in Roswell Park Memorial Institute medium (RPMI) supplemented with 10% fetal bovine serum, 1% L-glutamine (200 mM), 0.5% penicillin/streptomycin (10![[thin space (1/6-em)]](https://www.rsc.org/images/entities/char_2009.gif) 000 IU mL−1/10
000 IU mL−1/10![[thin space (1/6-em)]](https://www.rsc.org/images/entities/char_2009.gif) 000 mg mL−1). Cells were maintained at 37 °C in a 5% CO2 humidified atmosphere and grown to approximately 85% confluence before being split using a 2.5% trypsin solution. For microscopy, cells were seeded into glass bottomed Petri dishes and incubated for 24 h to ensure adhesion. There were two concentration of probe 1 stock solutions prepared, namely: 1 mM and 0.2 mM, in the final volume they were diluted 100 times into 10 μM and 2 μM respectively. The optimum concentration used in this experiment was made up of 10 μL of the 0.2 mM probe 1 stock solution (containing 1% of CH3CN) and 990 μL of RPMI serum free medium. Cells were washed 5 times with 1 mL Hank's Balanced Salt Solution (HBSS) and incubated with the 2 μM probe 1 at 37 °C for 15 min. Cells were washed three times with HBSS prior to imaging. Epifluorescence imaging was performed on a Nikon Eclipse TE2000-E epifluorescence microscope. It was carried using a mercury lamp (Nikon HG-100W, Tokyo, Japan) and a high-definition cooled colour digital camera (DXM 1200C, with 12.6-mega output pixels). Fluorescence images were captured using the GFP-L (green) channel: λex = 460–500 nm, λem = 510 nm long pass. Images were collected and analysed via Nikon NIS-Elements software package.
000 mg mL−1). Cells were maintained at 37 °C in a 5% CO2 humidified atmosphere and grown to approximately 85% confluence before being split using a 2.5% trypsin solution. For microscopy, cells were seeded into glass bottomed Petri dishes and incubated for 24 h to ensure adhesion. There were two concentration of probe 1 stock solutions prepared, namely: 1 mM and 0.2 mM, in the final volume they were diluted 100 times into 10 μM and 2 μM respectively. The optimum concentration used in this experiment was made up of 10 μL of the 0.2 mM probe 1 stock solution (containing 1% of CH3CN) and 990 μL of RPMI serum free medium. Cells were washed 5 times with 1 mL Hank's Balanced Salt Solution (HBSS) and incubated with the 2 μM probe 1 at 37 °C for 15 min. Cells were washed three times with HBSS prior to imaging. Epifluorescence imaging was performed on a Nikon Eclipse TE2000-E epifluorescence microscope. It was carried using a mercury lamp (Nikon HG-100W, Tokyo, Japan) and a high-definition cooled colour digital camera (DXM 1200C, with 12.6-mega output pixels). Fluorescence images were captured using the GFP-L (green) channel: λex = 460–500 nm, λem = 510 nm long pass. Images were collected and analysed via Nikon NIS-Elements software package.
Acknowledgements
TDJ, SX and XS are grateful for financial support from China Scholarship Council (CSC) and University of Bath Full Fees Scholarship. The Natural Science Foundation of China provided support (YBJ). TDJ thanks Xiamen University for a guest professorship. SIP, RLA and HG thank the EC for an ERC Consolidator grant (O2SENSE) and the Royal Society for funding as well as the University of Bath for studentships. Dr Colin Wright (Nikon Bioimaging UK Ltd) and Prof. Stan Botchway (Research Complex at Harwell) are thanked for helpful discussions and training in the imaging experiment setup. The Catalysis and Sensing for our Environment (CASE) network is thanked for research exchange opportunities.Notes and references
- P. D. Beer and P. A. Gale, Angew. Chem., Int. Ed., 2001, 40, 486–516 CrossRef CAS.
- T. Gunnlaugsson, M. Glynn, G. M. Tocci, P. E. Kruger and F. M. Pfeffer, Coord. Chem. Rev., 2006, 250, 3094–3117 CrossRef CAS PubMed.
- C. Suksai and T. Tuntulani, Chem. Soc. Rev., 2003, 32, 192–202 RSC.
- R. M. Duke, E. B. Veale, F. M. Pfeffer, P. E. Kruger and T. Gunnlaugsson, Chem. Soc. Rev., 2010, 39, 3936–3953 RSC.
- M. Cametti and K. Rissanen, Chem. Commun., 2009, 2809–2829 RSC.
- T. Gunnlaugsson, H. D. P. Ali, M. Glynn, P. E. Kruger, G. M. Hussey, F. M. Pfeffer, C. M. G. dos Santos and J. Tierney, J. Fluoresc., 2005, 15, 287–299 CrossRef CAS PubMed.
- C. Nakai and J. A. Thomas, J. Biol. Chem., 1974, 249, 6459–6467 CAS.
- L. S. Kaminsky, M. C. Mahoney, J. Leach, J. Melius and M. J. Miller, Crit. Rev. Oral Biol. Med., 1990, 1, 261–282 CAS.
- J. D. B. Featherstone, Community Dent. Oral Epidemiol., 1999, 27, 31–40 CrossRef CAS PubMed.
- S. Ayoob and A. K. Gupta, Crit. Rev. Environ. Sci. Technol., 2006, 36, 433–487 CrossRef CAS.
- S. K. Kim and J. Yoon, Chem. Commun., 2002, 770–771 RSC.
- T. D. Thangadurai, C. J. Lee, S. H. Jeong, S. Yoon, Y. G. Seo and Y. I. Lee, Microchem. J., 2013, 106, 27–33 CrossRef CAS PubMed.
- B. Liu and H. Tian, Chem. Lett., 2005, 34, 686–687 CrossRef CAS.
- W. W. Huang, Z. Y. Yang, H. Lin and H. K. Lin, J. Fluoresc., 2013, 23, 21–29 CrossRef CAS PubMed.
- E. J. Cho, B. J. Ryu, Y. J. Lee and K. C. Nam, Org. Lett., 2005, 7, 2607–2609 CrossRef CAS PubMed.
- S. O. Kang, J. M. Llinares, D. Powell, D. VanderVelde and K. Bowman-James, J. Am. Chem. Soc., 2003, 125, 10152–10153 CrossRef CAS PubMed.
- P. Piatek and J. Jurczak, Chem. Commun., 2002, 2450–2451 RSC.
- A. F. D. de Namor, M. Shehab, R. Khalife and I. Abbas, J. Phys. Chem. B, 2007, 111, 12177–12184 CrossRef PubMed.
- A. Aydogan, D. J. Coady, V. M. Lynch, A. Akar, M. Marquez, C. W. Bielawski and J. L. Sessler, Chem. Commun., 2008, 1455–1457 RSC.
- C. R. Cooper, N. Spencer and T. D. James, Chem. Commun., 1998, 1365–1366 RSC.
- C. Dusemund, K. Sandanayake and S. Shinkai, J. Chem. Soc., Chem. Commun., 1995, 333–334 RSC.
- T. W. Hudnall and F. P. Gabbai, J. Am. Chem. Soc., 2007, 129, 11978–11986 CrossRef CAS PubMed.
- Y. Kubo, M. Yamamoto, M. Ikeda, M. Takeuchi, S. Shinkai, S. Yamaguchi and K. Tamao, Angew. Chem., Int. Ed., 2003, 42, 2036–2040 CrossRef CAS PubMed.
- Z. Q. Liu, M. Shi, F. Y. Li, Q. Fang, Z. H. Chen, T. Yi and C. H. Huang, Org. Lett., 2005, 7, 5481–5484 CrossRef CAS PubMed.
- S. Yamaguchi, S. Akiyama and K. Tamao, J. Am. Chem. Soc., 2001, 123, 11372–11375 CrossRef CAS PubMed.
- T. W. Hudnall, C.-W. Chiu and F. P. Gabbai, Acc. Chem. Res., 2009, 42, 388–397 CrossRef CAS PubMed.
- T. Nishimura, S. Y. Xu, Y. B. Jiang, J. S. Fossey, K. Sakurai, S. D. Bull and T. D. James, Chem. Commun., 2013, 49, 478–480 RSC.
- X. H. Cheng, S. Li, G. H. Xu, C. G. Li, J. G. Qin and Z. Li, ChemPlusChem, 2012, 77, 908–913 CrossRef CAS.
- J. Ren, Z. Wu, Y. Zhou, Y. Li and Z. X. Xu, Dyes Pigm., 2011, 91, 442–445 CrossRef CAS PubMed.
- T. H. Kim and T. M. Swager, Angew. Chem., Int. Ed., 2003, 42, 4803–4806 CrossRef CAS PubMed.
- T. W. Hudnall, M. Melaimi and F. P. Gabbai, Org. Lett., 2006, 8, 2747–2749 CrossRef CAS PubMed.
- Z. Xu, S. K. Kim, S. J. Han, C. Lee, G. Kociok-Kohn, T. D. James and J. Yoon, Eur. J. Org. Chem., 2009, 3058–3065 CrossRef CAS.
- S. Jin, J. Wang, M. Li and B. Wang, Chem. – Eur. J., 2008, 14, 2795–2804 CrossRef CAS PubMed.
- S. Trupp, A. Schweitzer and G. J. Mohr, Org. Biomol. Chem., 2006, 4, 2965–2968 CAS.
- J. Wang, S. Jin, S. Akay and B. Wang, Eur. J. Org. Chem., 2007, 2091–2099 CrossRef CAS.
- N. DiCesare, D. P. Adhikari, J. J. Heynekamp, M. D. Heagy and J. R. Lakowicz, J. Fluoresc., 2002, 12, 147–154 CrossRef CAS.
- (a) M. Li, H. B. Ge, R. L. Arrowsmith, V. Mirabello, S. W. Botchway, W. H. Zhu, S. I. Pascu and T. D. James, Chem. Commun., 2014, 50, 11806–11809 RSC; (b) Z. Hu, G. D. Pantoş, N. Kuganathan, R. L. Arrowsmith, R. M. J. Jacobs, G. Kociok-Köhn, J. O'Byrne, K. Jurkschat, P. Burgos, R. M. Tyrrell, S. W. Botchway, J. K. M. Sanders and S. I. Pascu, Adv. Funct. Mater., 2012, 22, 503–518 CrossRef CAS.
- X. Sun, Q. Xu, G. Kim, S. E. Flower, J. P. Lowe, J. Yoon, J. S. Fossey, X. Qian, S. D. Bull and T. D. James, Chem. Sci., 2014, 5, 3368–3373 RSC.
- J. Gan, H. Tian, Z. H. Wang, K. H. Chen, J. Hill, P. A. Lane, M. D. Rahn, A. M. Fox and D. D. C. Bradley, J. Organomet. Chem., 2002, 645, 168–175 CrossRef CAS.
- H. D. P. Ali, P. E. Kruger and T. Gunnlaugsson, New J. Chem., 2008, 32, 1153–1161 RSC.
- B. Liu and H. Tian, J. Mater. Chem., 2005, 15, 2681–2686 RSC.
- H. Yang, H. S. Song, Y. C. Zhu and S. P. Yang, Tetrahedron Lett., 2012, 53, 2026–2029 CrossRef CAS PubMed.
- E. M. Pérez, L. Sánchez, G. Fernández and N. Martín, J. Am. Chem. Soc., 2006, 128, 7172–7173 CrossRef PubMed.
Footnote |
| † Electronic supplementary information (ESI) available. See DOI: 10.1039/c4ob02267j |
| This journal is © The Royal Society of Chemistry 2015 |

